

shaunl/iStock via Getty Images
DISCLAIMER: This note is intended for US recipients only and, in particular, is not directed at, nor intended to be relied upon by any UK recipients. Any information or analysis in this note is not an offer to sell or the solicitation of an offer to buy any securities. Nothing in this note is intended to be investment advice and nor should it be relied upon to make investment decisions. Cestrian Capital Research, Inc., its employees, agents or affiliates, including the author of this note, or related persons, may have a position in any stocks, security, or financial instrument referenced in this note. Any opinions, analyses, or probabilities expressed in this note are those of the author as of the note’s date of publication and are subject to change without notice. Companies referenced in this note or their employees or affiliates may be customers of Cestrian Capital Research, Inc. Cestrian Capital Research, Inc. values both its independence and transparency and does not believe that this presents a material potential conflict of interest or impacts the content of its research or publications.
In Which Amy Hood Saves Capitalism
We can keep this one brief. Microsoft reported earnings Tuesday after the bell. Having signaled weakness already by announcing a headcount cut – and previously FX headwinds – the pressure was on. And the company duly missed consensus expectations. In the middle of a fragile is-it-a-recovery-or-is-it-just-a-bear-rally phase in the market, the stage was set for a whole shelf load of shoes to drop and the question be resolved quick smart in favor of the bear.
Especially once you looked at the headline numbers.
MSFT Fundamentals (Company SEC filings, YCharts.com, Cestrian Analysis)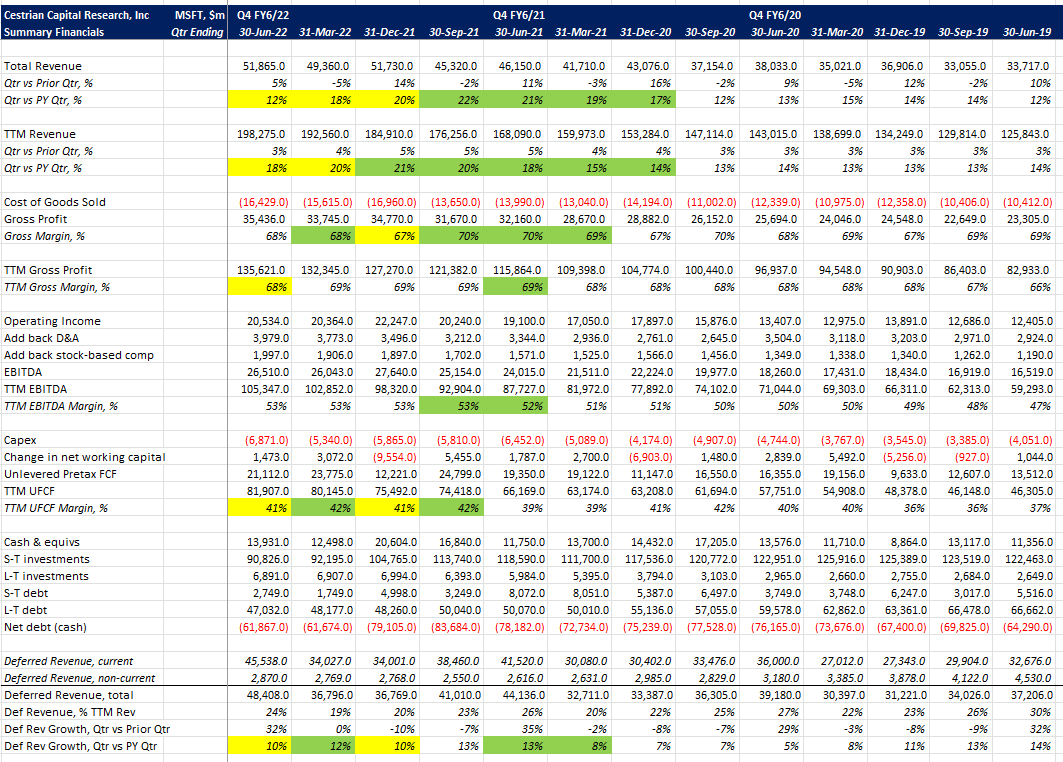
Anything on that table look exciting to you? Us neither. Revenue growth slowing for three quarters in succession, dragging down the slower-burn TTM revenue growth indicator these last two quarters. EBITDA margins flat, and unlevered pretax FCF margins also flat with a chance of down. Balance sheet still has more money on it than most nation states, but if you can’t think of anything to do with all that float in order to juice growth, then the hoard isn’t doing you much good, and you might as well start giving it back to shareholders in a more rapid fashion. It being their money and all.
The stock wobbled. It dropped on the print, and it dropped a little further before the earnings call.
In our Growth Investor Pro Marketplace service, we published our analysis before the earnings call, and we said the recognized numbers above aren’t so hot. But order intake – specifically the remaining performance obligation numbers – that looks good. “Microsoft will be fine,” we said. And cited this table. (Thanks Microsoft for putting the RPO number in the earnings release – many companies make you wait for the 10-Q or 10-K).
MSFT Fundamentals II (Company SEC filings, Cestrian Analysis)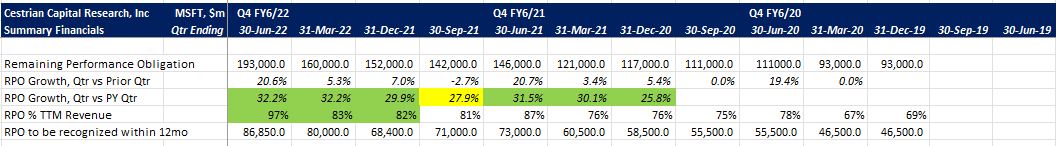
Remaining performance obligation is the total value of a company’s forward customer contract book – it’s orders to which customers have committed but that the company has not delivered. Deferred revenue – which you see on the balance sheet – is a subset of that, being the portion of RPO that has been prepaid even though it too has yet to be delivered. (One of the many reasons to love the subscription model).
RPO growth for MSFT in Q4 of their FY6/22 was very strong indeed. Up 32% vs. prior year and now representing 97% of TTM recognized revenue. That means you have a flywheel of forward orders equal in value to the whole of the last twelve months’ recognized revenue, and it’s growing at 32% year-on-year vs. the 18% year-on-year growth achieved by TTM recognized revenue. So you can say that the order book is growing faster than the recognized revenue base. And you can say that probably – not definitely, but probably – recognized revenue growth rates will rise.
And with that we said, this thing will be fine.
MSFT Stock Chart during earnings call (Interactive Brokers, Cestrian Capital Research)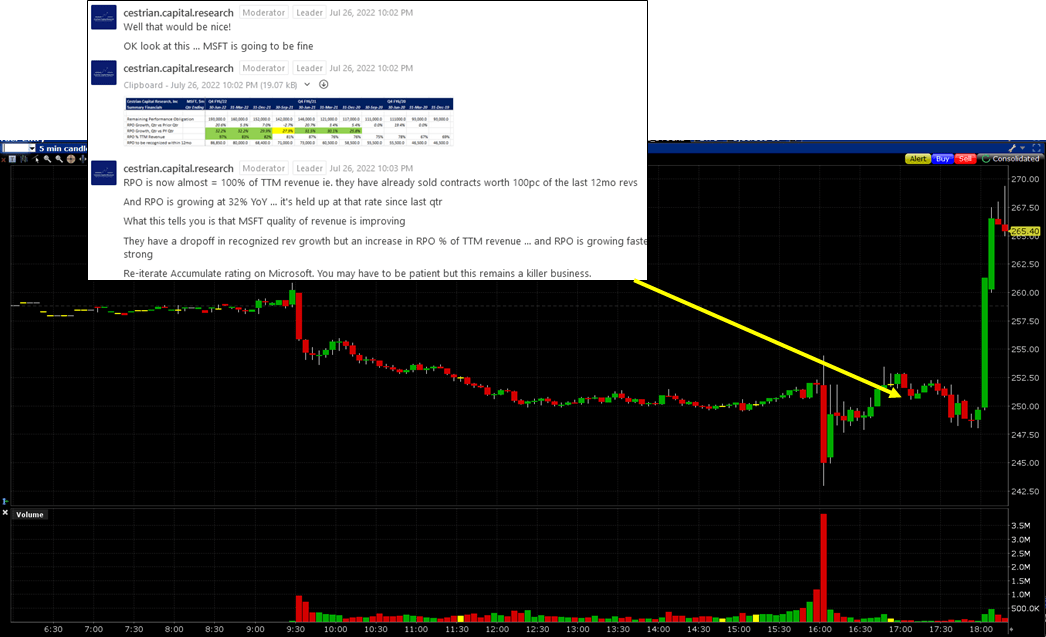
About an hour later, Amy Hood – Microsoft’s CFO – orchestrated a ballet with the analysts on the earnings call. Read the transcript if you have a moment, or replay the call. Skip the Satya Nadella part, he’s doing Corporate Big Dog 101 very well but interesting it is not. Go to where Hood starts explaining to the analyst community how their order intake is huge and how so many line items are growing faster than the market realizes. The chart above shows you the impact – right around 6 p.m. Eastern (note, the timestamp in our chatroom is London, so deduct 5 hours to match the stock chart) the stock just ramped and that was off the back of the orders narrative.
Then we had FOMC yesterday and the market was just on happy juice all day. So for now, the twin pillars of All That Is Good In Western Capitalism, being Microsoft Corp and the Federal Reserve, they’re telling you to cheer up and that everything will be OK in the future even if it’s all a little messed up right now.
The question is whether the market believes this narrative as the sugar high recedes. We’ll see how the market digests MSFT and QCOM and, later today, AAPL and AMZN earnings in the next 48 hours or so. And what the market really thinks of the FOMC speech. You can’t tell from the knee-jerk reaction, that’s just Big Money playing cat and mouse with Chad. By the end of the week, we’ll know the lay of the land better.
Back to Microsoft. The valuation is reasonable for the growth level, particularly if the company is able to ramp the growth rate.
MSFT Valuation (Company SEC filings, Cestrian Analysis, YCharts.com)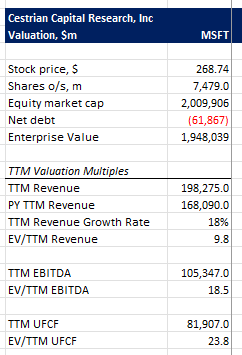
The stock chart is the chart of the market. It’s an unresolved question whether we remain in a bear market move down – and we’ve just had a move up within the overall downtrend – or whether in fact the market has bottomed. You can convince yourself of either, and the truth is you just have to wait to find out. And keep your account safe while matters resolve themselves. Here we capture bull ($351 min. target) and bear (stop loss below the $240 zip code) alike.
MSFT Chart (TradingView, Cestrian Analysis)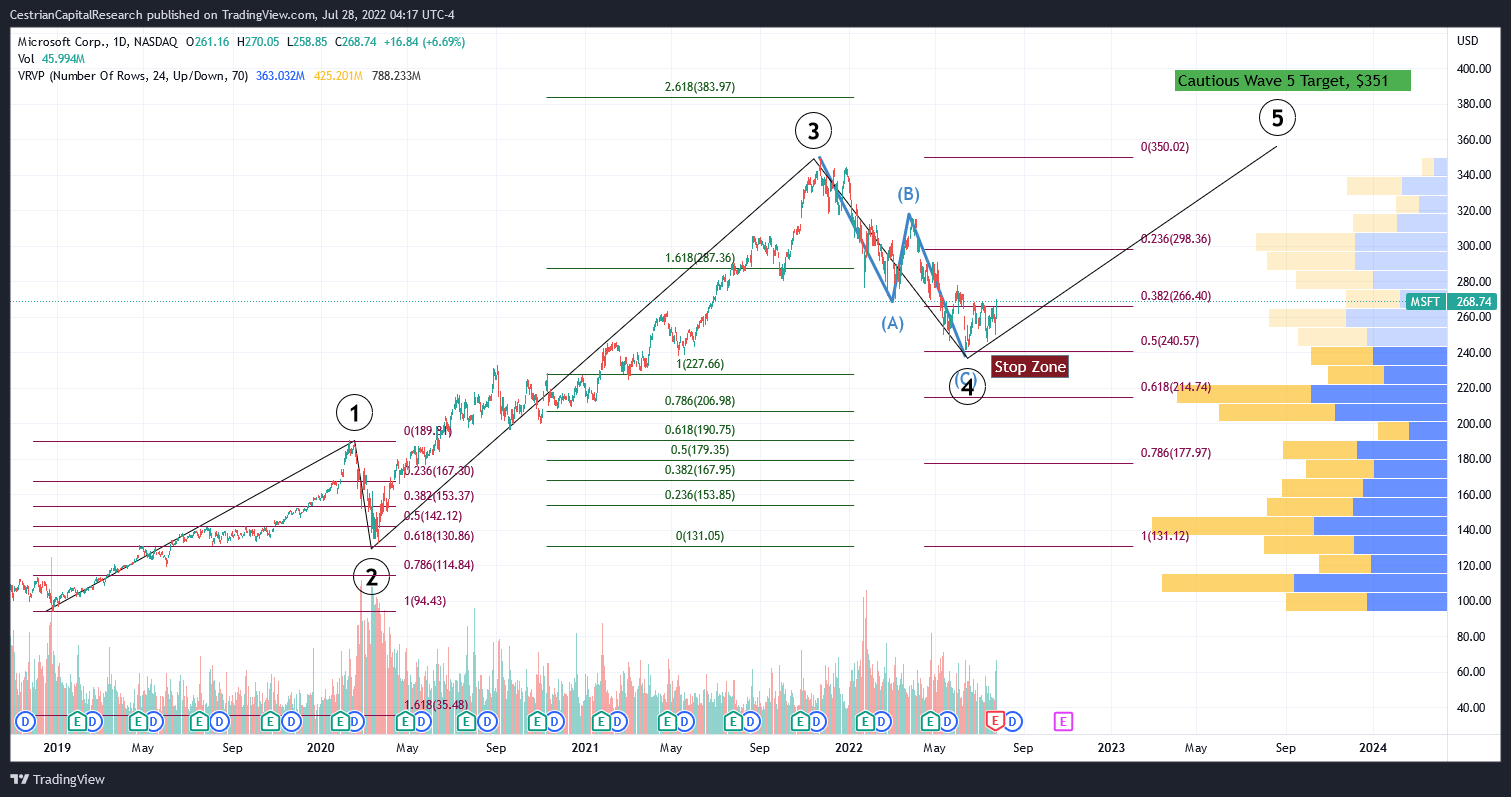
We rate Microsoft at Accumulate, since we lean bullish, but we think stops are very valuable right now in case the bear prevails.
Cestrian Capital Research, Inc – 28 July 2022.
Be the first to comment