

Michael Vi/iStock Editorial via Getty Images
In this analysis of Micron Technology, Inc. (NASDAQ:MU), we cover the company following its recent quarterly results where it concluded FY 2022 with a full-year revenue growth rate of 11% YoY. This is lower compared to our previous projections for the company’s growth rate of 19.83% in FY2022.
To determine if Micron’s long-term growth rate is slowing down, we first analyzed Micron’s revenue growth in the past quarter based on its pricing and shipment growth to determine the main factor affecting Micron’s growth. Moreover, we analyzed the DRAM and NAND markets based on our demand projections by end markets and updated our demand projections with the latest PC and smartphone market forecasts. We then compared this with our supply growth projections based on our forecast for Micron’s capex. Lastly, we compiled the pricing growth of DRAM and NAND in the first 3 quarters of 2022 and projected the market pricing growth for DRAM and NAND based on our projections of the market supply and demand.
FY2022 Growth Slowdown Due to Decline in ASP
In our previous analysis of Micron, we determined that pricing was a major driver of its revenue growth.
As the market DRAM ASP increased sharply, Micron’s revenue growth also shot up in 2017 followed by a moderating growth and a contraction in 2019 – Khaveen Investments
Furthermore, for NAND, we determined that “both pricing and bit growth have relatively equal influence on its total NAND revenues.”
In the table below, we compiled Micron’s revenue growth in the past 3 quarters as well as its ASP and unit shipment growth based on its earnings briefings to examine whether ASP or unit shipment growth contributed more to its growth.
|
Micron DRAM (FY) |
Q1 ’22 |
Q2 ’22 |
Q3 ’22 |
Q4 ’22 |
FY2022* |
Our FY2022 Projections* |
|
Unit Shipment Growth % |
-6% |
8% |
10% |
-13% |
38.1% |
13.50% |
|
ASP Growth % |
-2.5% |
-5% |
-0.4% |
-12.50% |
-19.3% |
0% |
|
QoQ Revenue Growth % |
-8.3% |
2.5% |
9.6% |
-24.2% |
11.5% |
13.50% |
|
Micron NAND |
Q1 ’22 |
Q2 ’22 |
Q3 ’22 |
Q4 ’22 |
FY2022* |
Our FY2022 Projections |
|
Unit Shipment Growth % |
0% |
-1% |
17.5% |
-22% |
20.8% |
21.30% |
|
ASP Growth % |
-5.0% |
5.0% |
-0.5% |
-7.5% |
-8.2% |
-2% |
|
QoQ Revenue Growth % |
-4.7% |
4.2% |
16.9% |
-27.9% |
10.9% |
19.20% |
*YoY
Source: Micron, Khaveen Investments
In Q4 FY2022, Micron’s revenue for DRAM declined by 24.3% QoQ. In terms of ASP, it “declined in the low-teens percent range” according to management, thus we estimated it at -12.5%. Based on this, we derived its unit shipment growth which is -13%, which is lower compared to its previous quarters’ growth with positive growth in Q2 and Q3 2022.
Furthermore, Micron’s NAND revenue declined by 26.2% in Q4 2022. According to management, “ASPs declined in the mid-to high-single-digit percentage range,” thus we estimated it at -7.5%. Based on this, we calculated its unit shipment growth at -22%, higher than its ASP decline of 7.5%.
Additionally, we calculated Micron’s FY2022 growth for DRAM and NAND based on the full-year ASP growth and unit shipment growth. Based on the table, both DRAM and NAND grew by 11.5% and 10.9% YoY respectively in 2022. This is despite the decline in ASPs by 19.3% (DRAM) and 8.2% (NAND). Its growth was supported by unit shipment growth of 38.1% (DRAM) and 20.8% (NAND).
Overall, we analyzed its Q4 2022 revenue growth which was influenced by both ASP and unit shipment decline which led to its negative growth of 24.2%. Moreover, for NAND, its revenue growth of -27.9% was primarily contributed by the decline in unit shipments by 22% which is higher than its pricing decline of 7.5%. However, in terms of its performance for the full year of FY2022, compared to our previous projections as seen in the table above where we assumed its pricing to be lower than the actual pricing decline of 0% (actual -19.3%) for DRAM and -2% (actual -8.2%) for NAND. However, Micron’s DRAM shipments growth was higher than our forecast (13.5%) at 38.1% but its NAND shipments were nearly in line with our forecast (21.3%) at 20.8% in FY2022. All in all, we believe pricing continues to remain a key driver for Micron’s revenue growth despite the larger decline in unit shipment growth in Q4 FY2022 as we believe its full-year growth provides a more reflective indication of its growth.
Supply Growth Lower Than Demand Growth
According to Micron, the company forecasts “calendar 2022 PC unit sales to decline by an approximately mid-teens percentage year-over-year.” This is in line with IDC for the PC market growth forecast for 2022 which had been revised to decline by 12.8% in 2022 and also a negative outlook with a decline in 2023 by 2.6% as explained by the following quote.
Further contraction is also expected in 2023 as consumer demand has slowed, the education demand has been largely fulfilled, and enterprise demand gets pushed out due to worsening macroeconomic conditions. – IDC
We updated our forecast of the DRAM and NAND market for PC based on the latest market forecast CAGR from the IDC at -12.8% in 2022 and -2.6% in 2023 followed by the long-term CAGR of 0.8% for 2024 and beyond.
Furthermore, in the smartphone market, the company projects “calendar 2022 smartphone unit volume to decline by a high-single-digit percentage year-over-year.” This is also in line with IDC’s smartphone market growth forecast to decline by 6.5% in 2022 but “expects the setback to be short term and the market to rebound in 2023” and forecasted the market to grow by 5.2% YoY in 2023. Thus, we updated our projection of the smartphone DRAM and NAND market for the unit shipment growth based on the latest market forecast CAGR of -6.5% by the IDC in 2022 followed by 5.2% in 2023 and the long-term CAGR of 1.4% through 2026.
|
Market Unit Shipment Forecasts |
2022F |
2023F |
2024F |
2025F |
2026F |
5-year Average |
|
PC Unit Shipments (Previous) |
-8.20% |
3.50% |
3.50% |
3.50% |
3.50% |
1.16% |
|
PC Unit Shipments (New) |
-12.80% |
-2.60% |
0.80% |
0.80% |
0.80% |
-2.60% |
|
Smartphone Unit Shipments (Previous) |
-3.5% |
1.9% |
1.9% |
1.9% |
1.9% |
0.82% |
|
Smartphone Unit Shipments (New) |
-6.5% |
5.2% |
1.4% |
1.4% |
1.4% |
0.58% |
Source: IDC, Khaveen Investments
Compared to our previous analysis, the latest market forecasts based on the IDC as shown in the table above is lower for both PC and smartphone markets in 2022. For PC, the growth rate is lower from -8.2% to 12.8% in 2022 and the IDC forecasted 2023 growth to decline by 2.6% compared to the CAGR of 3.5% previously and 0.8% beyond 2023. Whereas the latest forecasts for the smartphone market are lower at 6.5% compared to 3.5% previously but growth is expected to rebound in 2023 at 5.2% and a long-term CAGR of 1.4% beyond that compared to 1.9% previously. All in all, the new forecasted PC market has a lower 5-year average of -2.26% compared to 1.16% in the previous forecasts whereas the new smartphone forecast has a slightly lower 5-year average of 0.58% compared to 0.82% previously.
We updated our projections of the DRAM and NAND demand growth based on our projections for the weighted end market growth in the table below from our previous analysis.
|
DRAM Market Demand |
2022F |
2023F |
2024F |
2025F |
|
Mobile Phones |
10.9% |
24.8% |
20.3% |
20.3% |
|
Consumer Electronics |
4.5% |
4.5% |
4.5% |
4.5% |
|
PCs |
-2.7% |
8.7% |
12.5% |
12.5% |
|
ICT Infrastructure |
12% |
12% |
12% |
12% |
|
Industrials |
1.70% |
1.70% |
1.70% |
1.70% |
|
Auto |
34% |
32% |
32% |
32% |
|
Total DRAM Demand Growth % |
8.1% |
14.8% |
14.4% |
14.7% |
|
NAND Market Demand |
2022F |
2023F |
2024F |
2025F |
|
Mobile Phones |
21.0% |
36.1% |
31.2% |
31.2% |
|
Consumer Electronics |
4.5% |
4.5% |
4.5% |
4.5% |
|
PCs |
15% |
29% |
33% |
33% |
|
ICT Infrastructure |
35.7% |
35.7% |
32.4% |
32.4% |
|
Industrials |
1.70% |
1.70% |
1.70% |
1.70% |
|
Auto |
85.6% |
91.1% |
84.5% |
59.9% |
|
Total NAND Demand Growth % |
23.2% |
32.7% |
34.4% |
33.5% |
Source: Khaveen Investments
As seen in the table, for DRAM, we forecasted its demand growth to be lower at 8.1% in 2022 with the slowdown in the PC and smartphone market but recover to 14.8% in 2023 with the expected recovery in PC and smartphone market unit sales growth. Whereas for NAND, we expect the demand growth to slow in 2022 at 23.2% and increase to 32.7% in 2023 with the expected recovery in the PC and smartphone markets.
However, according to management, the company explained in the earnings briefing that it expects supply growth to be below demand growth in 2023.
We expect calendar 2023 industry DRAM supply to grow well below demand growth. We are modeling a mid-single digit percentage growth in DRAM industry supply in 2023, which would represent the lowest ever industry supply growth. NAND supply growth in calendar 2023 is also expected to fall below demand growth. – Sanjay Mehrotra, President & CEO
We forecasted Micron’s supply growth based on our capex projections from our previous analysis of Micron where we expected the company to reduce its capex by 31% in 2022 and derived our net capex projections. Based on the total DRAM and NAND market shipments, we estimated Micron’s shipments based on its market share. We calculated its shipments increase for DRAM and NAND and computed its shipments increase/net capex factor. Based on a 3-year average shipment increase/net capex factor of 0.883x (DRAM) and 5.457x (NAND), we projected Micron’s supply through 2026.
|
Micron Supply Projections |
2019 |
2020 |
2021 |
2022F |
2023F |
2024F |
2025F |
2026F |
|
Micron Capex |
9,780 |
8,223 |
10,030 |
12,067 |
8,273 |
16,677 |
17,513 |
19,229 |
|
Micron Depreciation |
5,424 |
5,650 |
6,214 |
7,116 |
7,116 |
7,116 |
7,116 |
7,116 |
|
Micron Net Capex |
4,356 |
2,573 |
3,816 |
4,951 |
1,157 |
9,561 |
10,397 |
12,113 |
|
Micron DRAM Increase |
4,251 |
827 |
2,213 |
3,265 |
763 |
6,306 |
6,857 |
7,989 |
|
Micron NAND Increase |
-1,274 |
24,170 |
9,956 |
6,844 |
1,599 |
13,217 |
14,373 |
16,745 |
|
DRAM Shipments Increase/Capex |
1.418 |
0.455 |
0.777 |
0.883 |
0.883 |
0.883 |
0.883 |
0.883 |
|
NAND Shipments Increase/Capex |
-0.425 |
13.302 |
3.494 |
5.457 |
5.457 |
5.457 |
5.457 |
5.457 |
|
Micron DRAM |
36,667 |
37,494 |
39,707 |
42,972 |
43,736 |
50,042 |
56,899 |
64,888 |
|
Growth % |
13.1% |
2.3% |
5.9% |
8.2% |
1.8% |
14.4% |
13.7% |
14.0% |
|
Micron NAND |
56,213 |
80,383 |
90,339 |
97,183 |
98,783 |
112,000 |
126,372 |
143,117 |
|
Growth % |
-2.2% |
43.0% |
12.4% |
7.6% |
1.6% |
13.4% |
12.8% |
13.3% |
Source: Micron, Khaveen Investments
|
Micron Supply vs Demand |
2022F |
2023F |
2024F |
2025F |
2026F |
|
DRAM Demand Growth % |
8.1% |
14.8% |
14.4% |
14.7% |
14.3% |
|
NAND Demand Growth % |
23.2% |
32.7% |
34.4% |
33.5% |
31.0% |
|
Micron DRAM Supply Growth % |
8.2% |
1.8% |
14.4% |
13.7% |
14.0% |
|
Micron NAND Supply Growth % |
7.6% |
1.6% |
13.4% |
12.8% |
13.3% |
|
Micron DRAM Shipment Growth |
8.1% |
14.8% |
14.4% |
14.7% |
14.3% |
|
Micron NAND Shipment Growth |
7.6% |
1.6% |
13.4% |
12.8% |
13.3% |
Source: Micron, Khaveen Investments
All in all, we projected DRAM and NAND demand growth to slow in 2022 but increase in 2023 with the expected recovery in the PC and smartphone markets based on IDC market projections. However, we believe the expected cut in capex by Micron could lower its supply growth outlook in 2023 and forecasted its DRAM supply growth to be only 1.8% and lower than the market demand growth of 14.8%. Moreover, we expect its NAND supply growth to also be lower than demand growth at 1.6% compared to 32.7% in 2023. For Micron’s shipment growth forecasts, we based it on our supply growth for DRAM from 2023 which is lower than our forecasted market demand growth except in 2022 where we forecasted its demand growth (8.1%) lower than supply (8.2%). Whereas for NAND, we based our shipment growth forecast on the supply growth which is lower than our demand growth forecasts.
Positive Market Pricing Outlook
We compared the price change of DRAM and NAND between our projections and the actual price change in the table below.
|
2021 |
Actual |
Our Projections |
|
DRAM |
36.7% |
31.70% |
|
NAND |
-1.96% |
7.00% |
|
2022F (3 Quarters) |
Actual |
Our Projections* |
|
DRAM |
-6.1% |
0.00% |
|
NAND |
-15.1% |
-1.70% |
*Full year
Source: JCMIT, Khaveen Investments
As seen above, our projections for the DRAM and NAND market ASPs were higher than the actual Q1 to Q3 2022 decline of 6.1% and 15.1% respectively.
Furthermore, we forecasted the capex of Micron, SK Hynix and Samsung (OTCPK:SSNLF) from our previous analysis and calculated the net capex total less depreciation in the table below.
Micron, SK Hynix, Samsung, Khaveen Investments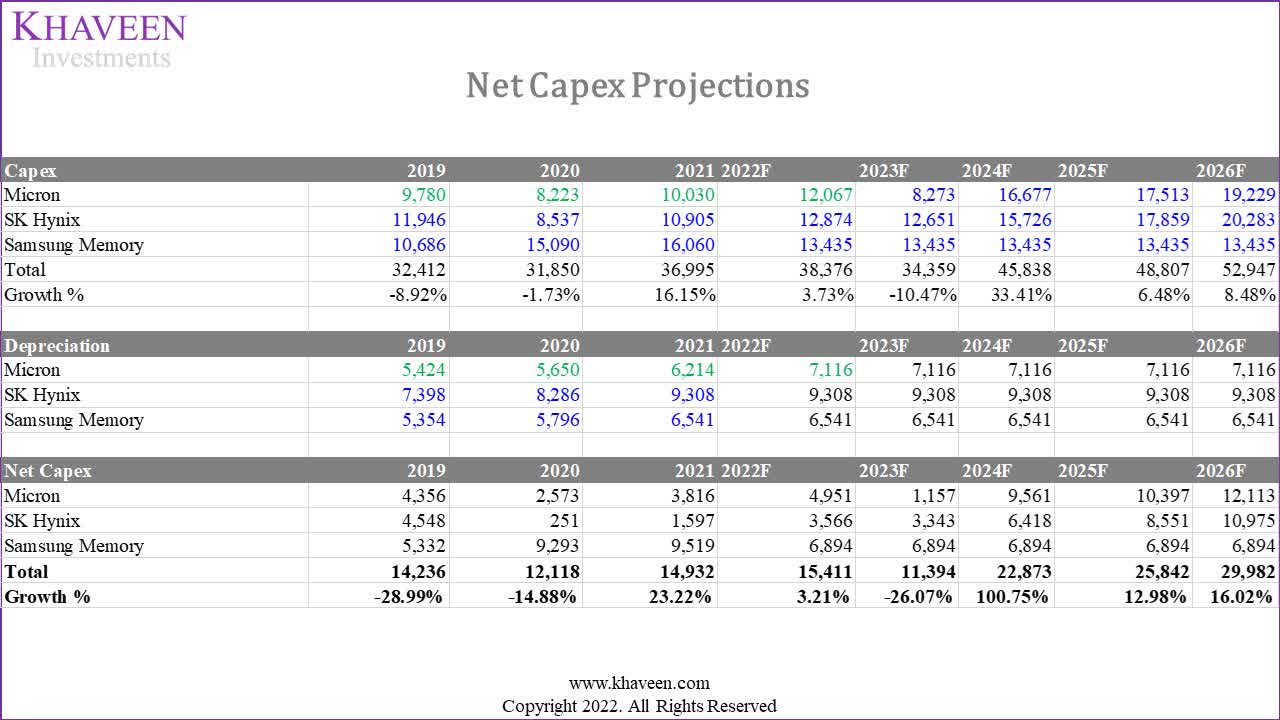
Based on our capex projections of the companies, we projected the market supply growth based on the shipment increase/net capex factor at a 3-year average of 1.31x (DRAM) and 27.99x (NAND).
Micron, SK Hynix, Samsung, Khaveen Investments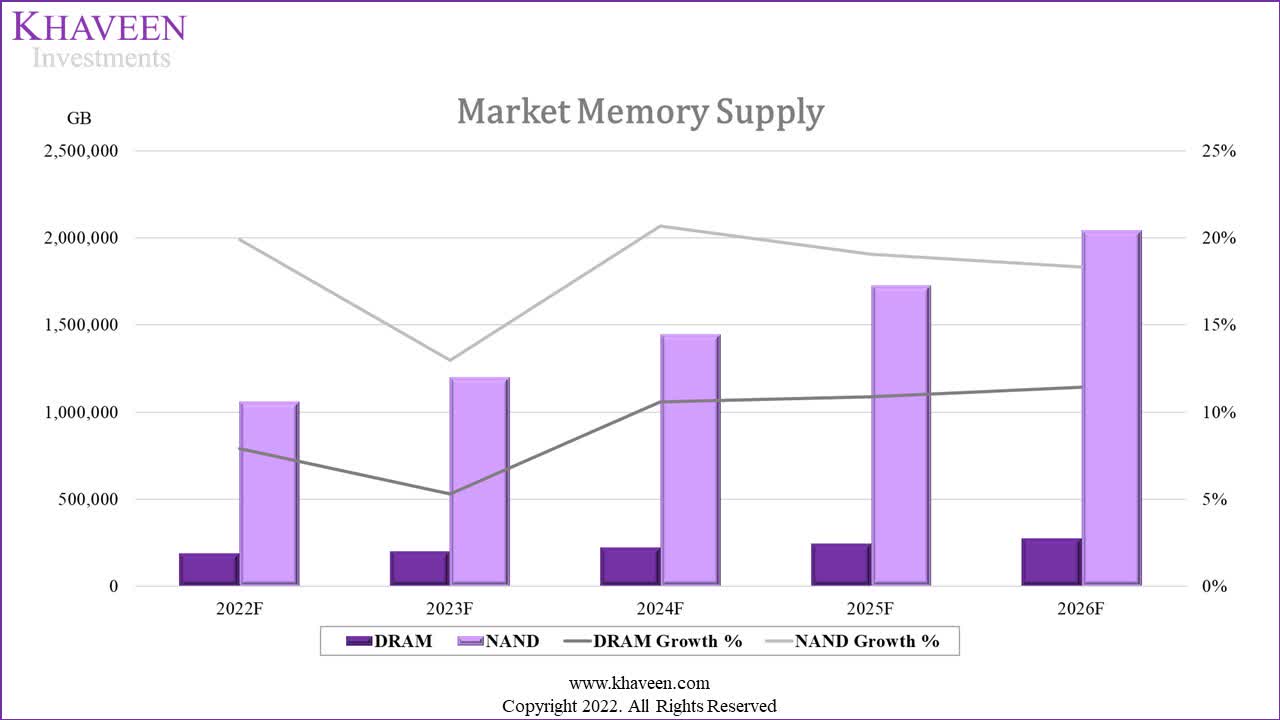
As seen in the table, we forecasted the DRAM and NAND supply growth at 5.3% and 13% respectively in 2023. Compared to our demand projections for DRAM and NAND, our projections show that supply growth is lower than demand growth through 2026.
|
Market Demand (Calendar Year) |
2022F |
2023F |
2024F |
2025F |
2026F |
|
DRAM Units |
192,394 |
220,873 |
252,683 |
289,932 |
331,320 |
|
Growth % |
8.1% |
14.8% |
14.4% |
14.7% |
14.3% |
|
NAND Units |
1,090,718 |
1,447,859 |
1,946,007 |
2,598,266 |
3,402,544 |
|
Growth % |
23.2% |
32.7% |
34.4% |
33.5% |
31.0% |
|
Market Supply |
2022F |
2023F |
2024F |
2025F |
2026F |
|
DRAM Units |
192,179 |
202,365 |
223,802 |
248,154 |
276,569 |
|
Growth % |
7.9% |
5.3% |
10.6% |
10.9% |
11.5% |
|
NAND Units |
1,062,080 |
1,199,846 |
1,447,758 |
1,724,020 |
2,039,868 |
|
Growth % |
19.9% |
13.0% |
20.7% |
19.1% |
18.3% |
|
Difference |
2022F |
2023F |
2024F |
2025F |
2026F |
|
DRAM |
0.1% |
9.5% |
3.8% |
3.9% |
2.8% |
|
NAND |
3.2% |
19.8% |
13.7% |
14.4% |
12.6% |
Source: Micron, SK Hynix, Samsung, Khaveen Investments
We calculated the difference between our demand and supply growth in % to factor this into our projections of the market ASP growth from our previous analysis. For example, in 2023, we previously forecasted DRAM pricing at $0.61 based on the long-term trendline of DRAM ASPs. We accounted for the difference between demand and supply of 9.5% in 2023 by multiplying it with our ASP projection in 2023 ($0.61) to obtain an ASP of $0.67.
Similarly for NAND, we accounted for the difference between our demand and supply projections of 19.8% in 2023 by multiplying it with our long-term NAND ASP forecast of $0.077 in 2023 to obtain $0.093. Furthermore, we based our DRAM and NAND ASP growth in 2022 on the actual Q1 to Q3 2022 market ASP growth.
|
Micron |
2021 |
2022F |
2023F |
2024F |
2025F |
|
DRAM ASP ($/GB) |
0.53 |
0.49 |
0.67 |
0.664 |
0.70 |
|
Change % |
29.6% |
-7.4% |
35.3% |
-0.5% |
4.7% |
|
NAND ASP ($/GB) |
0.077 |
0.066 |
0.093 |
0.088 |
0.089 |
|
Change % |
-1.96% |
-15.1% |
41.1% |
-5.0% |
0.6% |
Source: Khaveen Investments
Therefore, we believe that despite the decline in ASPs in 2022 for DRAM and NAND, the market pricing outlook for DRAM and NAND could be buoyed by the supply management of the top memory semicon chipmakers and we projected the market supply growth to be lower than demand growth. Thus, we expect this to provide a positive outlook for market pricing in 2023 and factor that into our projection for Micron.
Risk: Market Weakness
According to IDC, the PC market is now expected to decline by 12.8% in 2022 and decline by 2.6% in 2023. This is in contrast to its earlier forecast in June 2022 of -8.2% this year and positive growth in the next year as we covered in our previous analysis. Furthermore, according to its latest earnings briefing, Micron’s management highlighted that inventories are expected to be high in 2022 with the decline in demand.
Due to the sharp decline in near-term demand, we expect supply growth to be significantly above demand growth in calendar 2022, contributing to very high supply inventories for both DRAM and NAND. – Sanjay Mehrotra, President & CEO
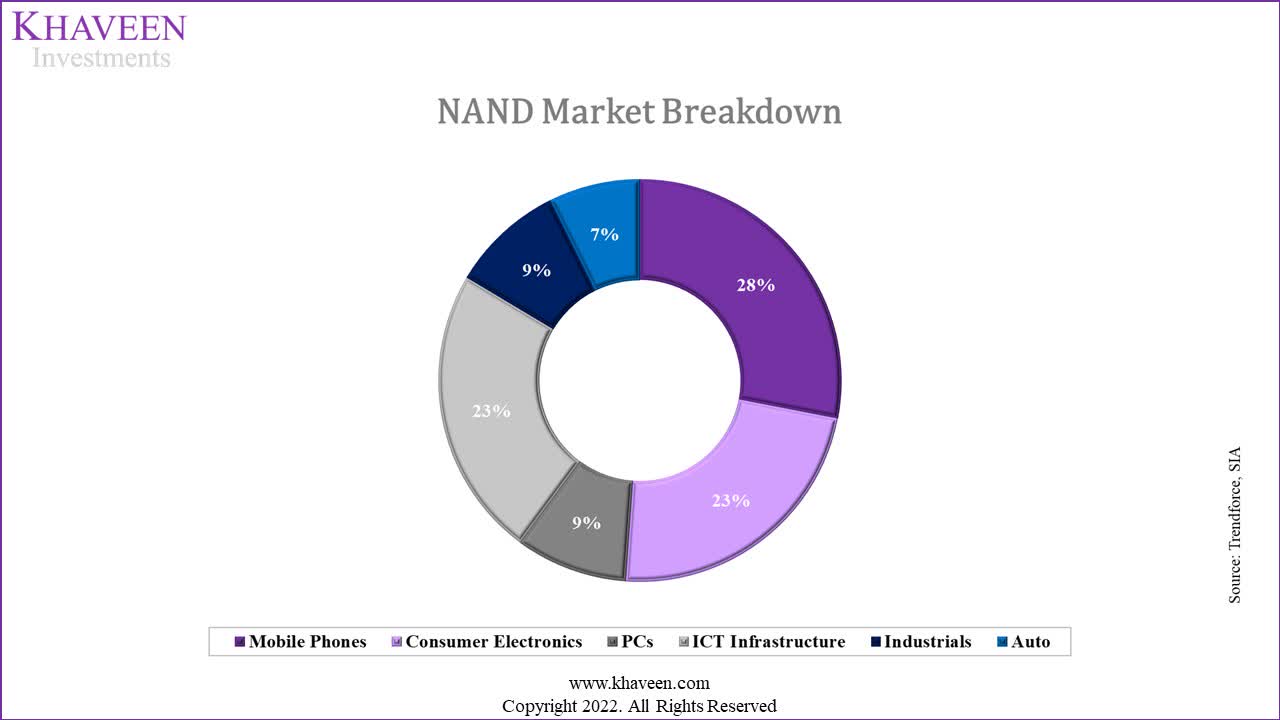
Thus, we believe this could pose a threat to the demand outlook and could affect Micron’s growth negatively as the PC and smartphone represent a significant portion of the DRAM (50%) and NAND (37%) market combined as seen in the chart below.
Trendforce, SIA, Khaveen Investments Trendforce, SIA, Khaveen Investments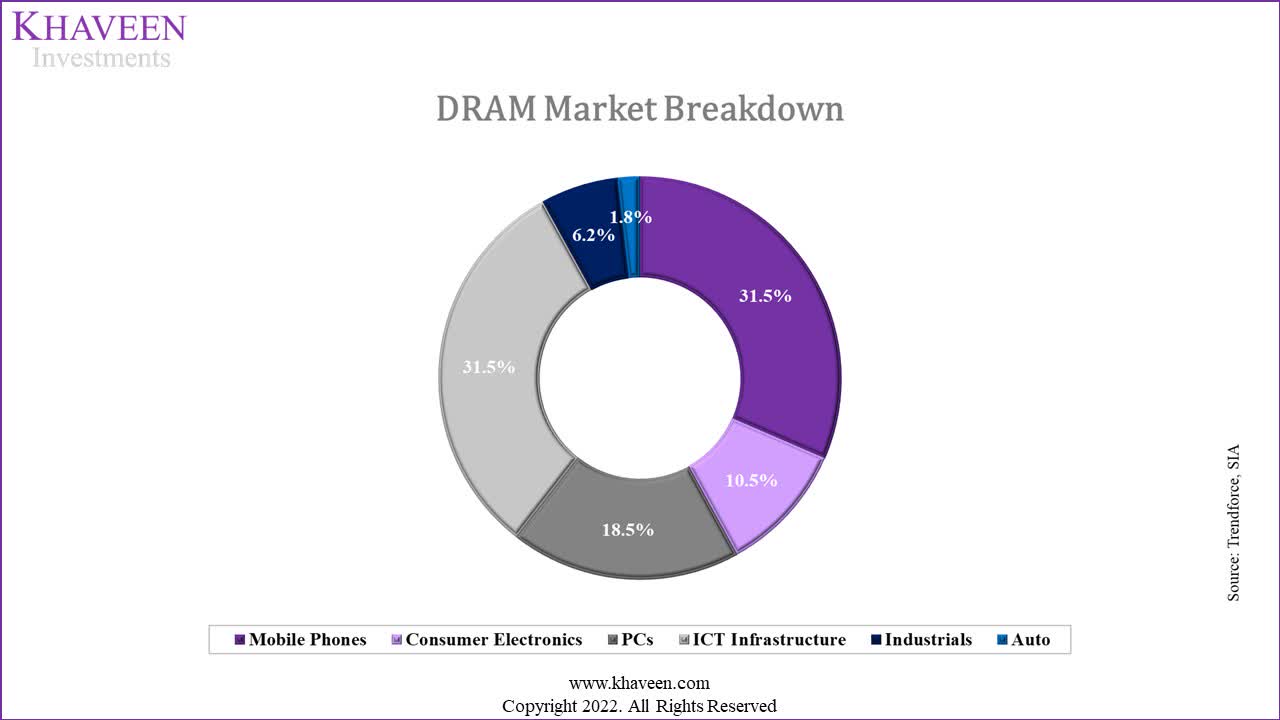
Valuation
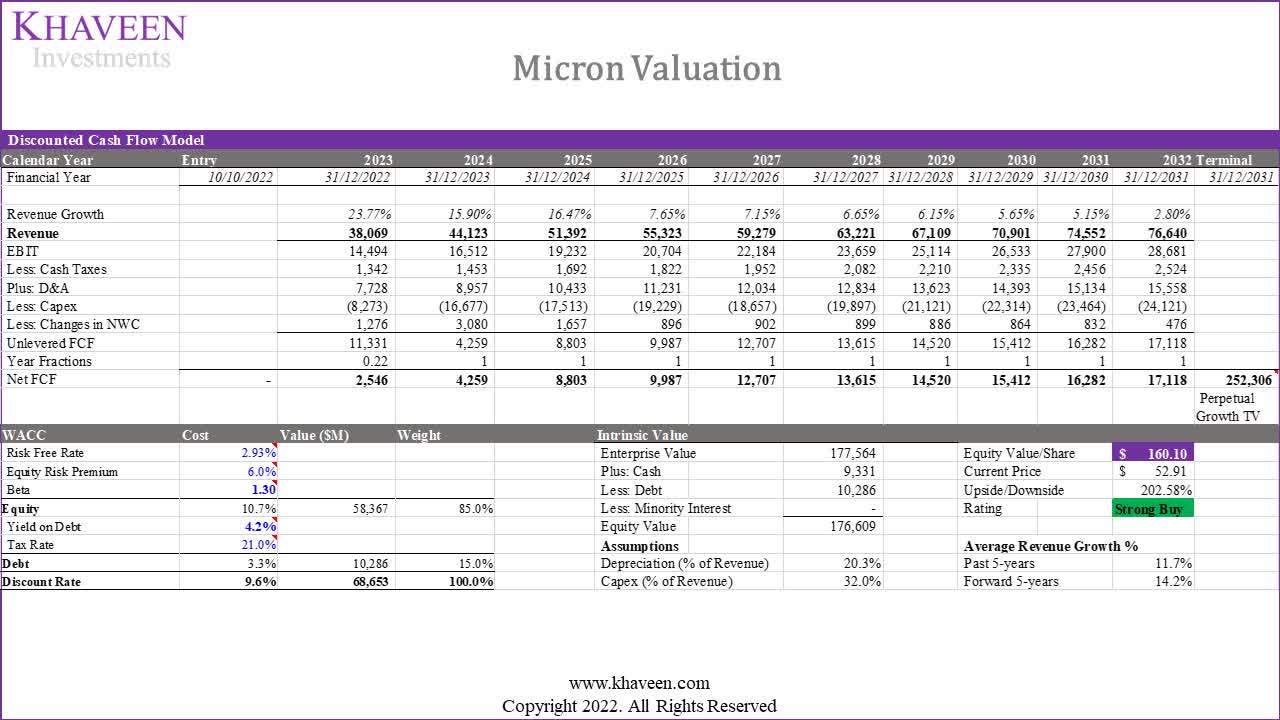
We updated our revenue projections for Micron based on our DRAM and NAND revenue projections through FY2025. However, compared to our previous analysis, we projected its forward 5-year revenue growth to be lower at 14.1% compared to 14.7% previously. All in all, despite the expected market slowdown in 2023, we believe the company’s growth to only have a minor impact with a small difference of 0.6% to our 5-year average forward revenue growth as we believe the total memory market capex reduction in 2022 could provide positive upside for pricing growth with supply lower than demand.
|
Micron Revenue Projection ($ bln) (Fiscal Year) |
2022 |
2023F |
2024F |
2025F |
|
DRAM |
22.39 |
27.42 |
32.22 |
38.07 |
|
Growth % |
11.7% |
22.5% |
17.5% |
18.1% |
|
NAND |
7.81 |
9.90 |
11.15 |
12.54 |
|
Growth % |
11.5% |
26.7% |
12.7% |
12.5% |
|
Others |
0.56 |
0.58 |
0.58 |
0.58 |
|
Growth % |
-17.0% |
-14.9% |
4.1% |
0.0% |
|
Total Revenue |
30.76 |
37.90 |
43.96 |
51.19 |
|
Total Growth % |
11.02% |
23.21% |
16.00% |
16.45% |
Source: Micron, Khaveen Investments
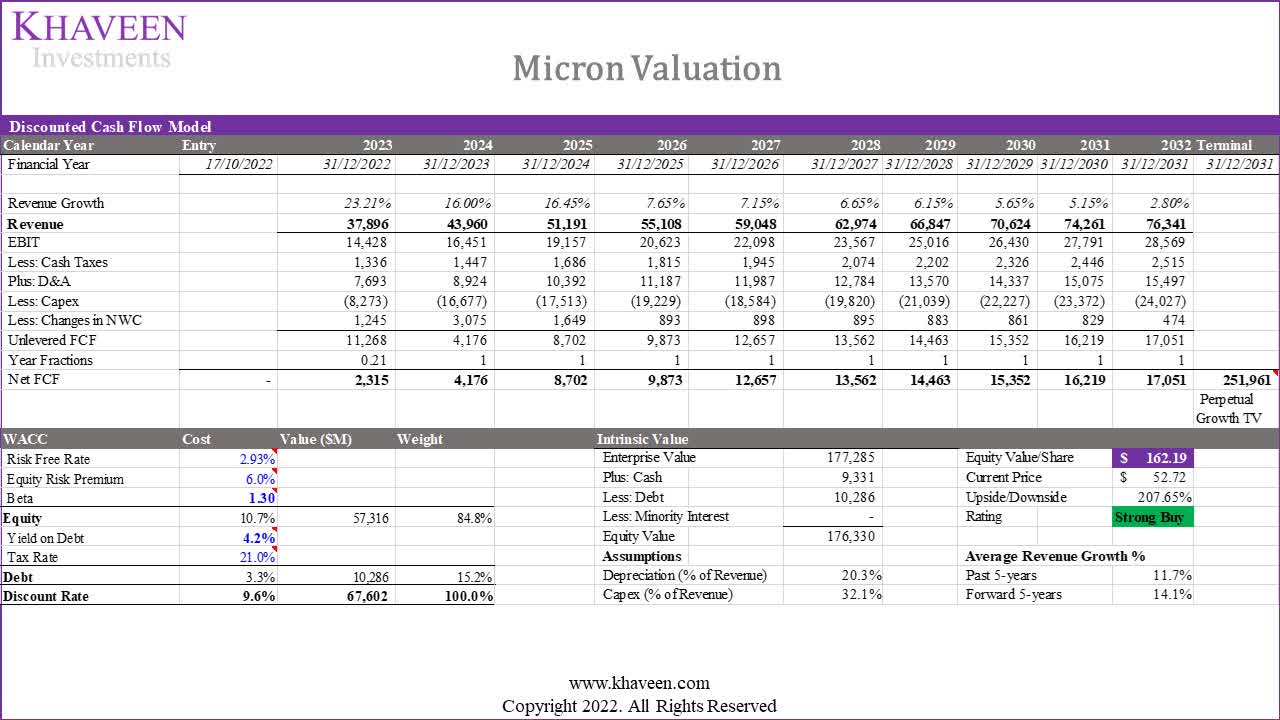
We valued the company with a discounted cash flow (“DCF”) analysis as we expect it to continue generating positive free cash flows (“FCFs”). We based the terminal value on a perpetual growth formula of the terminal value divided by the company’s WACC (9.6%) less our long-term GDP growth assumption (2.8%). Our model shows its shares are undervalued by 207%.
However, we accounted for the Molodovsky Effect with a discount rate of 30% as discussed in our previous analysis. This results in a price target of $113.53 with an upside of 115.4%.
|
Current Price |
DCF |
Molodovsky Effect Discount (30%) |
|
|
Valuation |
$52.72 |
$162.19 |
$113.53 |
|
Upside |
207.6% |
115.4% |
Source: Khaveen Investments
Verdict
To conclude, we determined that Micron’s revenue underperformance in FY2022 was due to the decline in ASPs for both DRAM and NAND by 19.3% and 8.2% respectively which weighed on its full-year revenue growth. Moreover, we updated our projections for the DRAM and NAND market with the latest market forecast by IDC which is a larger decline in 2022 and a continued decline in 2023 for the PC market. However, we projected Micron’s supply growth to be lower as it plans to reduce its capex in 2023. Moreover, market ASP growth for DRAM and NAND had been lower than our assumptions for 2022 but with our supply projections based on the forecasted top memory chipmakers’ capex in 2023, we expect supply to be lower than demand in 2023 and could buoy the market pricing.
Based on this, we updated our projections for Micron but a lower 5-year forward revenue growth of 14.1% compared to 14.7% previously and obtained a slightly lower price target by 8.8% of $113.53 after applying a 30% discount rate for the Molodovsky Effect. Thus, we maintained our Strong Buy rating for Micron with a minimal impact on its upside of 115.4% as Micron’s growth is still expected to remain relatively the same going forward.
Be the first to comment