

knowlesgallery
Following Micron Technology, Inc.’s (NASDAQ:MU) recent Q3 2022 earnings release, which was its record quarter across all segments with revenues growing by 16.4% YoY, the company issued updated guidance for Q4 2022. It projected revenue growth of -3% YoY, as the company cited weakness in PC and smartphone markets and changed its outlook for DRAM and NAND to grow below its long-term target in 2022. In addition, the market forecast for PC have also decreased to a forecast of -8.2% in 2022, as the actual sales in Q2 2022 declined by 15.3% YoY and the smartphone sales market forecast also decreased to -3.5% from 1% previously in 2022.
Thus, we analyze the impact on Micron and update our previous revenue projections for 2022 and beyond for the company by analyzing the potential impact of the decline in the PC and smartphone market on the memory market in terms of shipment growth.
Moreover, we looked into the sustainability of the company’s profitability margins as the company ramps up its 1-alpha and 176L NAND process and plans to introduce its next-gen 1-beta and 232 Layer NAND in 2022.
Lastly, we examine the company’s update on its capex guidance beyond 2022, as it highlighted that it is planning to reduce WFE purchases and forecasted its capex, by analyzing its capex growth vs revenue growth to project its free cash flow (“FCF”) and determine the impact on our price target based on discounted cash flow (“DCF”) valuation.
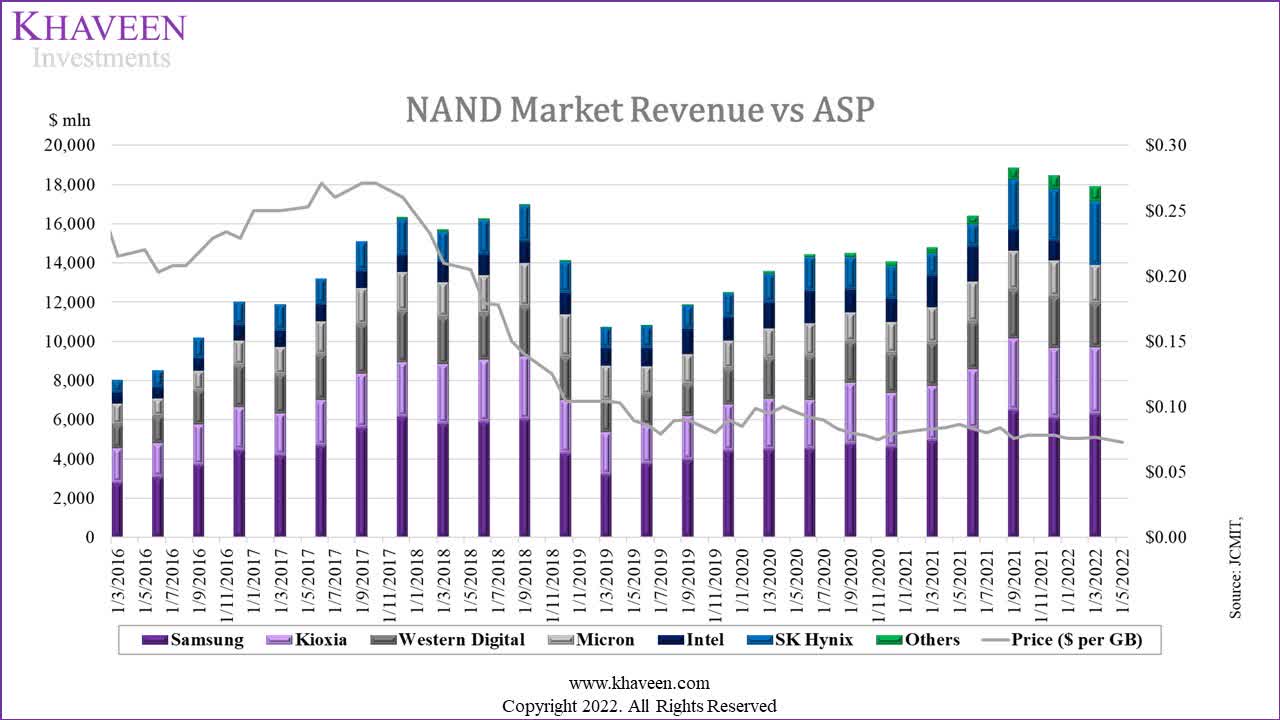
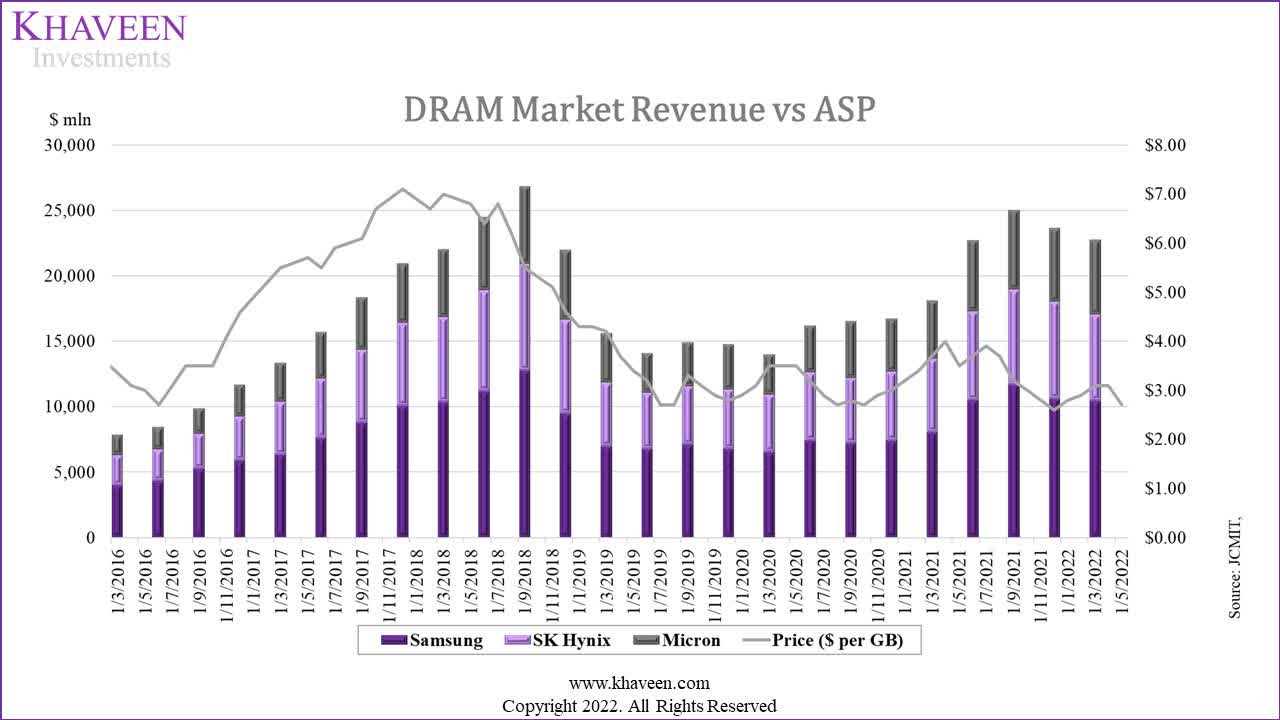
Lower DRAM and NAND Growth Forecasts of 13.5% and 21.5% in 2022
Trendforce, SIA, Khaveen Investments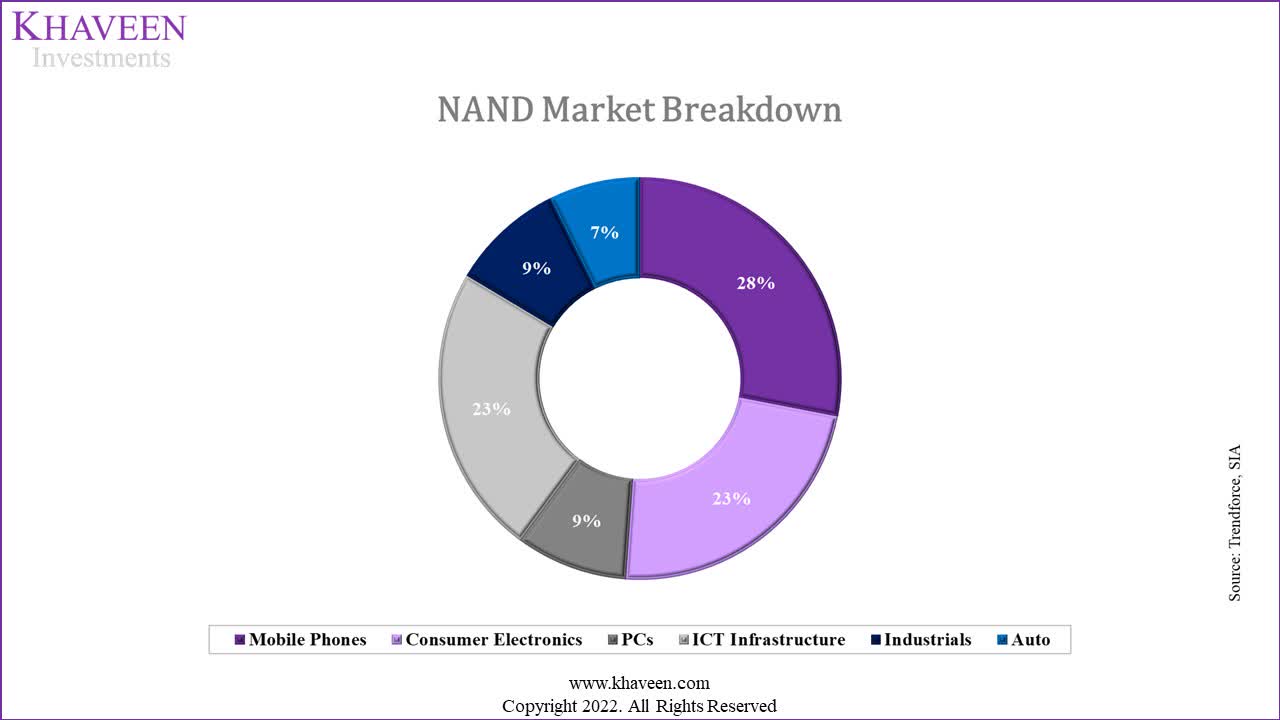
Source: Trendforce, SIA, Khaveen Investments
Trendforce, Khaveen Investments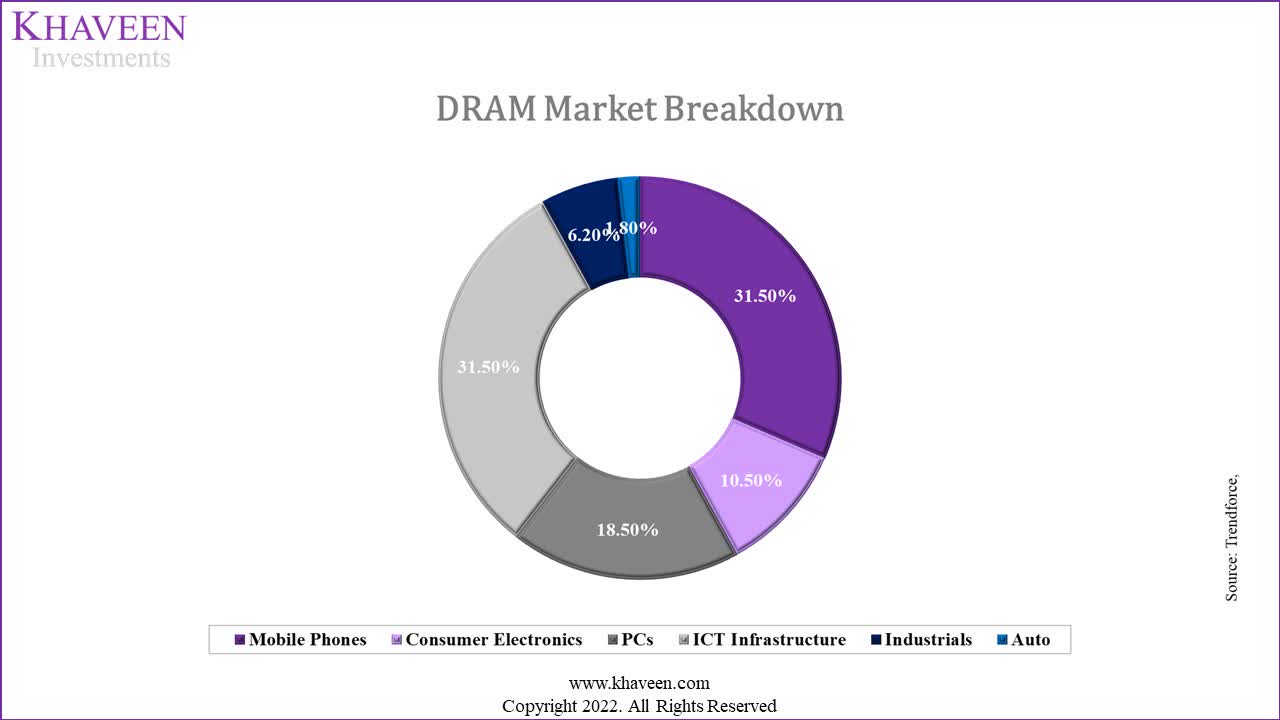
Based on its Q3 FY2022 earnings briefing, Micron cited consumer demand and inventory-related headwinds impacting the industry which affects its outlook in Q4 FY2022. It also highlighted the disruption of the restrictive measures in China on the global electronics supply chain. Micron also updated its outlook for the end markets including PC which is now expected to decline by nearly 10% YoY compared to an industry and customer forecast of roughly flat calendar 2022 PC unit sales at the start of the year. In the table below, we compared the actual PC market unit sales growth with forecasts from market research firm IDC, top PC makers – Lenovo (OTCPK:LNVGY, OTCPK:LNVGF), Dell (DELL), HP (HPQ) and ASUSTeK (OTC:AKCPF, OTCPK:ASUUY) – analyst revenue consensus growth, and Micron’s guidance.
|
PC Market Unit Sales Growth |
Q1 2022 |
Q2 2022 |
|
Market Forecast (‘IDC’) (Full year) |
-2.40% |
-8.2% |
|
Top PC Makers Guidance (Full year) |
3.83% |
-2.13% |
|
PC Makers Analyst Revenue Consensus (Full year) |
1.46% |
0.60% |
|
Micron Management Guidance (Full year) |
0.00% |
-10.00% |
|
Actual (YoY) |
-5.10% |
-15.30% |
Source: Micron, IDC, Company Data, Khaveen Investments
According to IDC, the PC market declined by 5.1% in Q1 2022, this was below the market forecast of -2.4% in our previous analysis of AMD (AMD). Moreover, the actual decline of 5.1% in Q1 was also lower than the average guidance of top PC makers (3.83%) which expected flat to mid-single digit growth in 2022. PC makers’ analyst revenue consensus of the top PC makers (1.46%) was also below the actual decline of 5.1%. Micron’s initial outlook at the start of “roughly flat” growth also was below the actual market decline.
In Q2 2022, total market PC shipments declined 15.3% YoY and were worse than expected with the supply and logistics disruption in China and macroeconomic headwinds based on the IDC, which updated its 2022 forecast to -8.2%. On the other hand, the average top PC makers’ guidance based on their latest earnings briefings turned from positive growth to negative (-2.13%). Additionally, the PC makers’ analyst revenue consensus was also slightly lower in Q2 at 0.6% compared to 1.46%.
Thus, based on the table, this indicates that market forecast, top PC makers and analyst consensus failed to accurately predict the PC market in 2022. Notwithstanding, we believe the market forecast on which we previously based our projections is the most reliable, as it was the only one to predict a decline in the PC market in 2022. Thus, we continue to base our projections on the market forecast of -8.2% in 2022.
|
PC DRAM and NAND Growth |
2021 |
2022F |
2023F |
2024F |
2025F |
|
Unit Sales (‘mln’) |
342 |
314 |
325 |
336 |
348 |
|
Growth Rate |
10.65% |
-8.20% |
3.50% |
3.50% |
3.50% |
|
PC DRAM Content Growth % |
11.63% |
11.63% |
11.63% |
11.63% |
11.63% |
|
Total PC DRAM Growth % |
24% |
2% |
16% |
16% |
16% |
|
PC NAND Content Growth |
21.60% |
21.60% |
21.60% |
21.60% |
21.60% |
|
Total PC NAND Growth % |
35% |
12% |
26% |
26% |
26% |
Source: Khaveen Investments
Moreover, in the smartphone market, in our previous analysis of QUALCOMM (QCOM), we highlighted that the market had declined by 11% YoY in Q1 2022 and was forecasted by Strategy Analytics for a full-year decline of 1%. Though, the latest forecast by IDC shows a larger forecasted decline of 3.5% in 2022 but with a positive long-term CAGR of 1.6% through 2026. Furthermore, Micron’s outlook had changed for total market shipments to decline by mid-single-digits percent in 2022 below earlier expectations of mid-single-digit growth. However, Micron also highlighted the content growth across the PC sector, with the shift towards enterprise PCs and new architectures as well as higher DRAM and NAND content driven by the shift to 5G.
|
Smartphone DRAM and NAND Growth |
2021 |
2022F |
2023F |
2024F |
2025F |
2026F |
|
Unit sales (‘mln’) |
1,352 |
1,335 |
1,341 |
1,348 |
1,355 |
1,362 |
|
Change % |
5% |
-3.5% |
1.9% |
1.9% |
1.9% |
1.9% |
|
Smartphone DRAM Content Growth % |
18.60% |
18.60% |
18.60% |
18.60% |
18.60% |
18.60% |
|
Total Smartphone DRAM Growth % |
24% |
14% |
21% |
21% |
21% |
21% |
|
Smartphone NAND Content Growth % |
26.6% |
26.6% |
26.6% |
26.6% |
26.6% |
26.6% |
|
Total Smartphone NAND Growth % |
32% |
22% |
29% |
29% |
29% |
29% |
Source: Khaveen Investments
Notwithstanding the slowdown in PC and smartphone markets, Micron also highlighted its positive long-term growth driven by data center, auto, and industrial markets. We summarized our long-term projections of the DRAM and NAND market breakdown by end market applications, where we expect the share of the data center (ICT infrastructure) and automotive market segments to rise, while mobile phone and PC shares gradually decline.
Trendforce, SIA, Khaveen Investments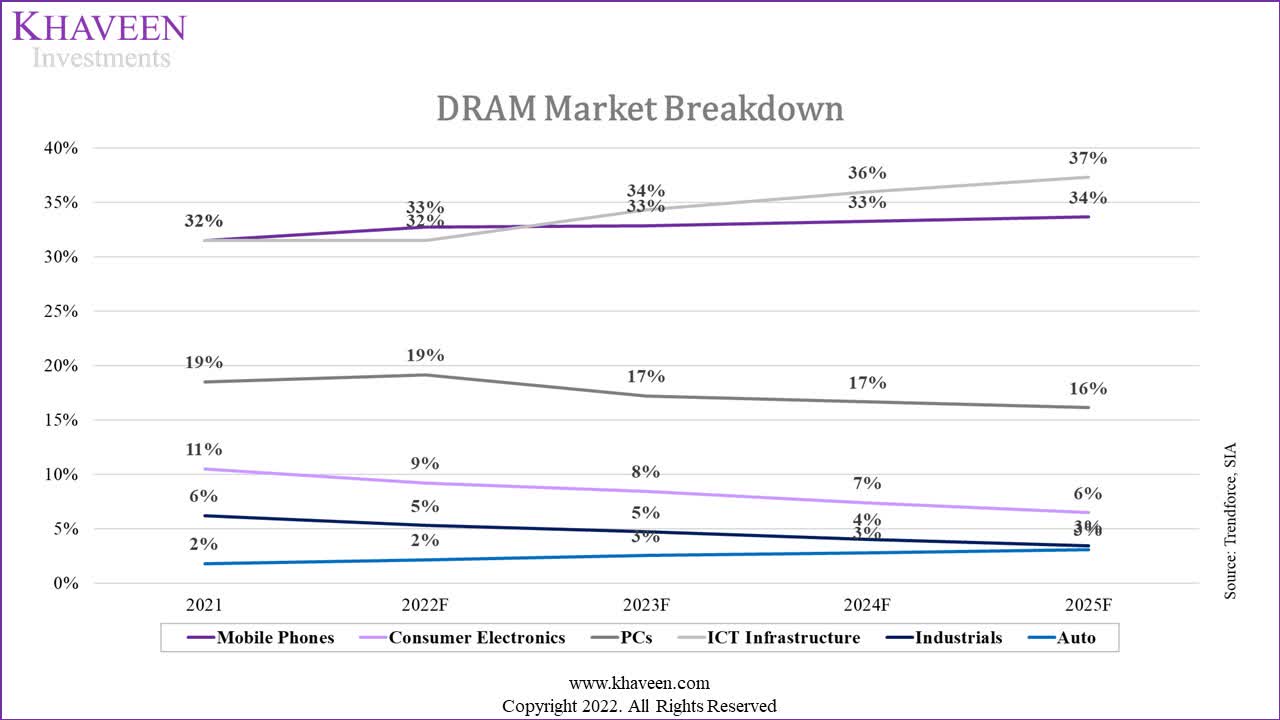
Trendforce, SIA, Khaveen Investments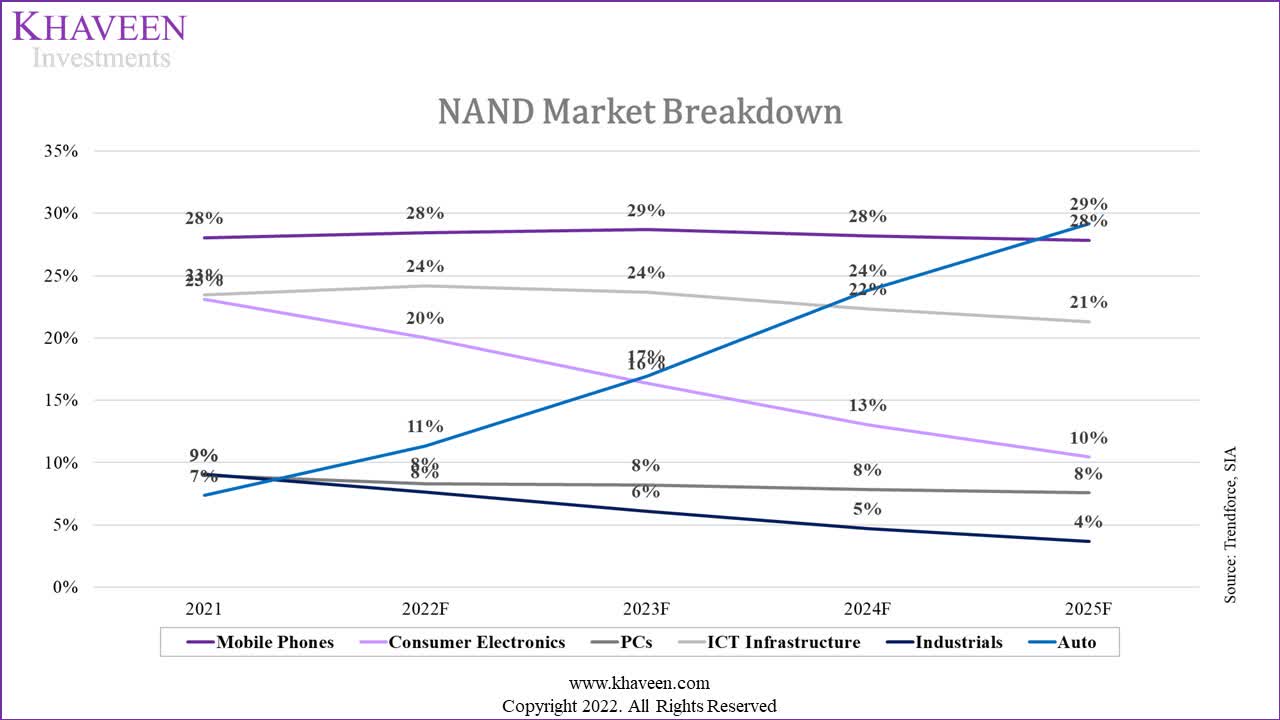
|
DRAM Growth |
2022F |
2023F |
2024F |
2025F |
|
Mobile Phones |
14.4% |
20.9% |
20.9% |
20.9% |
|
Consumer Electronics |
4.5% |
4.5% |
4.5% |
4.5% |
|
PCs |
2.5% |
15.5% |
15.5% |
15.5% |
|
ICT Infrastructure |
24% |
25% |
24% |
25% |
|
Industrials |
1.70% |
1.70% |
1.70% |
1.70% |
|
Automotive |
34% |
32% |
32% |
32% |
|
Total DRAM Shipment Growth % |
13.5% |
18.5% |
18.1% |
18.3% |
|
NAND Growth |
2022F |
2023F |
2024F |
2025F |
|
Mobile Phones |
22.2% |
29.0% |
29.0% |
29.0% |
|
Consumer Electronics |
4.5% |
4.5% |
4.5% |
4.5% |
|
PCs |
12% |
26% |
26% |
26% |
|
ICT Infrastructure |
24.2% |
25.1% |
23.9% |
24.5% |
|
Industrials |
1.70% |
1.70% |
1.70% |
1.70% |
|
Automotive |
85.6% |
91.1% |
84.5% |
59.9% |
|
Total NAND Shipment Growth % |
21.5% |
26.2% |
25.4% |
23.7% |
Source: Khaveen Investments
Overall, we expect DRAM and NAND market shipment growth in 2022 to slow down to 13.5% and 21.5%, respectively, weighed down by the PC and smartphone market growth slowdown. This is compared to our previous analysis of Micron, where we projected the long-term DRAM and NAND market growth at 18.1% and 28% respectively in 2022. Notwithstanding, over the long run, we anticipate the share of smartphone and PC markets of the total market to decline from a combined 50% to 49% (‘DRAM’) and from 37% to 34% (‘NAND’) by 2025, as we believe the growth to be driven by higher growth data center and automotive markets.
Sustainability of Margins Supported by Transition to Higher Nodes
In Q3 FY2022, Micron’s gross margin was 47.4% and decreased by 40 basis points with an increasing mix of NAND according to management. In Q4, management guided gross margins to further decline to a range of 42.5% plus or minus 150 basis points. Micron also guided its revenue to decline by 3% YoY in Q4 2022. Thus, the lower margin guidance is unsurprising with lower economies of scale. That said, its guided margin is still higher than its 1-year, 3-year and 10-year average but lower than its 5-year average gross margin.
|
Micron |
Gross Margins |
|
Current (Q3 2022) |
47.4% |
|
1-year average |
37.8% |
|
3-year average |
38.0% |
|
5-year average |
42.9% |
|
10-year average |
33.3% |
Source: Micron, Khaveen Investments
Though, Micron’s management continues to expect margin improvement driven by “the ramp of its 1-alpha DRAM and 176-layer NAND nodes.”
Based on its annual report, the company incurs costs related to product and process technology including costs to acquire product and process technologies and patents. According to GlobalData, Micron’s total patent publications increased by 114% in the past 10 years from 3,568 in 2012 to 7,623 in 2021.
Micron highlighted that its 1-alpha node ramp is several quarters ahead of the industry while its 1-beta node is on track to ramp in manufacturing by the end of calendar 2022 for DRAM. Whereas for NAND, the company highlighted its industry-leading 176-layer node growing in its mix of sales reaching the majority of bit shipments and contributing to a competitive cost structure. The company also claims to be making progress on its next 232-layer node and expects to ramp production by the end of calendar 2022.
Micron claims that its 1-alpha DRAM node has a 40% improvement in memory density compared to its 1-z node and 15% power savings. Bit density is the number of bits that can be stored within a given memory or storage area according to PCMag.
The most important thing now is that if they’re getting 40% more gigabytes per wafer that basically sets them up to be that much more profitable than the next guy making DRAM. – Jim Handy, principal analyst with Objective Analysis
SK Hynix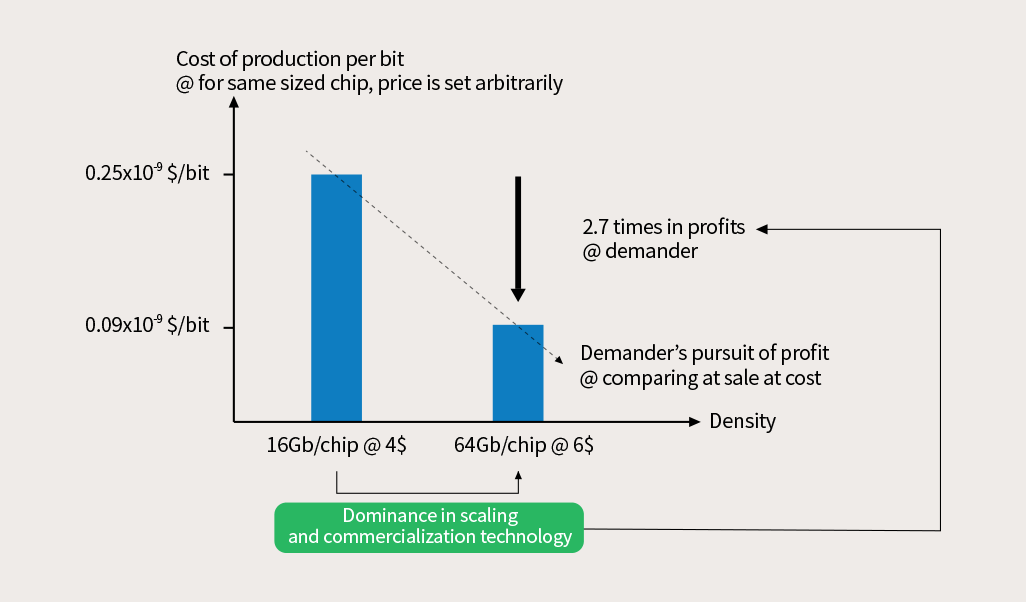
|
Factors |
16Gb/chip |
64Gb/Chip |
% Difference |
|
Bit density |
16Gb |
64Gb |
300% |
|
Cost of production per bit |
$0.25×10^-9 |
$0.09×10^-9 |
-64% |
|
Cost per chip |
$0.25*10^-9/bit |
$0.36*10^-9/bit |
44% |
|
Chip price (ASP) |
4 |
6 |
50% |
Source: SK Hynix, Khaveen Investment
Based on the chart by SK Hynix above, it illustrates the increase in memory bit density by 300% or 4 times for same-sized chips. In terms of cost of production per bit, there is a reduction of 64% from $0.25×10^10-9 to $0.09×10^-9 as it increased to 64Gb/chip which would be positive for the company’s profitability margins if its pricing does not decrease more than the 64% reduction of its cost of production.
However, in terms of the total cost of production, it would increase as the bit density increases from 16Gb to 64Gb. As there are 8 bln bits in a Gb, the total cost increases from $0.25*10^-9/bit to $0.36*10^-9/bit, an increase of 44%. This would not affect the company’s profitability margin as its total cost in dollar value increases. Moreover, given the increased bit density, the example provided an increase in ASP of 50% from $4 (16Gb) to $6 (64Gb).
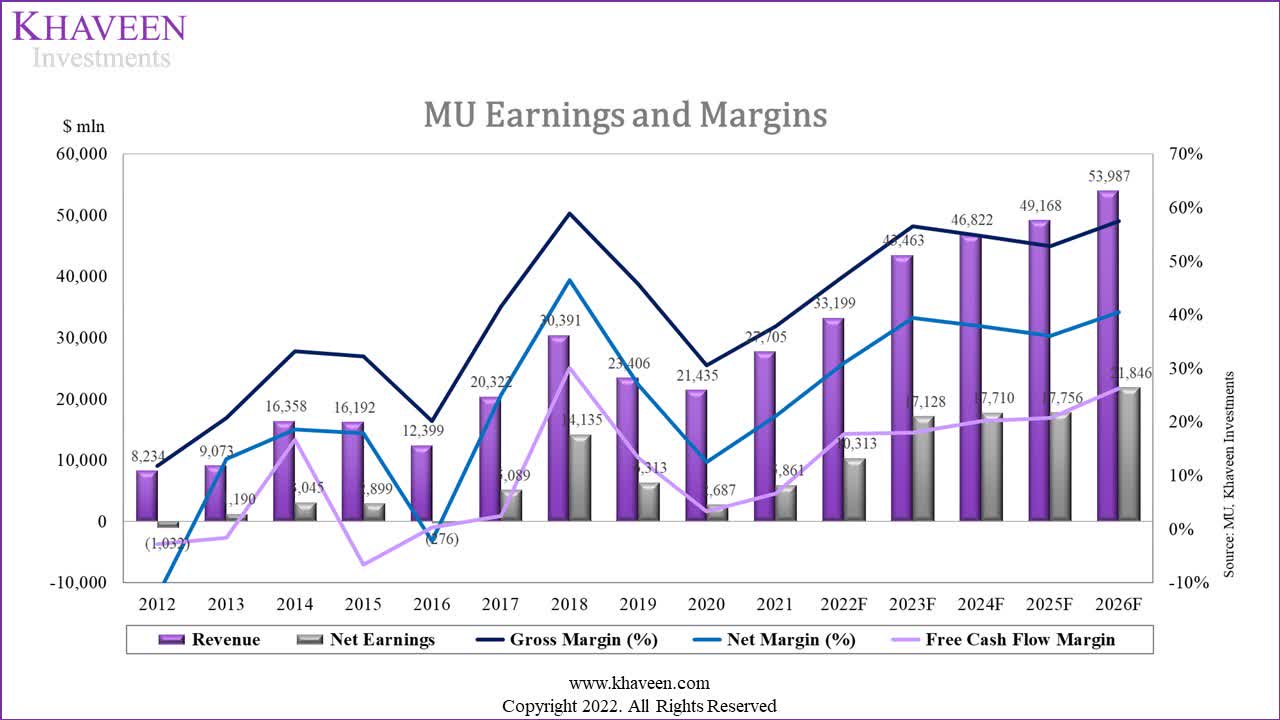
Overall, despite the expected decline of its gross margins as guided by management at 42.5% in Q4 2022, we expect its gross margins to finish the year higher than its 2021 gross margins (47.42%) supported by its transition towards its next-gen DRAM and NAND process nodes which could deliver positive bit density growth and provide a cost of production per bit reduction. Beyond 2022, we expect its gross margins to recover with the acceleration of its growth.
Higher FCF by 79% on Lower Capex Spending
In terms of capex, the company highlighted from its earnings briefing that the company plans to reduce its supply growth trajectory and is planning for reduced bit supply growth in FY2023, using inventory to supply market demand next year. Micron’s management expects inventory to increase in Q4 2022 although its inventory days declined from Q2 2022:
Our strategy is to manage supply through inventory as a buffer and we did talk about reducing bit supply growth assumptions a bit. We are starting this sort of softer period in a pretty good place. We ended the third quarter $5.6 billion of inventories, 109 days, down from 113 days in 2Q. So, we do expect inventories to go up this quarter. – Mark Murphy, Micron CFO
Moreover, the company expects to reduce wafer fab equipment capex for FY2023 compared to its prior plans and expects wafer fab equipment capex to decline YoY. The company highlighted that wafer front-end equipment (WFE) capex represented around half of its total capex spend, with the remainder from other areas such as development and construction for R&D and assembly and test which management stated that it is evaluating depending on the market dynamics.
WFE spend will be down in fiscal ‘23. We’re also evaluating construction and other large areas of spend. – Mark Murphy, Micron CFO
Similarly, Bloomberg reported that SK Hynix was also weighing reducing its capex by a quarter in FY2023 due to the market slowdown in electronics demand. Whereas, Samsung (OTCPK:SSNLF, OTCPK:SSNNF) previously stated that it was adopting a flexible investment approach depending on market conditions.
|
Micron FCF ($ mln) |
2021 |
2022F |
2023F |
2024F |
2025F |
2026F |
|
Operating Cash Flow (Current) |
12,468 |
15,700 |
23,547 |
25,918 |
27,598 |
33,167 |
|
Capital Expenditure (Current) |
-10,589 |
-12,000 |
-8,273 |
-16,677 |
-17,513 |
-19,229 |
|
Free Cash Flow Margin (%) (Current) |
6.67% |
12.32% |
36.01% |
20.56% |
21.29% |
26.52% |
|
FCF (Current) |
1,848 |
4,094 |
15,668 |
9,635 |
10,479 |
14,333 |
|
Operating Cash Flow (Previous) |
12,468 |
16,809 |
24,823 |
27,279 |
29,056 |
35,176 |
|
Capital Expenditure (Previous) |
-10,589 |
-11,532 |
-16,547 |
-17,613 |
-18,677 |
-20,508 |
|
Free Cash Flow Margin (%) (Previous) |
6.67% |
15.45% |
18.67% |
20.35% |
20.55% |
26.17% |
|
FCF (Previous) |
1,848 |
5,670 |
8,671 |
10,060 |
10,773 |
15,063 |
Source: Micron, Khaveen Investments
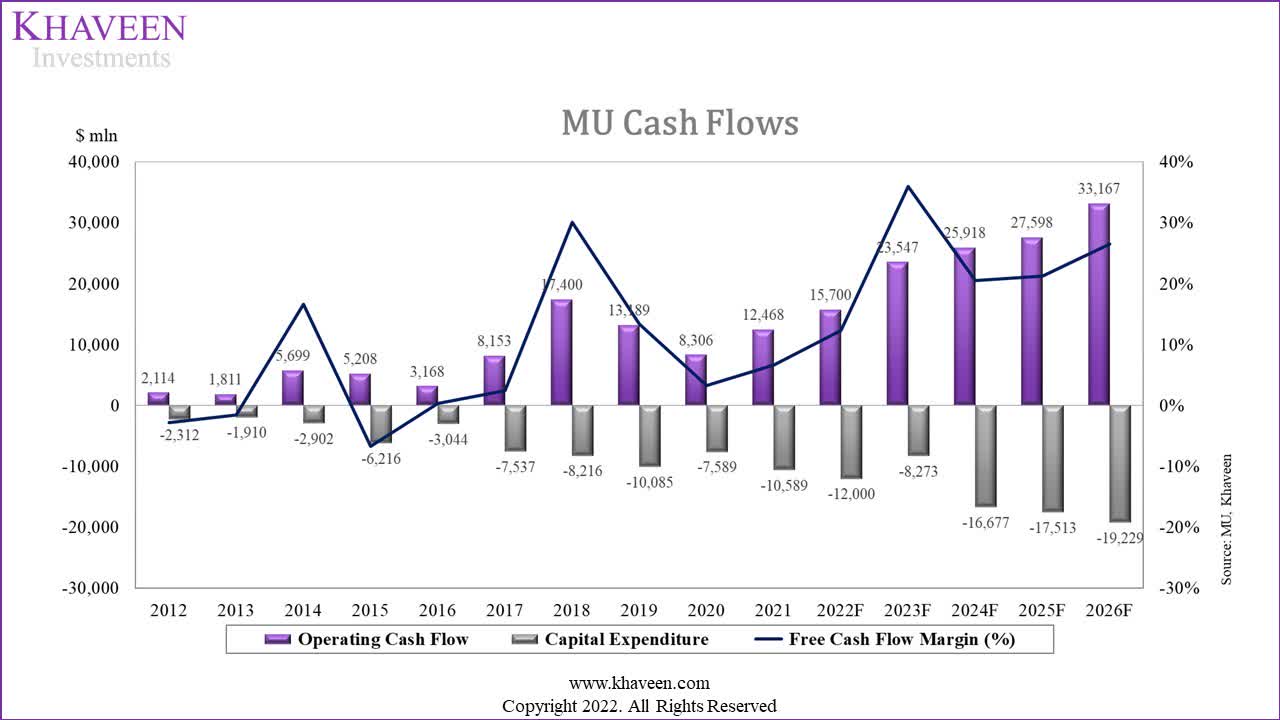
Based on the chart above, we calculated its average capex growth decline to be 31% during periods of revenue growth slowdown (excluding 2015) in the past 10 years. In comparison, SK Hynix was also reported to be weighing reducing its capex by 25% in 2023.
Based on this average (-31%), we then factored it into our capex projections for Micron in 2023 by reducing our 2022 capex assumption of $12bln from management guidance in its latest earnings briefing by 31% ($8.2 bln) as the company guided it expects to reduce spending on equipment purchases. In our previous analysis, we forecasted its capex in 2023 based on its 5-year average adjusted capex as a % of revenue of 35.6% which translated to a capex of $16.5bln. Thus, this adjustment leads to a significantly lower capex by 50%, resulting in a higher FCF projection in 2023 of $15.6 bln compared to $8.7 bln, which is a difference of 79.3%. Beyond 2023, we continue to base our capex projection on its 5-year average of 35.6% but is lower compared to our previous forecast due to a lower revenue projection for the company.
Risk: Slowdown in ASP Growth in 2022
In terms of pricing, NAND pricing had declined by 6.5% YTD in 2022 compared to our previous forecast of -1.7% (FY2022) while DRAM pricing had declined by 3.6% YTD which is below our projection of 12% (FY2022) growth previously. We believe the slowdown in demand outlook could pose a threat to the market pricing which could affect Micron’s ASPs and revenue growth in 2022. Thus, we revised our projections for DRAM ASPs at a conservative assumption of 0% in 2022 but retain our long-term projections for DRAM ASPs in 2023 and beyond to recover strongly which we believe is appropriate given the supply growth control that Micron and SK Hynix are believed to be planning. Whereas for NAND, we continue to retain our projections in 2022 and beyond as we had already forecasted its pricing growth to decline based on its long-term trend.
|
DRAM |
2019 |
2020 |
2021F |
2022F |
2023F |
2024F |
2025F |
|
DRAM ASP Change % |
-47.4% |
2.6% |
31.7% |
0.0% |
18.7% |
4.9% |
4.7% |
|
DRAM Shipment Growth % |
19.2% |
4.5% |
8.6% |
13.5% |
18.5% |
18.1% |
18.3% |
|
DRAM Market Revenue Growth % |
-37% |
7% |
43.0% |
13.5% |
40.7% |
23.9% |
23.9% |
|
NAND |
2019 |
2020 |
2021F |
2022F |
2023F |
2024F |
2025F |
|
NAND ASP Change % |
-46% |
-14% |
7% |
-1.7% |
-1.7% |
-1.7% |
-1.7% |
|
NAND Shipment Growth % |
33.3% |
44.3% |
5.0% |
21.3% |
26.2% |
25.4% |
23.7% |
|
NAND Market Revenue Growth % |
-27.6% |
23.8% |
12.3% |
19.2% |
24.0% |
23.3% |
21.6% |
Source: Khaveen Investments
Valuation
We updated our revenue projections for Micron with its Q1-Q3 FY2022 results and updated our projections for its Q4 2022 and beyond based on our forecast of the DRAM and NAND market growth. Thus, in 2022, we expect its revenue growth to slow down to 19.8% compared to 32.5% previously with lower DRAM and NAND growth from 35.9% and 23.3% respectively. However, we expect its growth to accelerate in 2023 with the recovery in DRAM and NAND revenue growth.
|
Micron Revenue Projection ($ bln) (Fiscal Year) |
2021 |
2022F |
2023F |
2024F |
2025F |
|
DRAM |
20.04 |
24.35 |
32.79 |
41.67 |
51.62 |
|
Growth % |
38.1% |
21.5% |
34.6% |
27.1% |
23.9% |
|
NAND |
7.01 |
8.41 |
10.34 |
12.76 |
15.57 |
|
Growth % |
14.3% |
20.0% |
23.0% |
23.4% |
22.0% |
|
Others |
0.66 |
0.44 |
0.33 |
0.33 |
0.33 |
|
Growth % |
-17.0% |
-33.5% |
-24.2% |
0.0% |
|
|
Total Revenue |
27.71 |
33.20 |
43.46 |
54.77 |
67.52 |
|
Total Growth % |
29.25% |
19.83% |
30.92% |
26.01% |
23.29% |
|
Total Adjusted Revenue |
27.71 |
33.20 |
43.46 |
54.77 |
67.52 |
|
Total Adjusted Growth % |
29.25% |
19.83% |
30.92% |
7.73% |
5.01% |
|
Revenue (Previous Analysis) |
27.71 |
36.71 |
46.45 |
57.93 |
72.01 |
|
Growth % |
29.25% |
32.51% |
26.51% |
6.44% |
6.04% |
Source: Khaveen Investments
Based on a discount rate of 9.5% (the company’s WACC), our model shows its shares are undervalued by 202.61%. However, we also applied a discount rate of 30% to Micron’s DCF valuation due to the Molodovsky Effect which we previously analyzed, which results in a target price of $128.05, an upside of 112%.
Khaveen Investments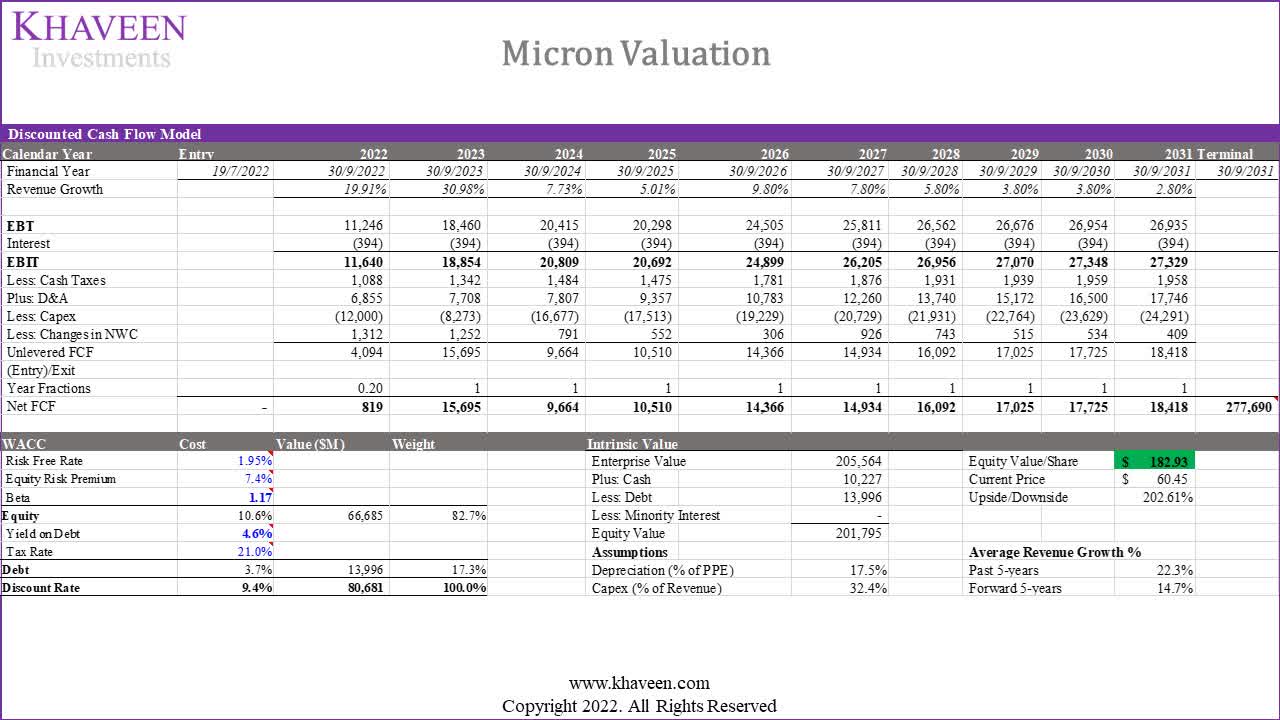
Verdict
To conclude, we expect the company to face growth headwinds for its remaining quarter in Q4 2022, as the PC and smartphone market sales growth slows, and revised our projections for DRAM and NAND to grow by 13% and 21%, respectively. Moreover, we expect its gross margins to be higher than 2021 despite the slowdown as it transitions towards higher process nodes for DRAM and NAND, which could provide cost savings in terms of lower cost of production per bit. Furthermore, we believe its FCF could be supported by its reduced capex planned in 2023, as it plans to cut spending on WFE purchases, but we believe it could lead to a supply-demand imbalance which could provide upside to ASP growth.
Overall, we continue to rate the company as a Strong Buy with a higher price target of $128.05 despite the lower revenue growth at a 5-year average of 14.7% compared to 16.3%. We expect its reduced capex in 2023 to result in higher FCF of $15.6 bln compared to $8.7bln.
Be the first to comment