

ijeab
Written by Nick Ackerman, co-produced by Stanford Chemist. This article was originally published to members of the CEF/ETF Income Laboratory on July 23rd, 2022.
MFS Special Value (NYSE:MFV) is quite a unique and interesting fund. However, the first thing that needs to be mentioned is the size. At less than $34 million, this investment isn’t going to be for everyone. The actual underlying portfolio is somewhat attractive if one can get beyond that. They take a fairly even split between equity and high-yield investments. MFV’s valuation is also much better than just a short while ago.
MFS isn’t a fund sponsor that I run across often. Pretty ironic as MFS Multimarket Income Trust (MMT) was one of my first CEFs to buy long ago. A wild time where my “due diligence” could be summed up as, “wow, this pays monthly with a fairly high yield. I’m buying.” However, I no longer hold this position.
I don’t see anything particularly wrong with their funds. They are more geared towards fixed-income funds. However, a reader had asked my thoughts on this one in particular. After such a plunge in the fund’s premium, it caught my attention.
The Basics
- 1-Year Z-score: -2.91
- Discount: -0.46%
- Distribution Yield: 10.01%
- Expense Ratio: 1.41%
- Leverage: N/A
- Managed Assets: $33.75 million
- Structure: Perpetual
MFV’s investment objective is “high current income, but may also consider capital appreciation.” In terms of how they intend to achieve this, I could not find an exact investment policy in the usual places. A press release in 2015 showed an investment policy change of investing “primarily in debt instruments” to “normally invests a majority of the fund’s assets in debt instruments.
That appears to be when the portfolio changed to allow more equity exposure. Looking at prior reports through the years, it seemed to contain around 35% in equity before this investment policy change anyway. Looking at the portfolio today, we can see a fairly even split between the asset classes with a slight tilt towards fixed-income.
The fund’s expense ratio is relatively higher for a non-leveraged fund. That isn’t too surprising given the size of the fund overall. With no leverage on the fund, that takes away some risks in this current environment. We don’t have to worry about higher expenses due to increased leveraged costs or the higher volatility associated with debt in the portfolio.
The fund goes back to 1989, according to CEFConnect. The managers at this time haven’t been around that long, but the fund has certainly experienced some financial stress during that long period.
Performance – A Sharp Decline In Premium
They share the annualized returns of the fund as of the end of June 2022. We can see that the results have been fairly mediocre. However, we will see that their portfolio favors value-oriented sectors rather than growth ones. Also, combining the fixed-income sleeve of the portfolio will obviously result in returns not being as high as equity returns.
MFV Annualized Returns (MFS)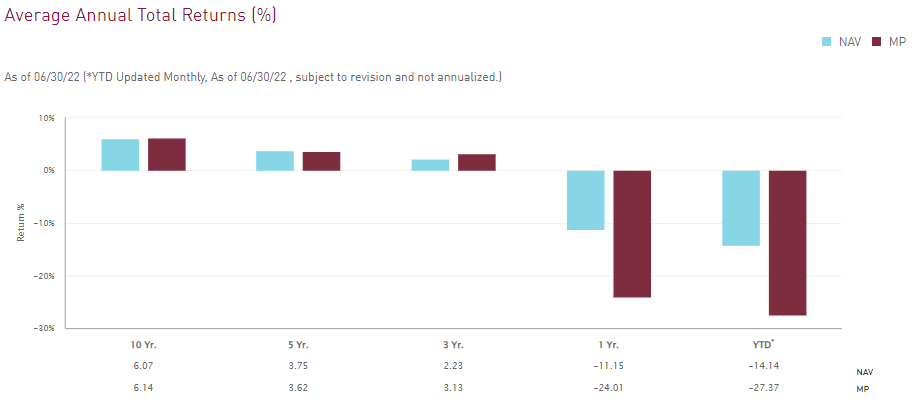
To provide some context, we can compare MFV to iShares iBoxx $ High Yield Corporate Bond (HYG) and iShares Russell 1000 Value (IWD). I’ve also included the SPDR S&P 500 (SPY) for more context. These aren’t benchmarks for the fund, but they would be in some blended capacity.
The results show they have significantly outperformed a basket of high-yield investments but underperformed a basket of pure equity. That isn’t too surprising since we know how well equity has been performing. This is right where I would expect a CEF of this type to perform.
Ycharts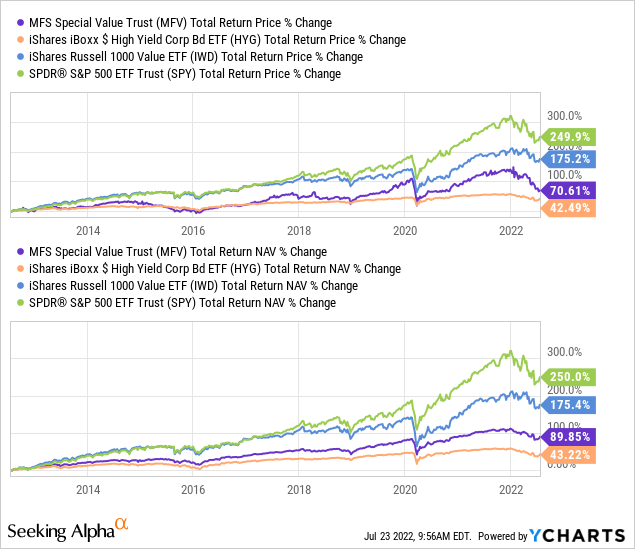
Looking at just YTD now, we can see that MFV has outperformed these ETFs on a total NAV return basis. To me, that’s surprising in a good way. I wouldn’t have originally thought MFV would be outperforming HYG. They are, after all, invested almost entirely in junk-rated bonds on the fixed-income sleeve of their portfolio. We can also see that the fund has fallen quite materially relative to the NAV on a total share price return basis.
Ycharts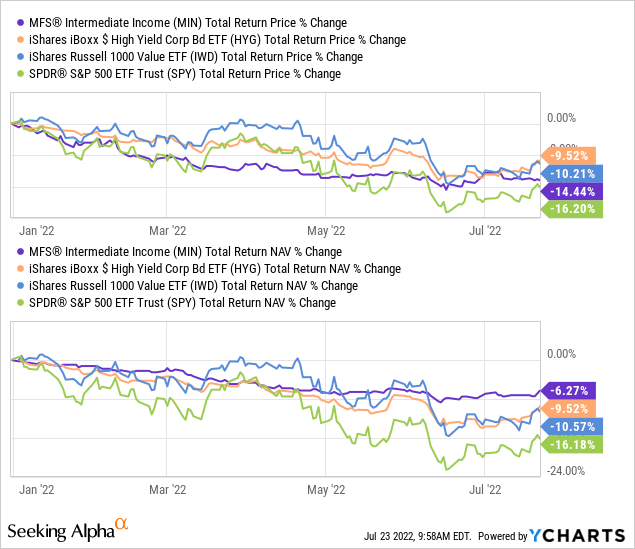
They have some future contracts that they are hedging against higher interest rates. Although, the exposure here is very minimal, even relative to the fund’s small size.
One thing that caught my attention for the fund is the deeply negative z-score, which resulted in the premium collapse that the fund has experienced. This was a large collapse from an over 20% premium. That level seemed unwarranted but has come back down meaningfully, making it a more tempting candidate. Interestingly, this fund mostly carries a premium based on its history.
Ycharts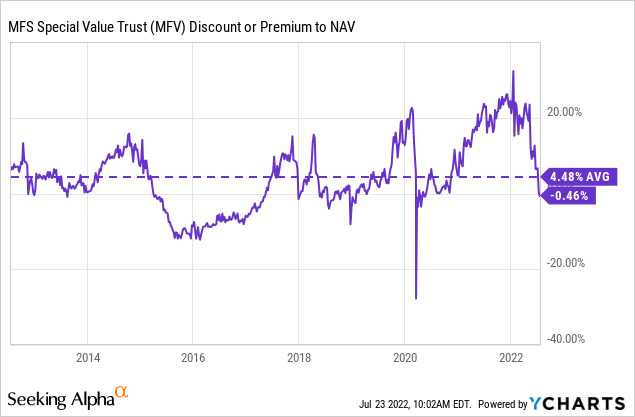
Distribution – Managed 10% Plan
The fund runs with a managed distribution where they target 10% annually. This is paid and adjusted monthly.
MFS Distribution History (MFS)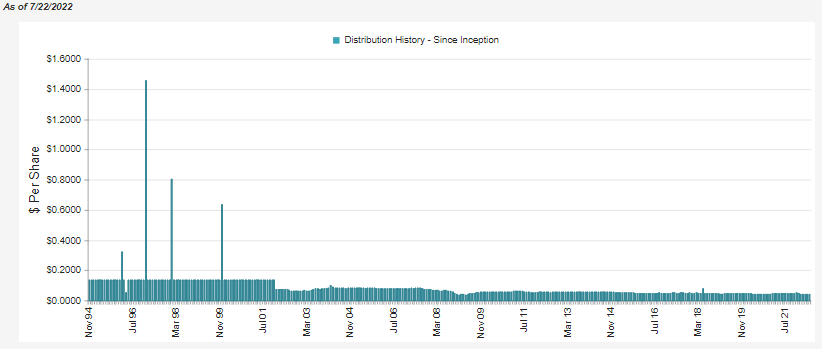
The actual distributions are hard to see on this long-term chart due to the lengthy history. However, when looking at the last year, we can see the general trend of the payout.
MFV Distribution History (CEFConnect)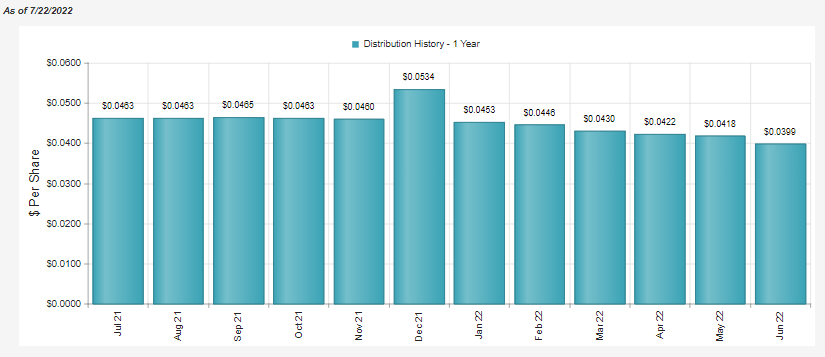
The actual earnings of the fund don’t necessarily matter in this case since they will pay 10% no matter what. The distribution will constantly be adjusted.
If they are underearning their distribution, then the NAV will be reduced, and the distributions going forward will be reduced. If they achieve the 10% by earning it through capital gains and/or the income generated in the portfolio – then the NAV will rise, and so too will the payout.
The NII generated on the fund had coverage of 33.3%. The remainder would have come from capital gains or return of capital. In this reporting period, realized capital gains were nearly sufficient to cover the shortfall, only leaving a few thousand dollars in difference.
MFV Semi-Annual Report (MFS)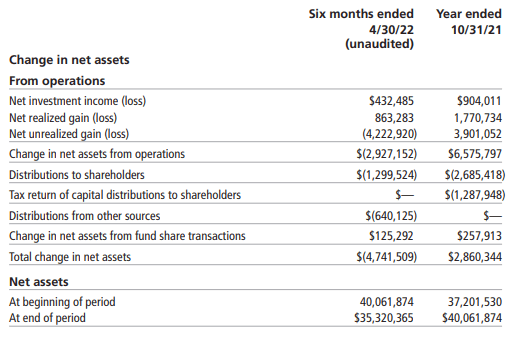
The NAV has been trending lower this year, though. The result of both equities and fixed-income getting pressured as rates rise. The Fed has had to be aggressive to combat elevated inflation. With the current environment, I wouldn’t suspect to see this trend change anytime drastically. Not until the Fed pivots and either pause or reverses and starts cutting.
For tax purposes, the fund has attributed the tax classifications as ordinary income, long-term capital gains and return of capital for both of the previous years.
MFV Annual Report (MFS)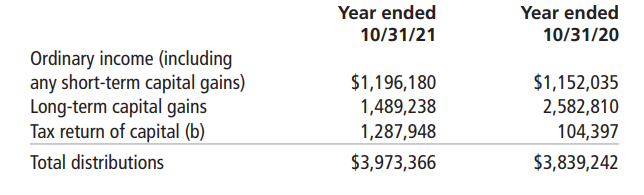
This is an example of where it can be hard to plan taxes around a CEF. MFV has meaningful changing of classifications from year to year.
MFV’s Portfolio
The portfolio breakdown at the end of June had the largest allocation to high-yield corporate bonds. Closely behind this was the U.S. equity sleeve of the portfolio.
MFV Portfolio Exposure (MFS)
We also can see that the fund isn’t limited to just U.S.-based investments. However, they favor them heavily, at least at this time.
In total, there are 344 positions. That isn’t unusual for a high-yield bond fund, but it is higher than we often see for an equity fund. High yield bond funds take a “buckshot” approach to invest in hundreds of positions. That way, when the economy gets challenging as it appears we will be heading into now, no single default or bankruptcy can disrupt the fund too much.
The portfolio’s duration is 4.15 years, with an average maturity of 6.01 years. This also isn’t too uncharacteristic of what we see in terms of duration for high-yield portfolios. This is also only going to be referring to the high-yield sleeve of the fund, as equities don’t have a duration – at least not in the technical sense.
The credit quality here is well within the junk classification. Only a small sliver of 2.25% of the portfolio is invested in BBB – the first rung considered investment-grade.
MFV Credit Quality (MFS)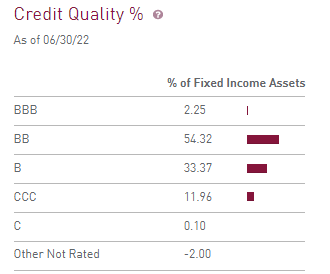
Despite the larger exposure to high-yield bonds, the fund’s top holdings and top ten equity holdings are exactly the same.
MFV Top Holdings (MFS)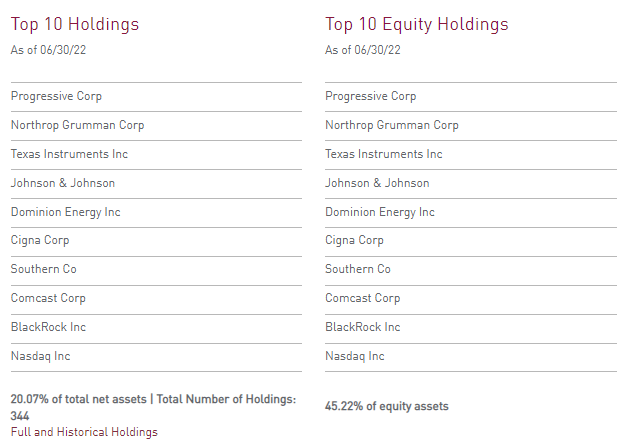
The equity top holdings make up 45.22% of the equity assets here. This helps confirm that the underlying portfolio with its 344 positions is primarily attributed to high yield names taking up many of these positions. None of the high-yield bond positions make up a sizeable portion of the portfolio.
Their last report shows only around 28 equity positions in the portfolio. That’s consistent with the high yield “buckshot” approach I mentioned above, where equity funds generally have a more narrowly focused portfolio.
MFV Top FI Holdings (MFS)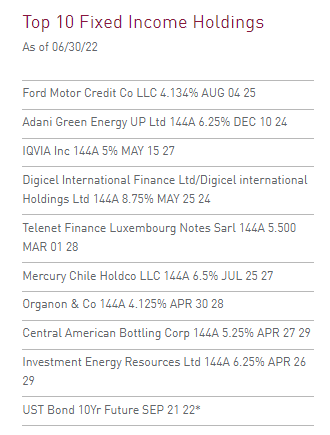
I think it is notable that when looking at the top ten fixed-income holdings for the fund, most of these are 144A positions. That means these are being sold to qualified institutional buyers or QIBs, rather than retail. This highlights how retail investors can capitalize on the more private investment world.
One last note I wanted to mention on the portfolio was the general tilt towards value-oriented sectors. Over the last decade, that hasn’t been the place to invest.
One position that jumped out to me was Texas Instruments (TXN) because I own it but also because I noticed this was even a position going back to 2015. Nasdaq (NDAQ) is another position that appears to go back to that time. I had looked back in previous reports to see how the portfolio was positioned before the investment policy change noted above. Below is the exposure of the fund at the end of fiscal 2015.
MFV Top Ten 2015 (MFS)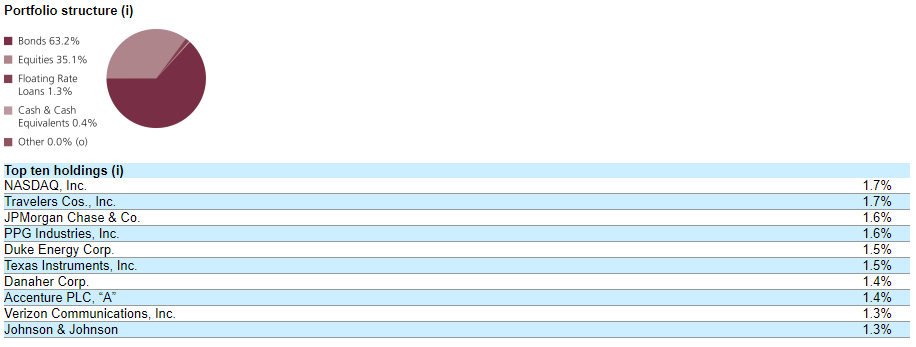
The value-oriented portfolio is important to note since growth has been significantly outperforming during the last decade. That’s why I believe that the portfolio’s performance was rather subpar when looking at annualized historical returns. The value-oriented sectors have been performing relatively better on a YTD basis, which also highlights why the fund is performing relatively better this year.
The fund’s exposure at the end of April 2022 had financials, industrials, utilities, and healthcare all as the higher allocations above tech.
MFV Sector Allocation (MFS)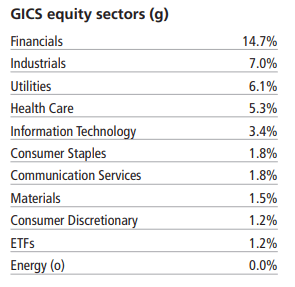
Conclusion
MFV is a rather unique fund that invests in a portfolio of equity and high yield. The equity sleeve of the portfolio is geared towards more value-oriented sectors. Historically, it appears this has been the case for most of the last decade. A time period where growth had done really well compared to value. That could help explain the overall underwhelming performance of this fund – even if we factor in the fixed-income exposure of the fund.
I can’t explain it, but for whatever reason, this is one of those funds that trade at a premium for extended periods of time. This is reflected in the average premium of the fund coming to 4.48% over the last decade. With that being the case, the sudden collapse from a 20% premium to a slight discount could present an opportunity for investors. That is if you can get over the hurdle that this fund has less than $34 million in AUM.
Be the first to comment