

cemagraphics
Written by Nick Ackerman, co-produced by Stanford Chemist. This article was originally published to members of the CEF/ETF Income Laboratory on November 7th, 2022.
Macquarie/First Trust Global Infrastructure/Utilities Dividend & Income Fund (MFD) is an infrastructure fund I’ve touched on only briefly in the past. This was when looking at the entire closed-end fund infrastructure sector broadly. It is quite similar to its cousin fund, Macquarie Global Infrastructure Total Return Fund (MGU). Both of these funds put an emphasis on investing a large portion of their portfolios outside the U.S.
These funds have also held heavier tilts towards energy infrastructure that had historically meant weaker returns. This was even more apparent with MFD, which had historically been the weakest performer even when put up against MGU. MFD also has a fair bit of exposure to senior floating loans. Those should also be helping the performance this year with increased interest rates.
Now, with energy being the top-performing sector, this performance has reversed. Although interestingly, they haven’t held enough in energy to produce positive results YTD. Instead, utilities have now been the drag on the performance more recently.
Recently, I looked more at MGU when discussing the abrdn Global Infrastructure Income Fund (ASGI). MGU is set to be absorbed into ASGI at the start of 2023. Today, I wanted to give a better look at MFD. A fund I’ve never covered specifically previously. For some investors, the more unique weighting into its exposure while trading at a discount could be compelling.
The Basics
- 1-Year Z-score: -1.09
- Discount: -9.80%
- Distribution Yield: 9.88%
- Expense Ratio: 1.71%
- Leverage: 26.42%
- Managed Assets: $104.283 million
- Structure: Perpetual
MFD’s investment objective is “to provide a high level of current return consisting of dividends, interest, and other similar income while attempting to preserve capital.” To achieve this, the fund will “invest predominantly in the securities of companies that are involved in the management, ownership, and/or operation of infrastructure and utilities assets, and are expected to offer reasonably predictable income and attractive yields. The Fund also invests in senior secured loans generally considered to be high-yield securities.”
MFD is quite a small fund, which can make it difficult for larger investors to invest in with lower volume. The fund’s expense ratio is also quite high, which isn’t that uncommon for global funds. The total expense ratio comes to 2.21% when including the leverage expenses. The fund’s leverage isn’t too elevated.
However, it still suffers from the negative impact of paying a variable rate on its credit facility. In this case, MFD’s borrowings are based on 1-month LIBOR plus 0.85%. Meaning that as interest rates rise, the fund’s leverage expenses will also rise.
On the other hand, MFD’s senior loan exposure can be seen as a bit of a hedge as the income generated from that sleeve of the portfolio should also rise.
The fund also dropped some of its leverage from earlier this year. They were running with $33.250 million in borrowings. This has now been dropped to $27.55 million.
MFD Leverage Stats (First Trust)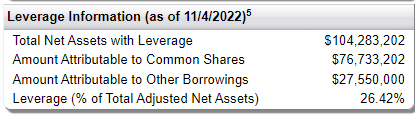
Performance – Better Recent Results
As mentioned at the beginning of the article, MFD had historically been one of the weakest-performing funds. Between 2015 and 2020, the heavier focus on energy definitely hurt the fund. However, the fund’s senior loan exposure was also hurting the fund by not participating in much upside. With rates low, the yields on the senior loans were also relatively low.
To gauge the performance, I’ve included several similar funds. That includes its cousin, MGU, then also Cohen & Steers Infrastructure Fund (UTF) – the best performing of the infrastructure funds. I’ve also included Reaves Utility Income (UTG) which had historically been heavier in utility exposure rather than energy. Additionally, UTG had tended to focus overwhelmingly on U.S. exposure. However, more recently, they’ve included more global positioning. Then I’ve also included BlackRock Utility, Infrastructure & Power Opportunities (BUI). This is an unleveraged fund, but it also places a focus on investing globally.
YCharts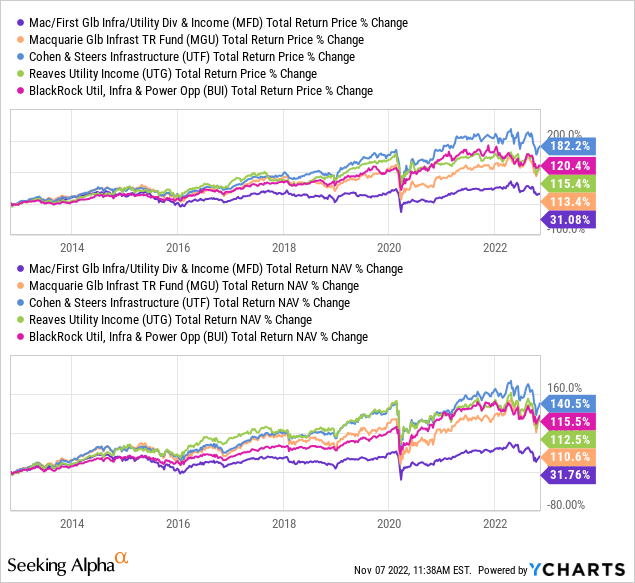
This underperformance has reversed when looking at the YTD results. While not achieving positive total returns even on a NAV basis, the fund is performing much better when compared to what could be seen as somewhat similar funds. Of course, each fund is fairly unique from one another.
YCharts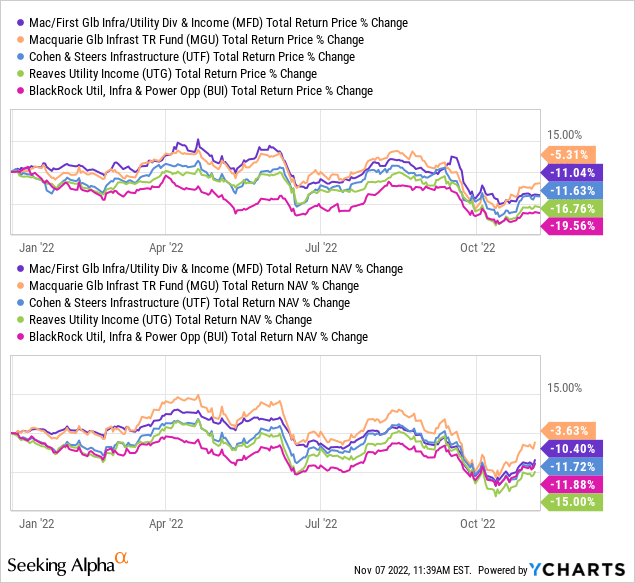
These more short-term results are encouraging. If rates continue to remain elevated and energy stays strong, this outperformance could continue. Results have been offset, though, due to the decline in utility stocks. That has been a major drag more recently across all of these infrastructure funds with meaningful utility exposure.
MFD, more recently, has fallen to what would be a fairly attractive discount. At least, fairly attractive if we are comparing it to its longer-term average of the last decade. We can also see several occasions where the fund’s discount has slipped even wider. The better results YTD might be supporting its discount from falling too dramatically.
YCharts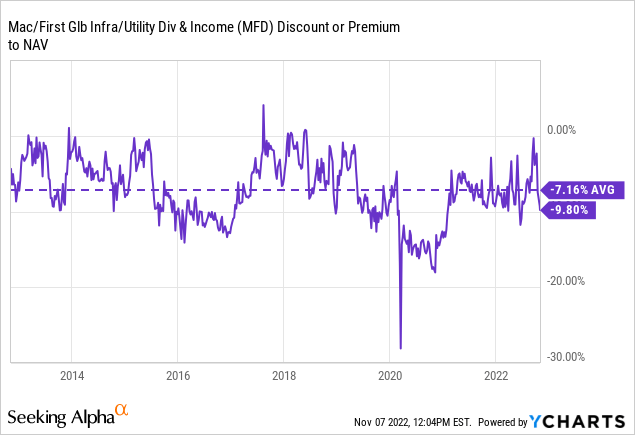
Distribution – Significant Drop In Income
MFD pays quarterly, and the general trajectory of the payout has just been lower and lower over the last several years.
MFD Distribution History (CEFConnect)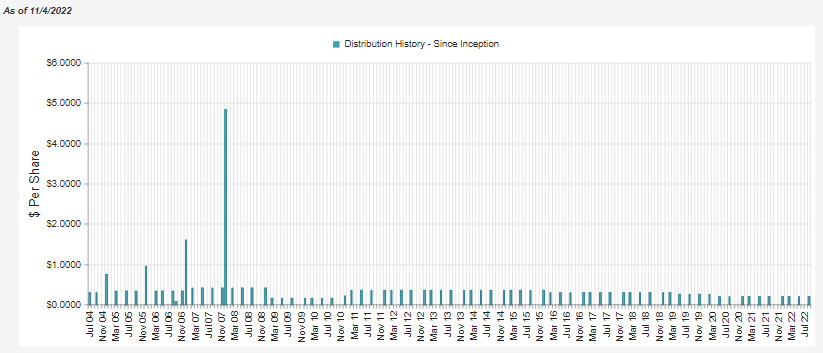
So while the 9.88% distribution yield might appear attractive, investors could rightfully be asking how sustainable it really is.
I’m not blown away by its coverage, and I’m a bit perplexed by a significant drop in income.
With their latest semi-annual report, their net investment income had dropped materially if we annualize the figure. It was for the six months that ended May 31st, 2022. NII coverage was 47.15% compared to 88.07% in the previous fiscal year. The ratio of NII to average NAV dropped from 6.84% to 3.45%.
To be fair, the fund also holds exposure to MLPs. They often payout significant portions of distributions classified as return of capital. ROC does not get included with NII. In this last report, ROC from MLPs was $337,580. In the prior fiscal year, this came out to $812,039.
MFD Semi-Annual Report (First Trust)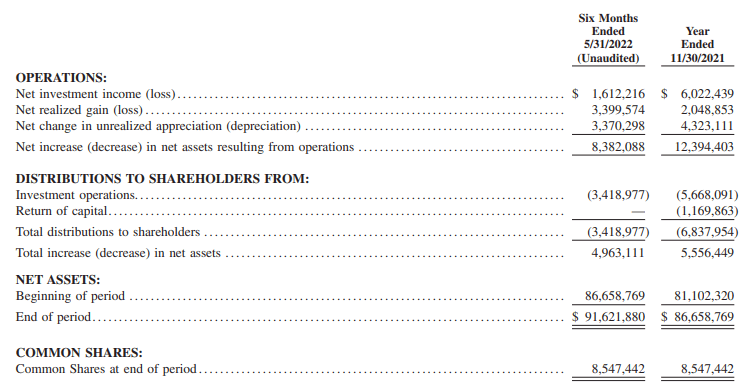
So for this reporting period, the senior loan exposure probably wasn’t generating significantly different from the previous period. That should be reflected better in the next report. The higher interest expenses at that point would have also been minimal.
They also didn’t experience any deleveraging as they did in 2020 in this report. Yes, they deleveraged since this semi-annual report but not in the six-month period reflected. That means that coverage going forward could shrink further. In general, that’s always another place to check when seeing large changes in the NII of the fund.
There also weren’t any major waves of dividend or distribution cuts that I can recall in the utility or energy space. In fact, payouts from the energy space have really only gone higher.
The portfolio turnover historically was quite elevated. In 2020, as an example, turnover was 209%, and in 2018 it was 2016%. In this six-month report, we see a turnover of 32%, and last fiscal year, they reported a turnover of 92%. This leads me to conclude only that they’ve swapped out their portfolio into lower payers from higher payers. I really can’t explain why we see such a difference.
Here is a look at the per-share figure from each of the prior fiscal years. We can see a general trend lower overall. It is that this latest six-month figure has been even more of a material decline than the previous. In a bear market, capital gains to fund distributions for equity funds or those that are heavily tilted towards equity can become more and more difficult.
MFD NII Per Share (First Trust)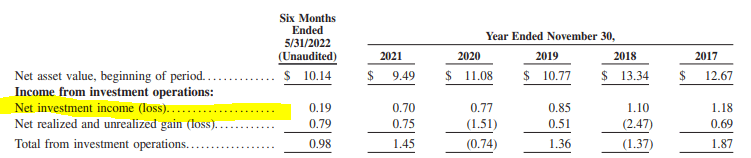
The depreciation in the fund has been minimal YTD, as highlighted earlier. Given that the fund’s NAV yield is 8.91% – which isn’t overly elevated either – and it would seem that a cut probably isn’t imminent. At the same time, seeing such a large shift in NII is also unusual, so I couldn’t rule out a cut.
For tax purposes, 2021’s classifications were largely qualified dividend income. They also had a bit of return of capital or “nontaxable distributions.” That could make it okay for a taxable account.
MFD Tax Character (First Trust)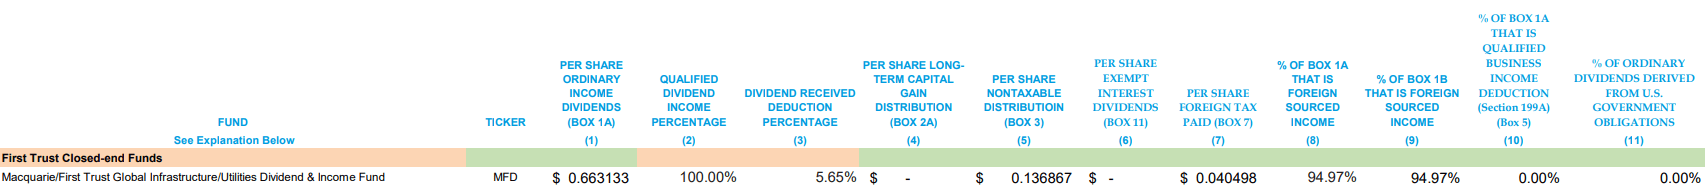
MFD’s Portfolio
The fund’s senior loan exposure mixed with equity positions and MLPs is really a fairly unique approach. I believe it sets the fund apart from others. Though there are funds such as Allspring Utilities and High Income Fund (ERH), which I recently wrote about. They take a utility and high-yield bond exposure approach, which is a fairly unusual approach in itself.
MFD Asset Exposure (First Trust)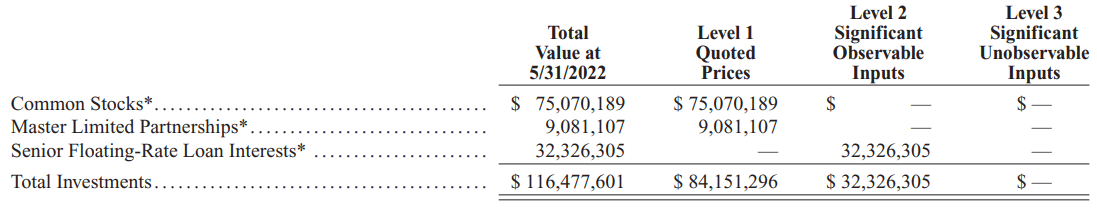
The fund’s exposure outside of the U.S. is fairly heavy as well. Which would make sense considering the “global” portion of its name. The exposure to the United Kingdom is quite large. Then we also have a significant amount of Canadian exposure, which generally has some very worthwhile infrastructure plays.
MFD Geographic Exposure (First Trust)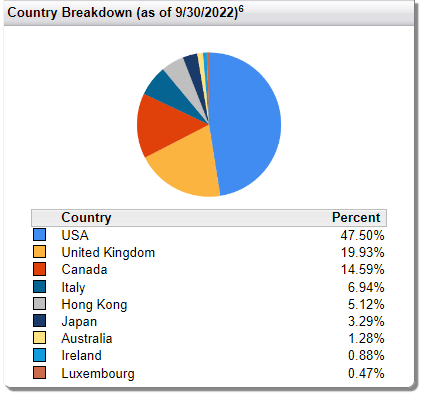
The largest allocation of the portfolio is dedicated to oil and gas investments.
MFD Industry Exposure (First Trust)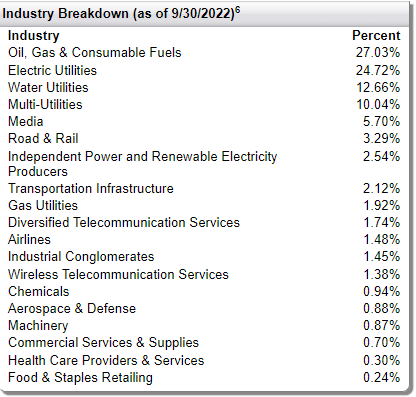
This is then followed by a combined 47.42% allocated between electric utilities, water utilities, and multi-utilities. They have some smaller exposure to gas utilities at 1.92%. This would generally be seen as the portion of the portfolio that can be relatively more stable. Although valuations in the space became quite elevated, some of that is coming out more lately. Oil and gas will be the sector more susceptible to volatility overall.
When looking at the top positions of the fund, one thing becomes quite clear. Generally speaking, the fund is quite concentrated. According to CEFConnect, at the end of May, they held 60 positions. That includes their senior loan exposure.
For these equity positions that make up the largest portion of their portfolio, it is only 20 positions. It is easy to count manually because it is only a page – less than a page, actually. These top ten names below make up nearly 48% of the portfolio.
MFD Top Ten (First Trust)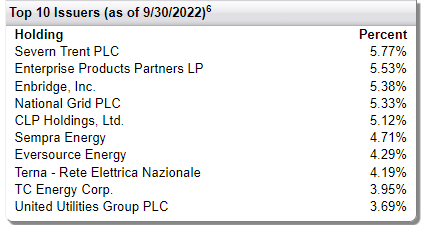
Severn Trent (OTCPK:SVTRF) is an example of a water utility from the U.K. It trades on pink sheets in the U.S. We also have other U.K. utility names show up in a top spot, such as National Grid (NGG) and United Utilities Group (OTCPK:UUGRY). NGG trades on the NYSE, but UUGRY is another pink sheet trading position.
Enbridge (ENB) is popular enough as a Canadian infrastructure company. They are seen as a play that captures both a relatively higher yield and also provides growth to its payout. That’s been through thick and thin periods both.
ENB Dividend History (Enbridge)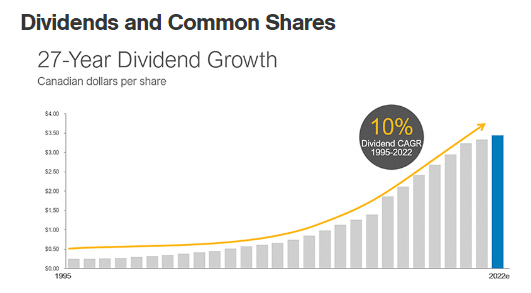
Conclusion
MFD is an interesting infrastructure play that also carries some sizeable exposure to senior loans. That makes it fairly unique amongst the infrastructure funds. The larger energy exposure in the fund has also helped to provide better results relative to what could be seen as infrastructure peers. The fund’s discount is also fairly attractive relative to its historical level. At the same time, the performance wasn’t strong enough results to generate positive total NAV returns even due. So one that is more bullish still on energy would probably take a pass on this fund.
Be the first to comment