

Investment Thesis
Global methane emissions, and efforts to reduce them, are attracting significant and increasing private, corporate, and political attention and funding. Satellites will provide ubiquitous high resolution surveillance and compelling images.
This attention will increasingly be reflected in both investment preferences and regulatory mandates, creating a demand to detect and reduce methane emissions, and to document this performance.
Many businesses will be significantly impacted, for good or ill. We will discuss some likely impacts, and offer some specific opportunities for investors to consider.
Introduction
I recently wrote an article on Renewable Natural Gas, where investment is driven in part by a desire to reduce methane emissions. This article is a broader and deeper look into that motivation, and a look at other implications for investors.
Methane emissions attributed to human activity is termed anthropogenic.
To set the stage, in round numbers, in recent years ~ 600 Mt/yr of methane are emitted by all sources, with the split between natural and anthropogenic methane emissions is about 40/60. The anthropogenic component has three major components: agriculture, fossil fuel, and waste which contribute ~ 40/35/20. Most of the emissions come from a few economies, with varying degrees of enthusiasm to reduce emissions.
In this article we will look at methane 101, why methane emissions are a focus, the Global Methane Pledge benchmark, global emissions data, US emissions data and the US regulatory response. We will then take a look at some responses from industry, risks, and wrap up with considerations for investors.
Methane 101
Methane (CH4) is a colorless, odorless gas produced by the decay of organic material. The natural gas used by a stovetop, water heater, or power plant is about 95% methane.
When released into the atmosphere, methane eventually combines with oxygen in the upper atmosphere to form CO2 and water. Half of the methane is gone in ~ 6 year (the half-life), but because some methane lasts much longer, on average a methane molecule will last ~ 9 years in the atmosphere (the lifetime). Most discussions refer to lifetime.
Methane has a much stronger atmospheric heating effect than CO2, but has a much shorter lifetime. The EPA estimates that this combination of a stronger effect for a shorter time gives a ton of methane about 25x the heating impact of a ton of CO2, measured over a benchmark 100 year time frame. To make comparisons of the effects of CO2, methane, and other greenhouse gases “GHG” simpler, volumes are often stated in effective tons of CO2.
Moving on from atmospheric physics, we need to talk about biology for a moment. The largest single source of anthropogenic methane is enteric fermentation. Enteric fermentation is part of the digestive process of ruminants (e.g. cattle, buffalo, sheep) with complex stomachs, with the resultant methane released as burps. Cattle are the dominant species, accounting for about 2/3 of total livestock emissions.
A Problem and an Opportunity
The National Oceanic and Atmospheric Administration “NOAA” estimates about 640 million tons of methane were emitted by all sources into the atmosphere in 2021, much less than the 36 billion tons of CO2. Although methane is emitted in much smaller quantities than CO2, it is considered the second most important GHG after CO2.
Methane emissions and concentrations in the atmosphere both reached record levels in 2021, according to NOAA reports. While methane is both being added to and reacted out of the atmosphere, the net concentration has increased (see the chart below).
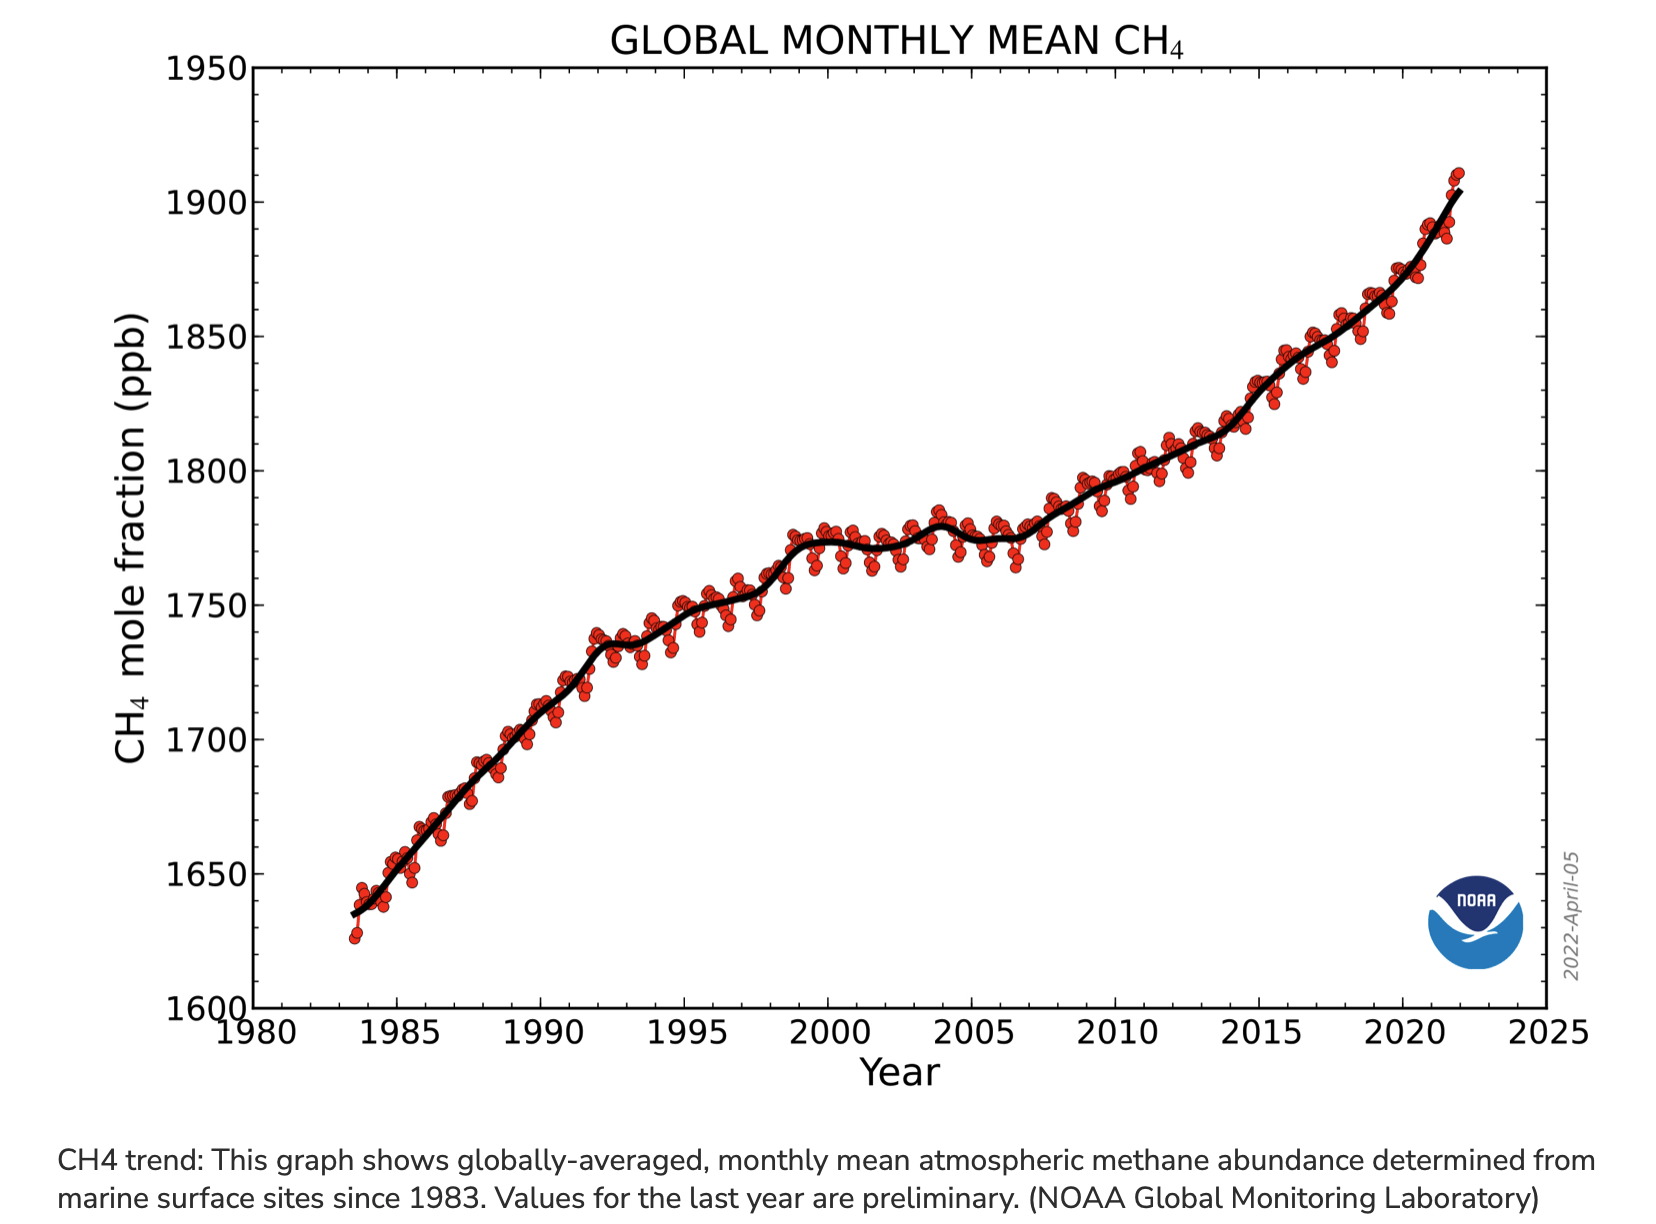
Atmospheric Concentration of Methane (NOAA)
Because of methane’s larger effect ton-for-ton, and its relatively rapid decay, a reduction in methane emissions is recognized to have the potential for a large and relatively rapid impact effect on atmospheric warming. One response to this recognition was the Global Methane Pledge.
The Global Methane Pledge
The Global Methane Pledge, launched in November 2021 at the UN’s COP26 climate conference by the US and the EU, is a framework and benchmark for voluntary efforts to reduce global anthropogenic methane emissions. The goal is a 30% reduction in emissions by 2030, compared to the 2020 baseline.
It’s a big ask. About 122 countries have signed up. It’s important to know that China, India, Russia, and Iran have not signed the Methane Pledge.
The International Energy Agency publishes a Methane Pledge Tracker to assess status and progress.
We will look at some data to get a better assessment of what’s involved, but one might expect there to be issues in asking for significant changes in operating practices, if not outright reductions, in energy and food production.
Global Emissions
We will look at two data sets for global methane emissions. There is some variation among these and other estimates, the data is usually a few years old, and may use categories with different definitions. For investment assessment purposes, I don’t think these issues are material.
UN Global Methane Assessment
The UN’s May 2021 Global Methane Assessment provides 175 pages of data and analysis. The summary of the distribution of anthropogenic methane emissions by sector and geography below is useful for our purposes.
The numbers at the top right of the chart group emissions into five sectors; livestock 33%, oil and gas 25%, landfills and waste 20%, coal mining 13%, and rice cultivation 9%.
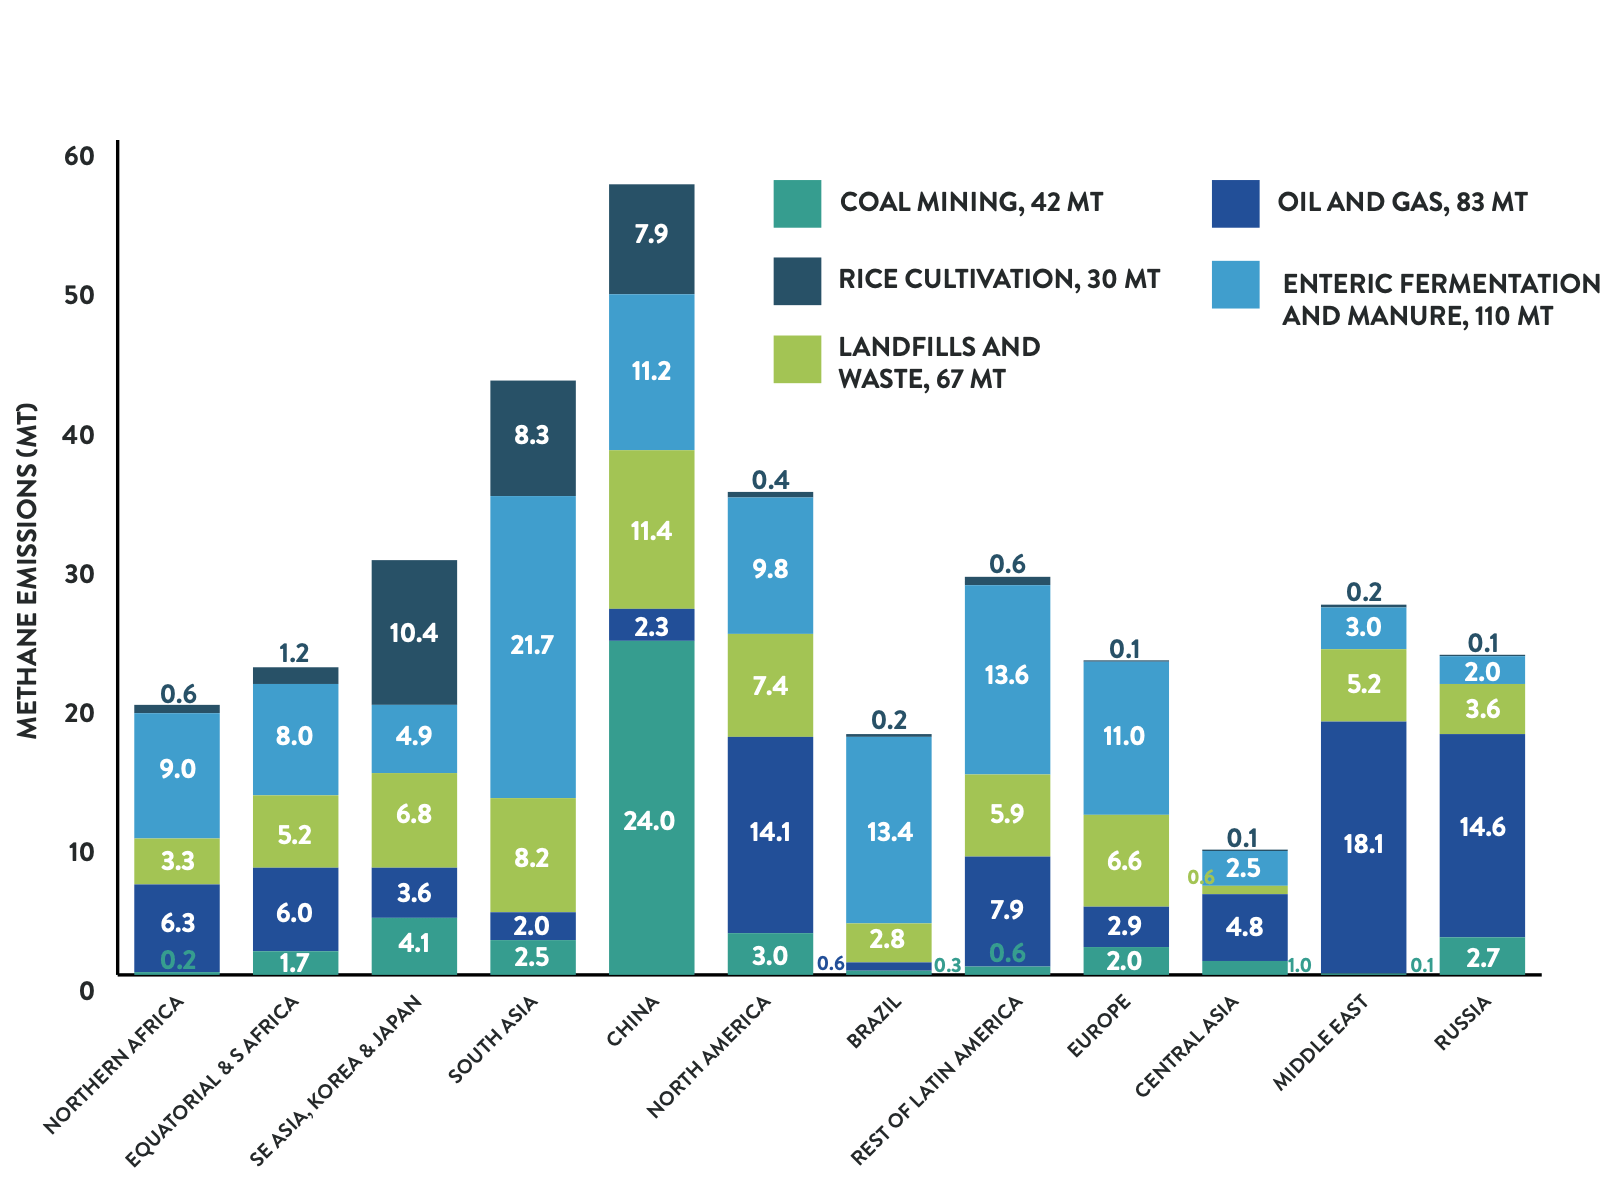
Methane Emissions by Sector and Geography (UN Environmental Program)
One can readily see the obvious targets for a 30% global reduction. There are 11 elements in the above chart with amounts > 10 Mt/yr.
In approximate order of size: coal mining in China, livestock in South Asia, oil and gas production in the Middle East, Russia, and North America, livestock in Brazil, livestock in the rest of Latin America, landfills in China, livestock in China, livestock in Europe, rice farming in Asia.
World Resource Institute
The World Resources Institute provides another view, which shows emissions over time for the Top 10 GHG emitting countries. We can display for that group the total anthropogenic methane emissions, emissions due to agriculture, and energy. I set the display to show data starting in 2000.
The chart (below) shows that total methane emissions were roughly flat for most countries with the exception of China. The shares for 2019 among this group were China 25%, the US 16%, Russia 15%, India 14%, Brazil 9%, Indonesia 8%, EU 8%, and Iran 5%. All others are less than 1%.

Methane Emissions – Top 10 Countries (World Resources Institute)
Similar views are available for methane by sector. The quality of the images here is not great, so I’ll just describe the changes over time, and give the results for 2019.
For the agriculture sector, total emissions from this group are almost constant from 2000-2019. India and Brazil increased, China and the EU decreased. US emissions were constant. In 2019, the shares were India 29%, Brazil 19%, China 18%, EU 12%, US 12%, Indonesia 5%, Russia 3%. All others are less than 1%.
For the energy sector, total emissions from this group increased about 66% from 2000-2019. Emission from China were up 112%, from the US 60%, and from Russia 39%. In 2019 the shares were China 34%, Russia 26%, US 21%, Iran 8%, India 4%, Indonesia 3%, EU 3%, Brazil 1%. All others are less than 1%.
The chart below summarizes the 2019 data: total methane, agriculture sector, and energy sector. Eight countries have more than a 1% share in at least one category, and are shown on the chart.
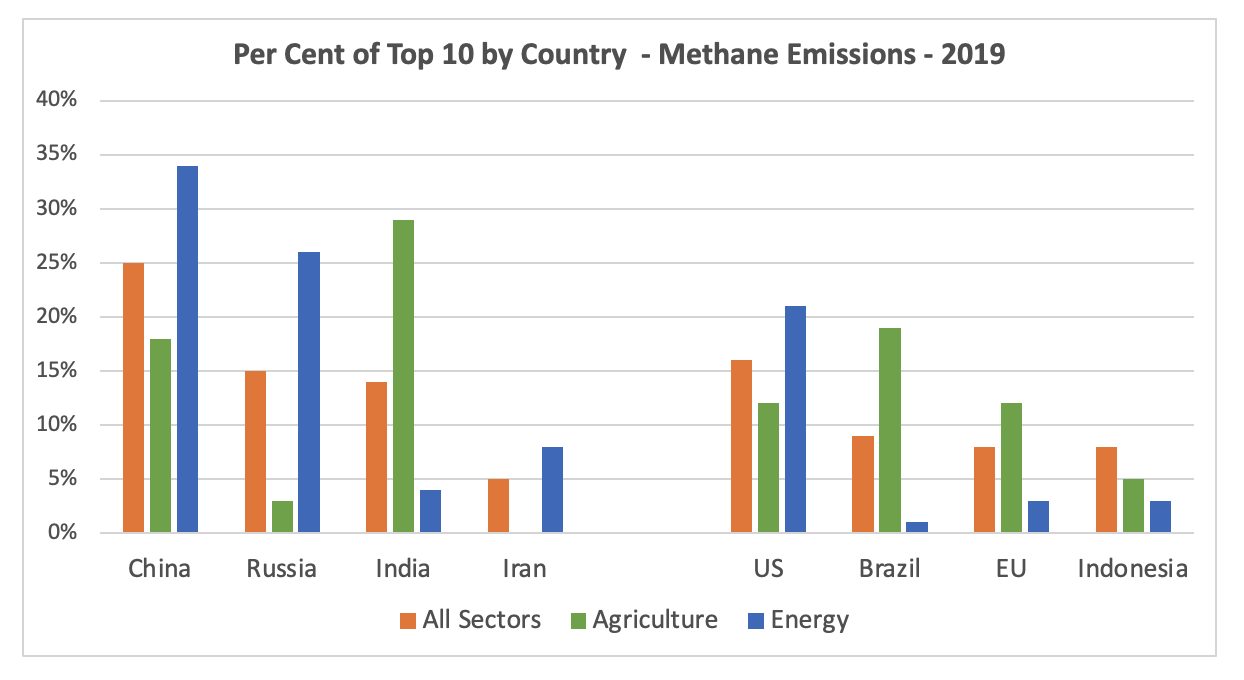
Methane Emissions Top 10 (Chart by author, data World Resources Institute)
Recall that China, Russia, India, and Iran (on the left side of the chart) – which together account for 59% of the Top 10 emissions – have not signed the Methane Pledge.
US Emissions
In 2021, three sectors dominated US methane emissions – energy 44%, agriculture 31%, and waste 21%. Methane accounts for about 10% of US GHG emissions.
The Environmental Protection Agency “EPA” reported that US methane emissions declined about 9% from 1990 to 2021, from 808 to 738 MMT of CO2 equivalent. By sector, methane emissions from energy declined 13%, and from waste 20%, while increasing 8% from agriculture. The US population increased 20% over that period.
The EPA publishes an annual inventory of US Greenhouse Gases Emissions and Sinks, and a useful Fast Facts summary. The Fast Facts table below shows the methane sources, with the four largest sources for 2020 highlighted; enteric fermentation, natural gas systems, landfills, and manure management.
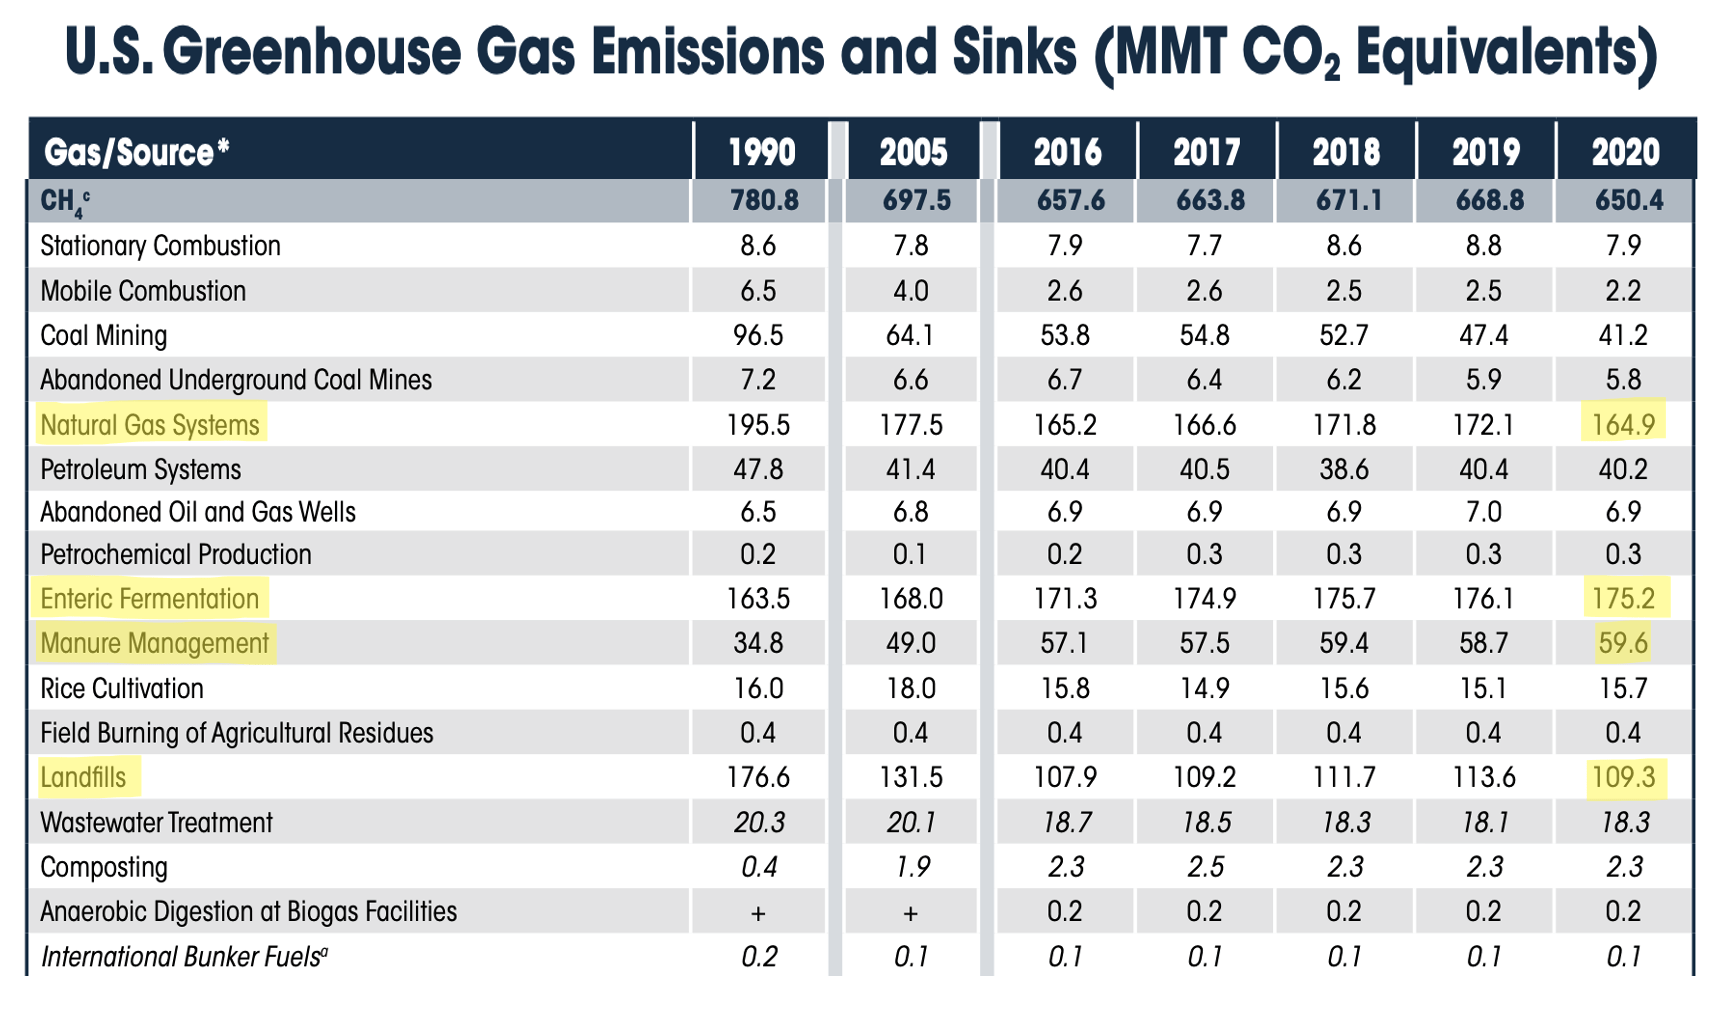
US Methane Sources (EPA)
US Regulation
The US “Inflation Reduction Act” was signed into law on 16 August 2022. It contains an initial methane emissions charge of $900 per ton, applicable to certain facilities, and is the first US tax or fee levied directly leveled on a GHG.
The charge would currently apply to about 2200 oil and gas facilities that are already required to report GHG emissions. The largest impact appears to be on onshore production and gathering systems. The charge applies to emissions above a threshold: 0.2% for production, 0.05% for gathering, and 0.11% for transmission. The scope and application of this charge is described in detail here by the Congressional Research Service.
There are multiple other current and pending regulatory efforts at the federal and state level.
The US has also allocated funds explicitly to plug abandoned wells, with initial funds available in May 2022 to plug 277 wells on public lands.
Industry Response
Industry is responding to the increasing demand to reduce methane emissions.
Oilfield Services
In March 2022 Schlumberger (NYSE:SLB) announced a new business, End-to-End Emissions Solutions (SEES). I believe it’s the only current offering at that scale. The graphic below provides a nice summary of the scope their effort, with an initial emphasis on methane detection, flaring, and leak repair, but built on an extensive technology services platform.

Scope of SLB SEES Offering (Schlumberger)
One of the interesting things about SLB’s offering is that it leverages an already existing global sales and service footprint, a reach that except for satellites, is perhaps unique.
The US Natural Gas Industry
ONE Future is a non-profit 501(c)(6) trade group formed in 2014 by the US natural gas industry. There are currently 50+members, spanning five stages in the natural gas value chain.
The overall goal, set in 2014, is to achieve and sustain total methane emissions of 1% or less of gross production by 2025. Their latest data (2021 report, 2020 data) show their members have about a 0.4% loss rate. The member companies only cover 20-50% of US activity, and one might expect a bit of self-selection, but it’s a useful benchmark.
ONE Future established targets, essentially budgets, for each of the five stages (which they call sectors); see the table below. Transmission and Storage, and Production are the two largest sectors, accounting for over half of the emissions in the value chain. The primary sources of emissions at each stage from the wellhead to the consumer have been identified and quantified; the table lists the largest four for each sector. Note how often compressors make the list.
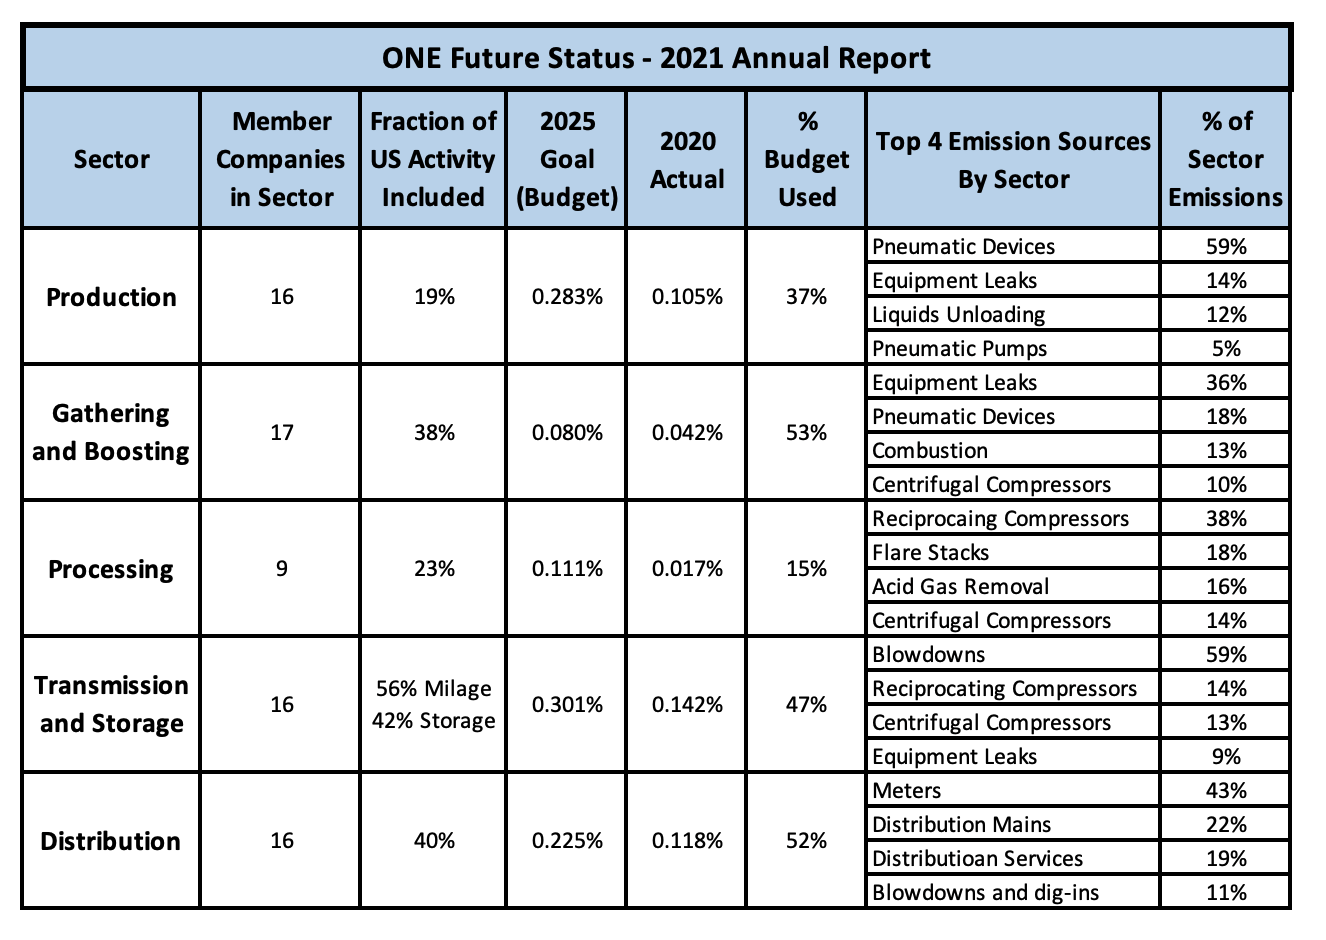
One Future Status – 2021 (Table by author, data from One Future)
The Williams Company (NYSE:WMB), which handles about 30% of US natural gas, provides an example of the emission reduction efforts and investments underway.
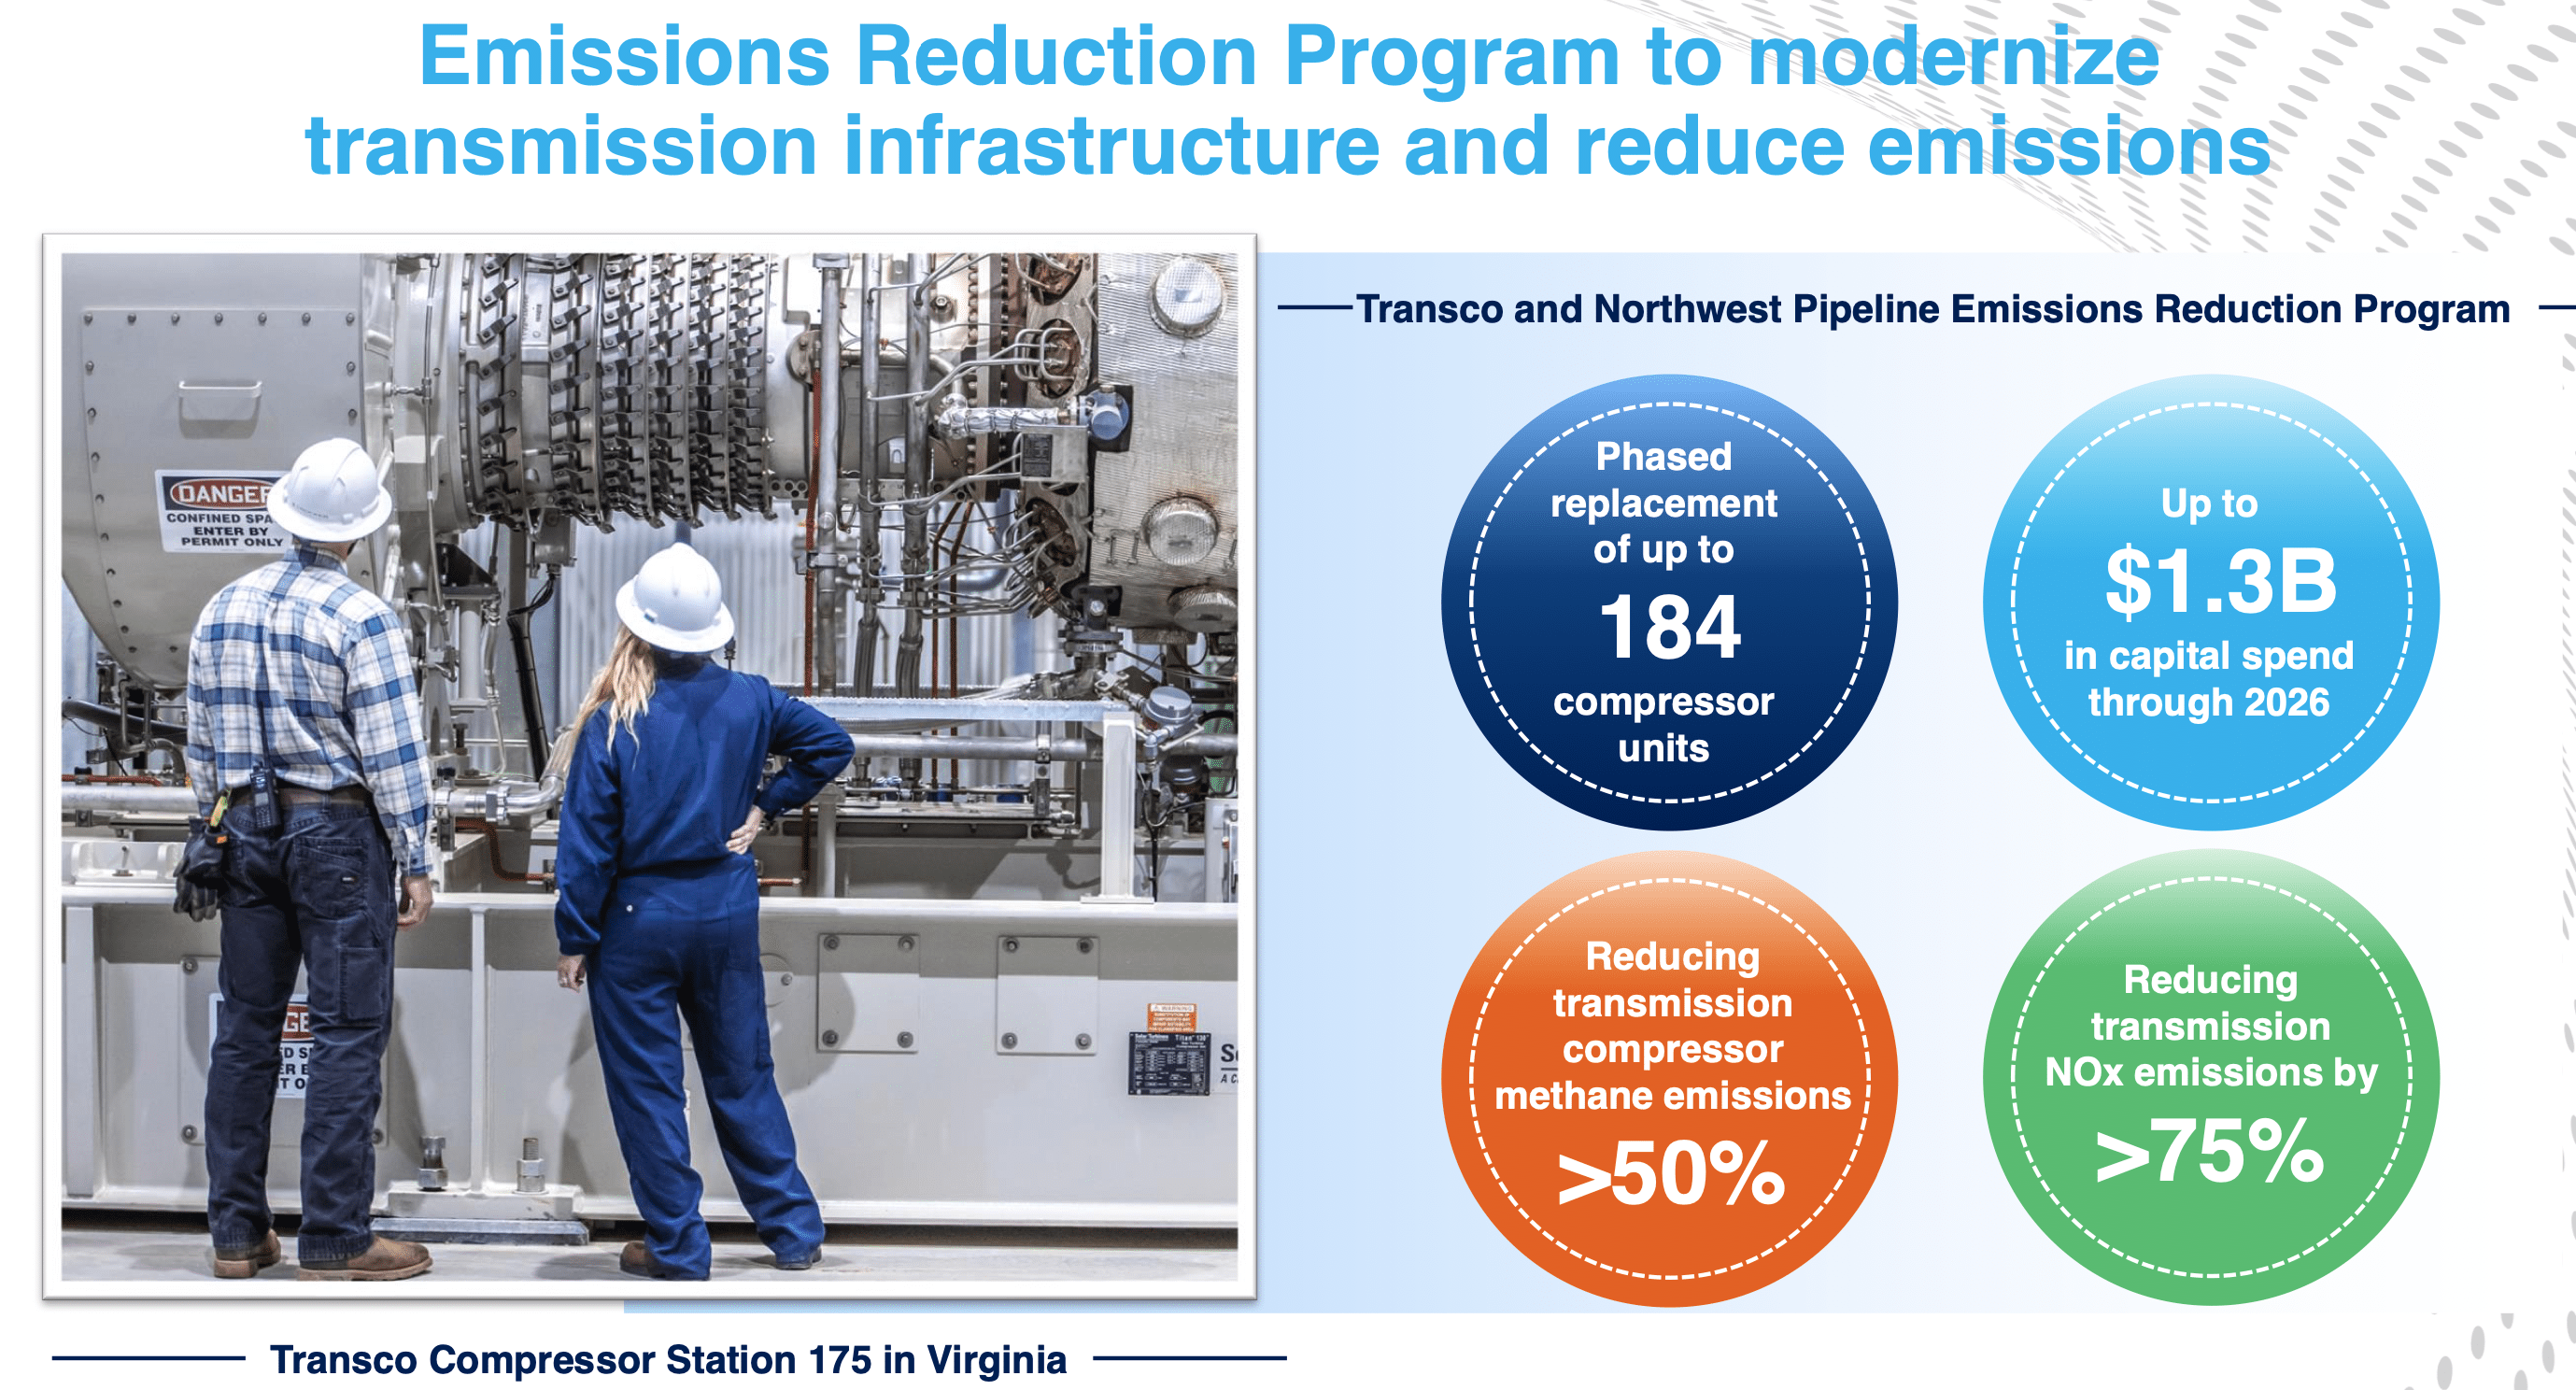
Emissions Reduction Investment (WMB September 2022 Investor Presentation)
The EPA offers a database of 72 recommended technologies to reduce methane emissions under their Natural Gas STAR Program, with estimated capital cost and payback time. Two examples are shown below. The embedded links provide considerable detail on what is actually involved in making some of these changes.
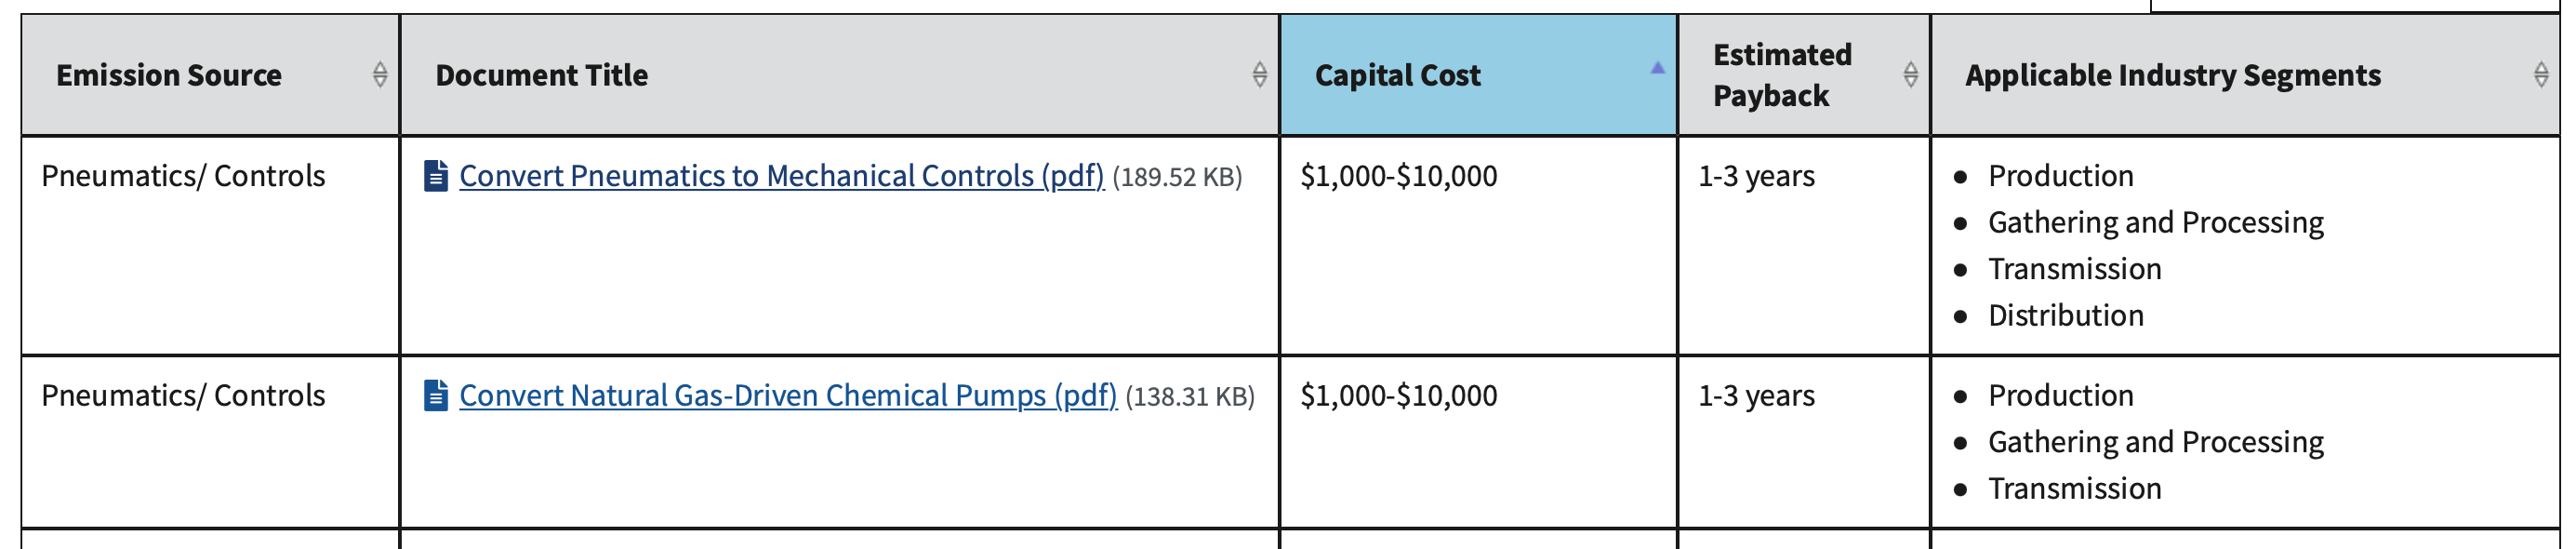
Methane Emission Reduction Actions (EPA – Natural Gas STAR Program)
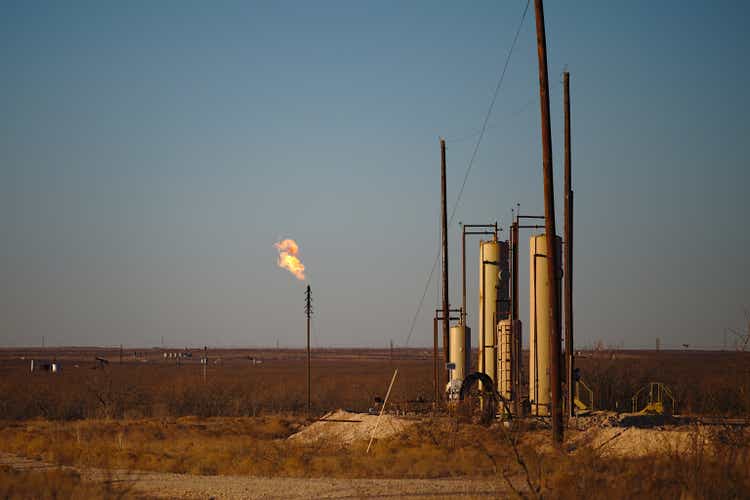
Flaring
Flaring natural gas is probably the single most visible methane emission. This February 2022 article in Environmental and Climate News reports that onshore gas flaring in Q3 2021 dropped to the lowest volume since 2012, ahead of new 2023 federal regulations covering sites which produce the majority of flared emissions. An increasing number of companies have stopped routine flaring, e.g. APA Corp. (NASDAQ:APA).
Texas has led the way in flaring reductions, says Jason Modglin, president of the Texas Alliance of Energy Producers.
“We are getting to low amounts of available recapturable gas – just 0.25 percent of gas is going to flare in Texas today,” Modglin said. “This means 99.75 percent is being sold in the marketplace.
Research results reported in Phys.org in September 2022 suggest that when flaring does occur, combustion is less effective than previously estimated; efficiency may be 91% instead of 98%, releasing about 5x more methane than previously thought.
Satellite Monitoring
GHQSat Inc. (private) is the world leader in high resolution methane monitoring from space, offering 25-meter resolution. They offer satellite and aircraft methane detection and analytics. Imaging of the methane plume from the September 2022 Nord Stream leak in the Baltic is here.
Their first 15 kg satellite was launched in October 2020. Founded in 2011, they are a Canadian company with ~140 employees, and have raised about $110 million in multiple funding rounds (SLB was an investor in the September 2020 Series B round). I would not be surprised to see them acquired within the next few years.
In September 2022, Spire Global (NASDAQ:SPIR) announced an agreement to launch 3 GHQSat payloads in 2023, to supplement GHQat’s current fleet of six deployed satellites.
Stephane Germain, CEO of GHGSat, said (slightly edited):
“Hosting GHGSat payloads on Spire satellites allows us to focus on monitoring rather than on satellite manufacturing and operations. Having successfully completed and launched our initial satellite assets, GHGSat plans to add hosted payload solutions to complement our full satellite solutions to accelerate monitoring. We expect these satellites and payloads to provide facility-level emissions measurements for our customers at the lowest detection threshold available in the world today.”
Planet Labs PBC (NYSE:PL) plans to launch two Tanager hyper spectral satellite in 2023, supporting the Carbon Mapper program, with methane mapping among their capabilities.
As an indication how rapidly satellite capability is evolving, the non-profit Environmental Defense Fund, Inc. is developing the 350 kg MethaneSAT, intended to be the most advanced methane tracking satellite in space, with global coverage every 3-4 days. Technical details are discussed here. They intend to make their data public, and free of charge. A launch is scheduled for October 2022 or later.
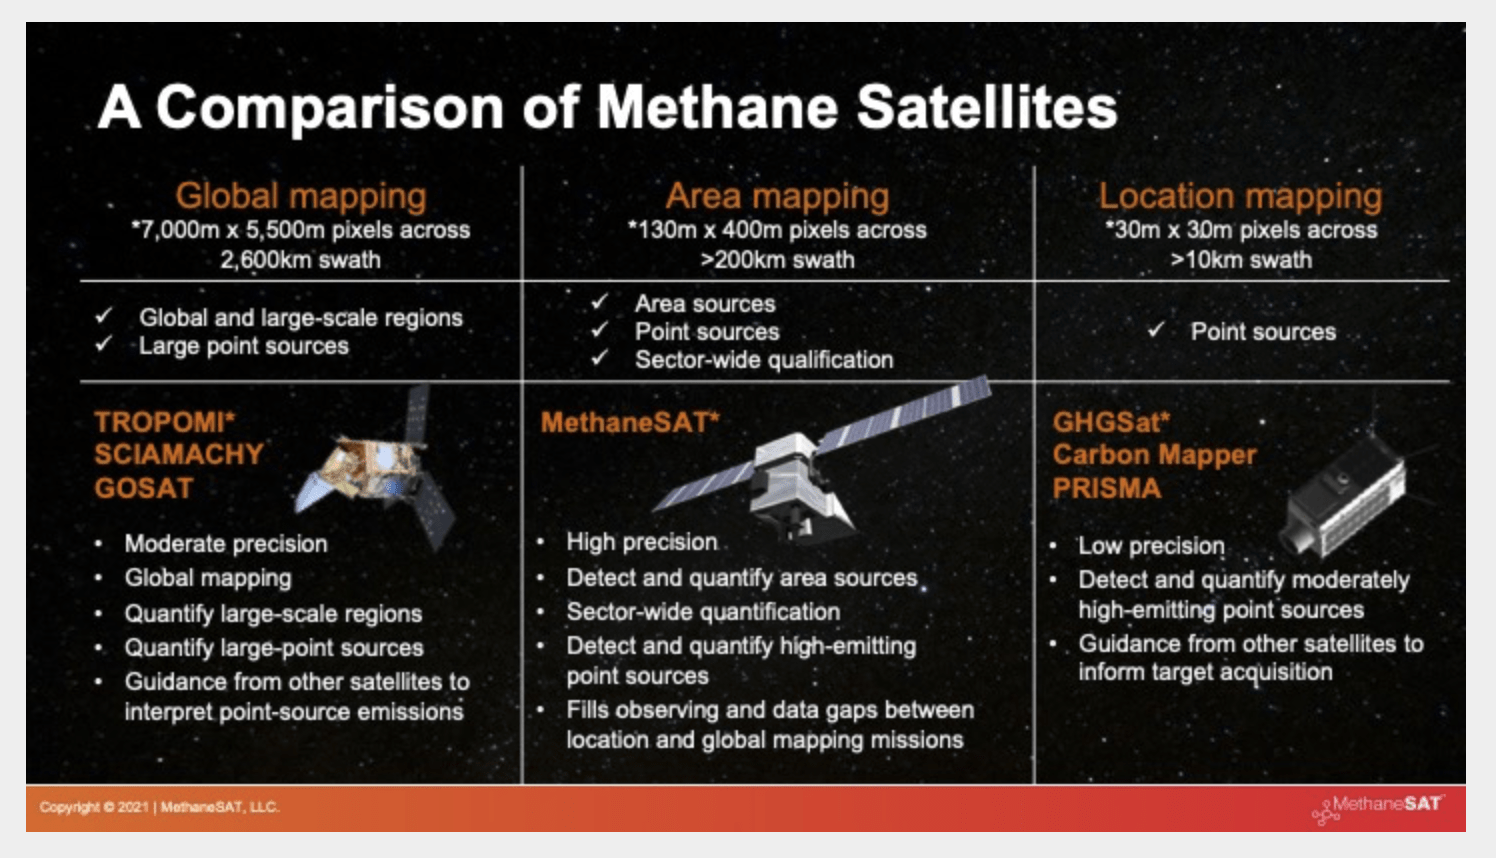
Methane Satellites Comparison (Environmental Defense Fund)
Among the motivations for comprehensive surveillance, there is evidence to suggest that emissions estimates may be systemically too low from some source types. This should become clearer as surveillance becomes more routine.
In addition, some specific sites appear to be “super emitters”, contributing significantly more methane than average. Finding and treating these sites will have a disproportionate impact.
Ground Based Monitoring
Continuous on-site methane detection is and will be available from companies like Ecotec Group and Terra Surface Logging Systems (both private). Archrock (NYSE:AROC) recently bought an interest in Ecotec. The barriers to entry here are substantially lower than for satellites.
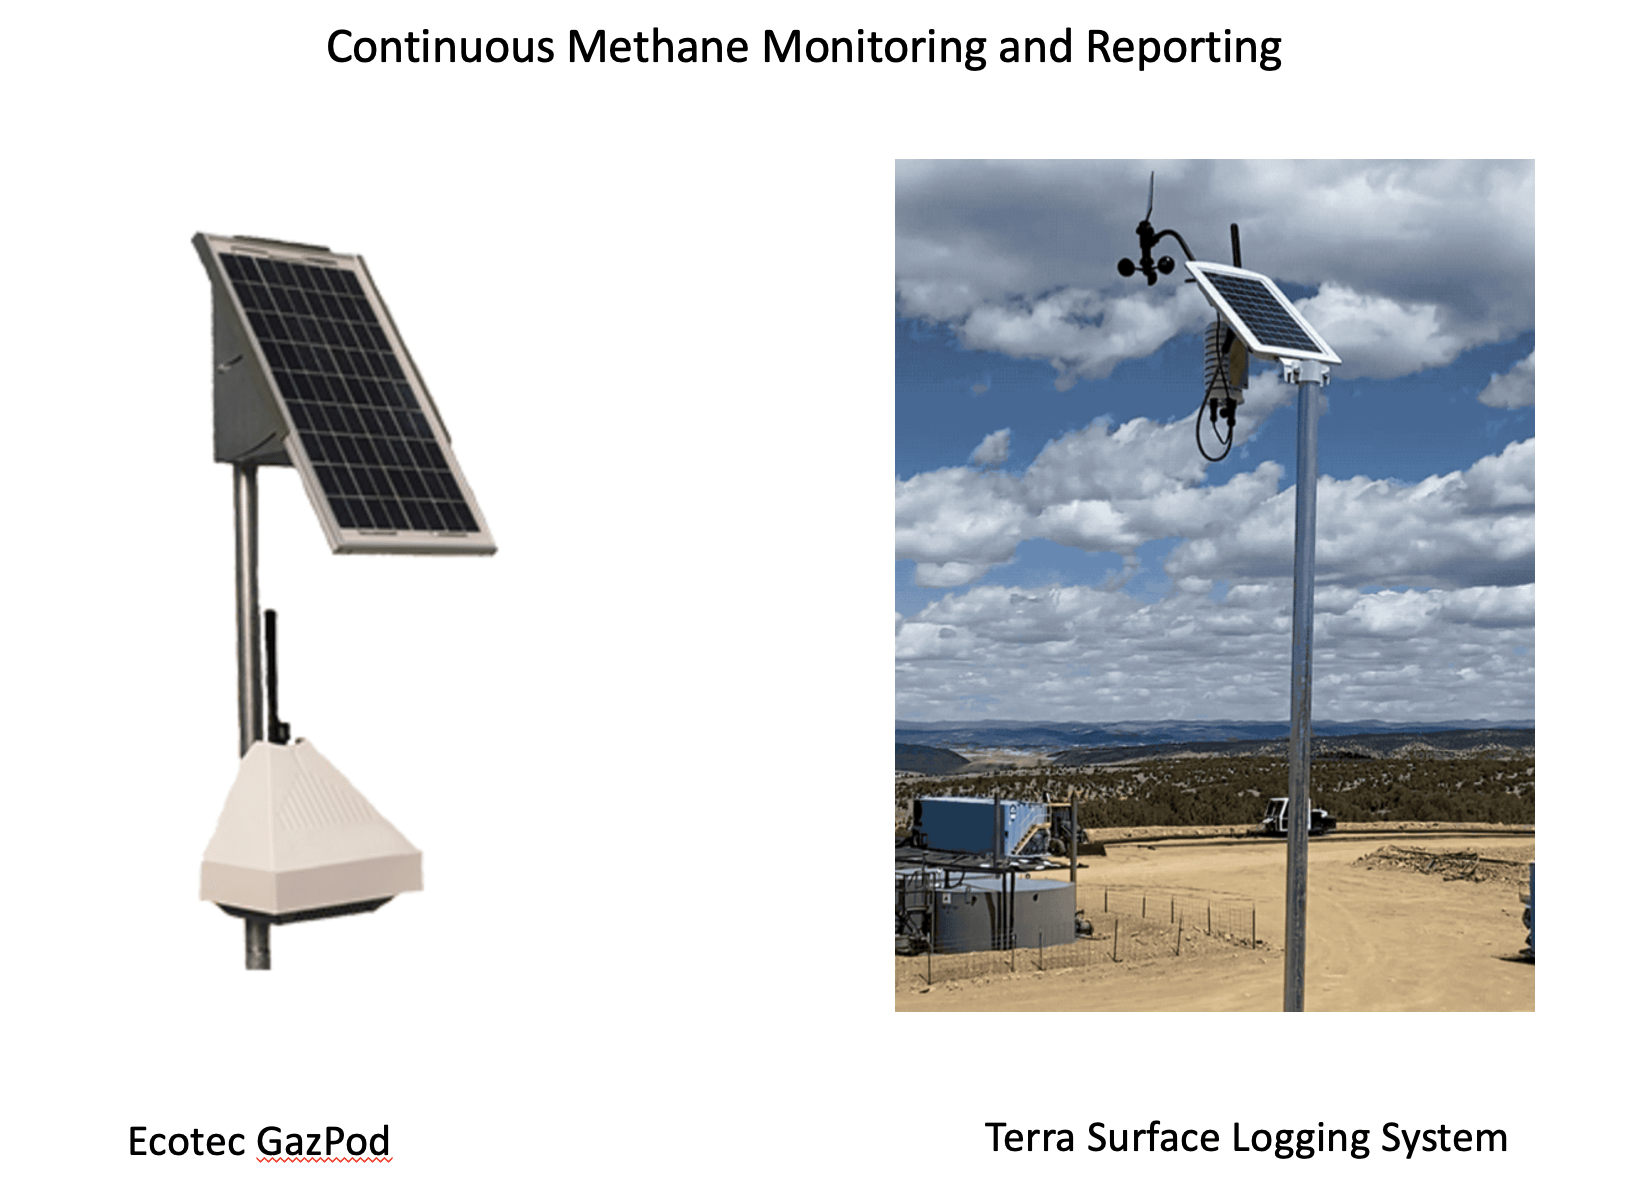
Continuous On Site Methane Monitoring (Ecotec and Terra SLS websites)
Livestock Management
Enteric fermentation emissions per kg of meat or milk could be reduced by more efficient livestock management methods.
Developing nations have more than 76% of the world’s cattle/buffalo population, yet account for only 32% of global livestock production (see here). In addition, livestock operations are dispersed among many small scale producers, and have high economic and social importance.
While US and EU production is already very efficient, the UN has a number of projects to reduce methane production per unit of output (meat, milk, wool, etc.).
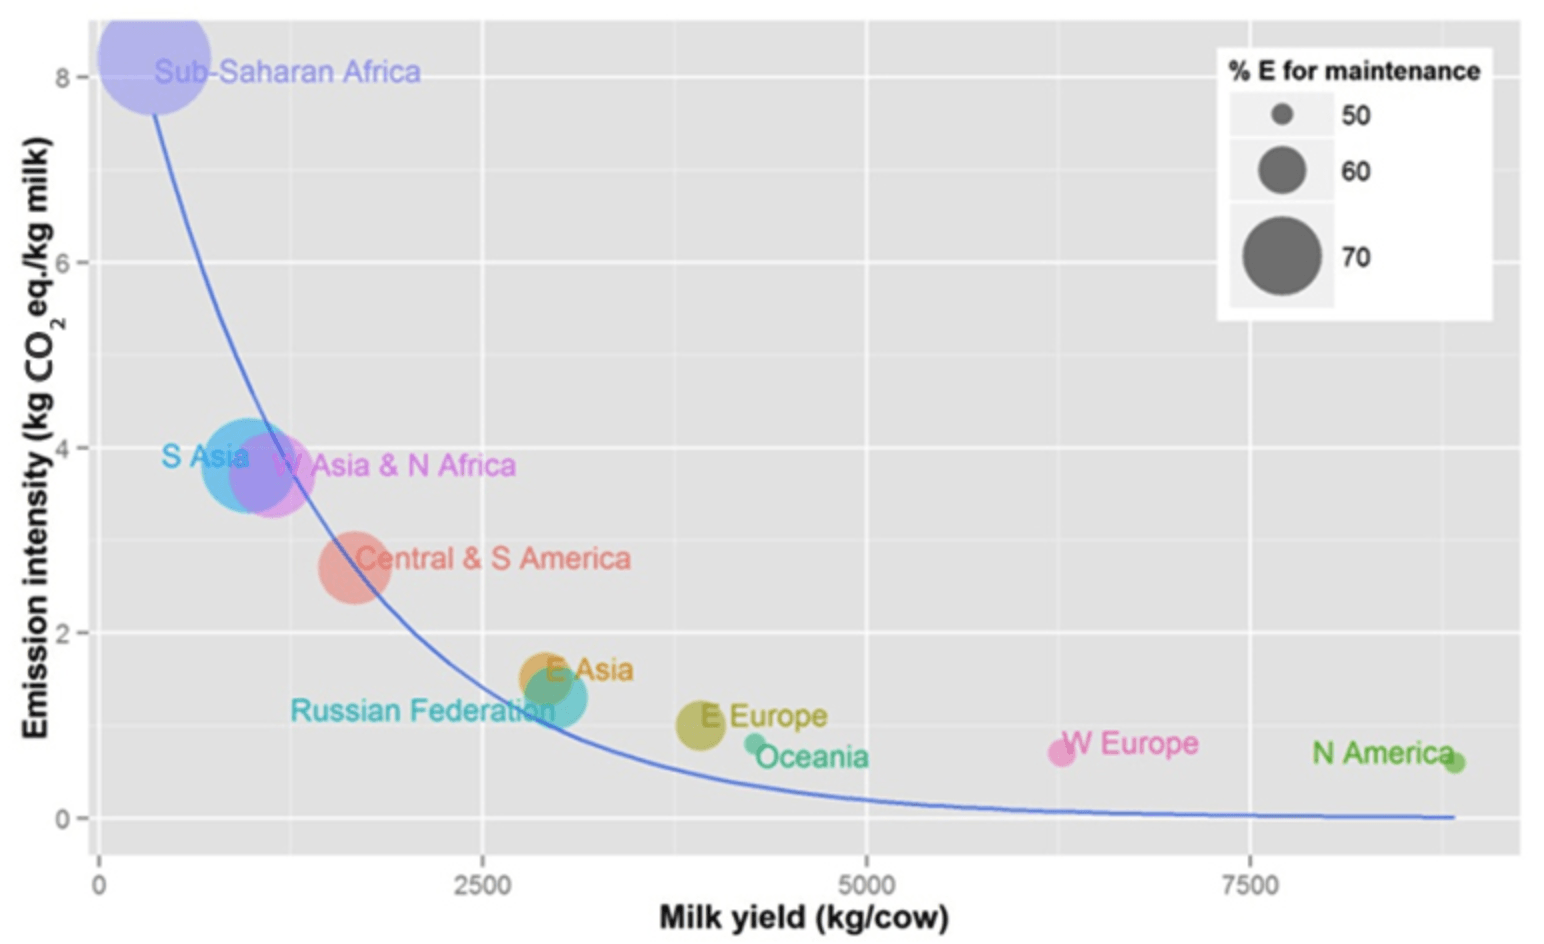
Methane Emissions vs. Milk Yield (UN)
A January 2022 review of enteric methane reduction is available here.
New Zealand, which has proposed legislation to become the first country to tax enteric emissions in 2025, has also been experimenting with feed additives to reduce emissions.
The application of polymeric sulfate has been demonstrated to reduce the generation of methane from “farm dairy effluent” by > 90%. This is now being marketed as EcoPond by Ravensdown, a farmer’s cooperative in New Zealand.
Meat Alternatives
Impossible Foods (private) makes meat substitutes from plants. This includes plant-based versions of ground beef, sausage, chicken patties and nuggets, and ground pork.
There have been discussions of Impossible going public at least since April 2021. They raised $500 million in their latest round of funding in November 2021. Impossible announced the layoff of about 6% of the 800 person staff in October 2022, the second round of layoffs in 2022.
A September 2022 comprehensive product review is here. I checked my local grocery; prices the second week of October 2022 for frozen patties were 34 cents per ounce for 91% lean beef, and 67 cents for Impossible Beef ($2.66 per serving).
Meat substitutes are not an automatic win. Beyond Meat, Inc. (NASDAQ:BYND) went public in May 2019, is currently unprofitable, and has seen shares decline >85% this year.
Methane Removal From the Atmosphere
While still at the research level, this paper makes the case that methane removal could have 10-20x more impact than CO2 removal. Technologies include genetically engineered bacteria for landfills and enteric fermentation. Methane capture from the atmosphere near the source, such as in dairy farms where concentrations may be 1000x higher than in the general atmosphere, might eventually be more likely atmospheric capture scenario.
Risks
The main risk that I see to the thesis here is timing – implementation will be slower than many would like.
There is a push to eliminate fossil fuels and their associated methane emissions, but I’ve discussed here and here why I think that is going to be a very long process.
We’ll look at three examples of why implementation might be slow. The number is parentheses is the fraction of worldwide anthropogenic emissions from the UN chart.
China – Coal (7%)
China Dialog reported in January 2022 that Teng Fei, deputy director of the Institute of Energy, Environment and Economy at Tsinghua University, noted that methane emissions in the US and EU are concentrated in the oil and gas sector, whereas China’s come mainly from coal mining. Tackling methane emissions from coal mines is harder and more costly, and the potential for reductions is less. Teng Fei said:
“Given the differences in the make-up of methane emissions and ease of reduction, the targets proposed by the EU and the US are easier for them to achieve than for China. I think that’s the reason China didn’t sign up to the Global Methane Pledge.”
China is still actively building coal power plants, with Bloomberg reporting in September 2022 that China is expected to add 270 gigawatts of thermal capacity in the five years through 2025, according to China Energy Engineering Corp., the country’s top energy engineering conglomerate.
Brazil – Beef Cattle (4%)
Enteric fermentation is estimated to account for 86% of agricultural methane emissions.
This analysis by Marfrig Global Foods S.A. ( Pink OTCPK:MRRTY), the world’s largest hamburger producer and second largest beef producer, reports that the livestock sector represents 10% of total Brazilian GDP in 2020, with 187 million cattle, and supporting about 4.5 million jobs. Beef is considered a staple food. About 20% of production is exported, with China the largest customer.
Brazil is working on the problem, but it appears that deforestation and other issues may have a higher priority. Marfrig seems to be preparing for a future when at least some of the beef it exports is certified, and priced, as being environmentally compliant.
US – Stripper wells (North American Oil and Gas 4%)
The EIA estimates that there are about 940,000 producing wells in the US. The National Stripper Well Association reports that this includes 760,000 stripper wells; 400,000 oil and 360,000 gas. A stripper wells is defined as one that produces less than 15 barrels of oil or 90,000 cubic feet of gas per day. They estimate this accounts for 7% of US oil production and 8% of US gas production.
This April 2022 paper estimates that these wells account for 6% of US oil and gas production, but produce 37-75% of all US well site methane emissions. The top 5% of emitters account for about 50% of total emissions from the group. The estimated loss rate (leakage) for these wells is > 10%, compared with ~ 1.5% for all well sites.
A stripper that produced 3 barrels a day at $50 a barrel generates $55,000 per year in revenue, much less in profits. Many of these wells are operated by small businesses. It’s likely that a large number of these wells and businesses will eventually be shut down, with measurable reductions in US oil and gas production.
Investor Takeaway
US investors should expect increased regulation and costs – compliance, taxes, fees, mitigation – associated with any activity that produces methane, but particularly fossil fuel, beef and dairy cattle, and landfill operations. Historically, the regulatory ratchet only goes one way.
Schlumberger now offers a 1.0 version of a comprehensive detect-repair-certify solution for the oil and gas sector. This one will be interesting to watch. There will likely be only a few competitors in this market, at least on a global scale.
The major players in oil and gas production, gathering, and transport will act and invest proactively. Routine flaring will stop, leaks will be detected and fixed. It’s an easier call with gas at $6 MMbtu than $2.
Satellite methane reconnaissance and analytic services will become standard and ubiquitous, and applied across all sectors. GHQSat appears to be the current leader in methane reconnaissance, but is private. PL is scheduled to have capability in orbit in 2023. There will likely be several players in this market. I would not be surprised to see GHQSat acquired.
On the ground monitoring will likely become increasingly standard. This market will be fragmented, with many non-public providers. Archrock’s (AROC) equity investment in EOCTEC (private), see here, might be one entry point.
Renewable Natural Gas will benefit. See my recent article here, which includes some companies such as Ameresco, Inc. (NYSE:AMRC), Montauk Renewables, Inc. (NASDAQ:MNTK), and Clean Energy Fuels Corp. (NASDAQ:CLNE) who are active in this area.
There will be advocacy for social and behavioral changes to reduce meat consumption. Longer term, meat substitutes will benefit. Impossible Foods, Inc. (private) appears to be the leader and will likely go public at some point.
Personally, of the companies mentioned in this section, I have positions in SLB, AROC, WMB, PL, and SPIR, and am adding GHQSat and Impossible Foods to my IPO watch list.
I would be interested in hearing from readers about other opportunities.
Be the first to comment