

Leon Neal
Thesis
Meta Platforms (NASDAQ:META) is scheduled to announce its Q3 earnings report (“ER”) after market close on Wednesday, October 26, 2022. Investors are already on the edge given the turbulence surrounding the stock, and the anticipated ER has sent its implied volatility (“IV”) in the options market to be near a 52-week peak as you can see from the following chart. Its current IV (the orange line) is not only close to a 52-week peak but has already diverged substantially from 30-day historical volatility (the blue line).
Source: IVolatility.com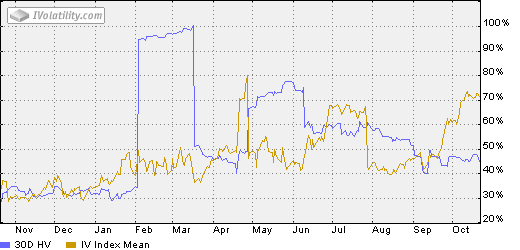
Such heightened volatility has created an opportunity to buy the shares at $122 or get paid 6.4% in one week (by Oct 28, 2022) as you can see from the next chart below. Its Oct 28, 2022 put option with a $130 strike price is now trading around $8.32 (which translates into 6.4% of $130). So if you write such a put and the stock price rises above $130 on Oct 28, then the put option expires worthless and you would be able to make 6.4% in one week, not a bad return for a short-term trade.
On the other hand, if the stock price dips below $130 on Oct 28 the put is exercised, then you would effectively buy the stock at about $122 ($121.68 to be precise = $130 – $8.32). And next, you will see that such an entry price is a good deal for long-term holding too.
Source: oic.ivolatility.com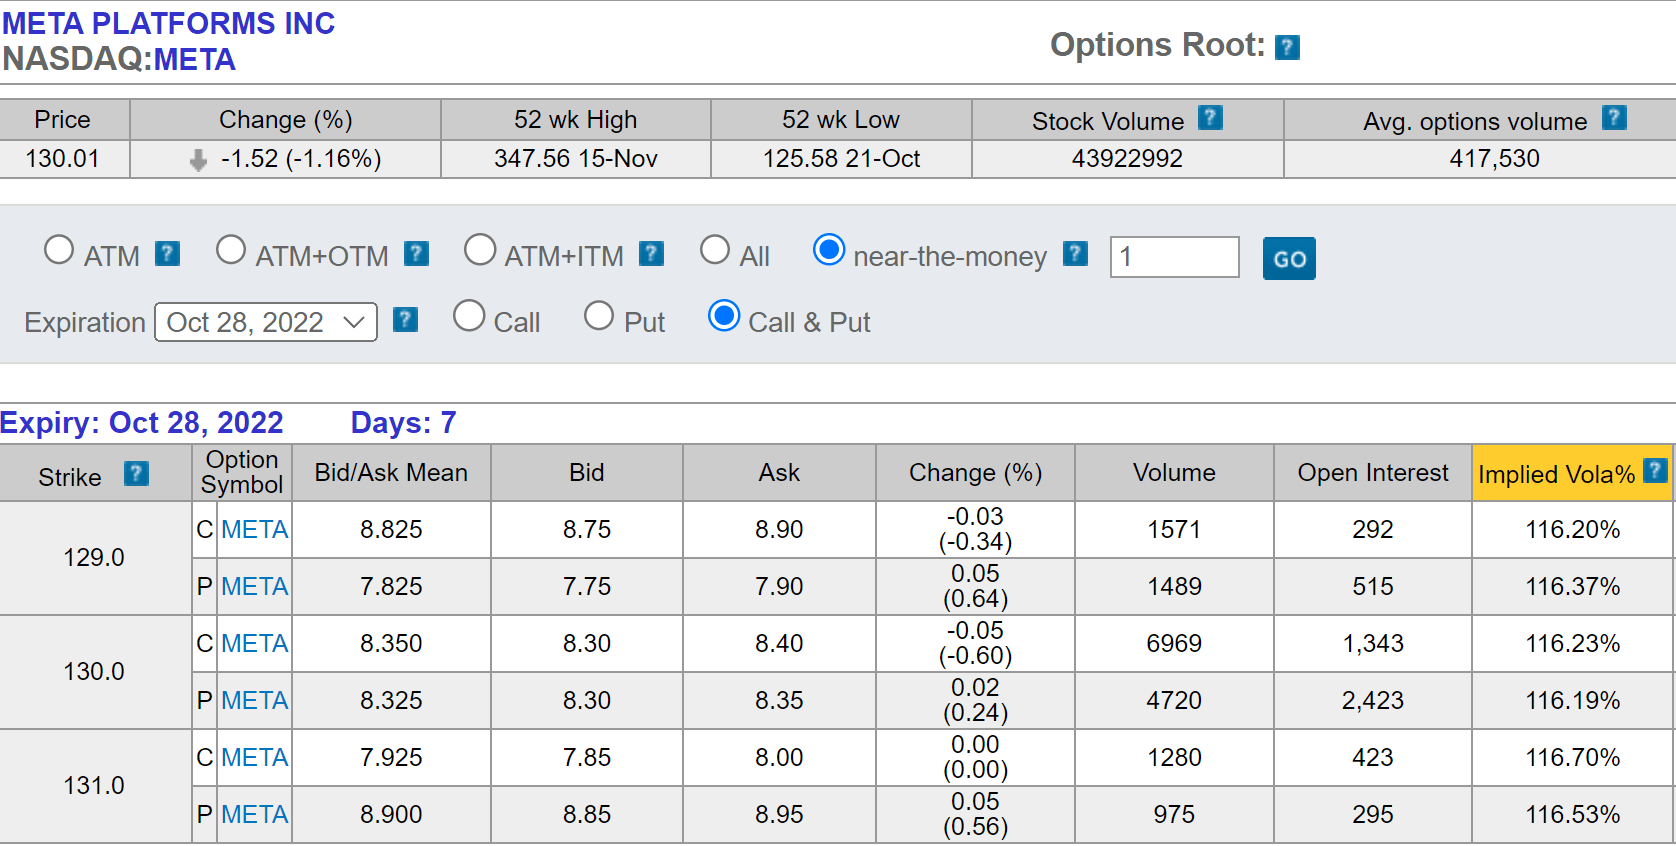
Long-term growth projection
As detailed in my blog article, the long-term growth rate of our business is governed by two factors only – ROCE (return on capital employed) and reinvestment rate. More specifically,
Long-term growth rate = ROCE * Reinvestment Rate
And next, we will find out both parameters one by one. First, let’s analyze its ROCE. For a business like META, as detailed in the article, I considered the following items capital actually employed:
- Working capital, including payables, receivables, inventory. These are the capitals required for the daily operation of their businesses.
- Gross Property, Plant, and Equipment. These are the capitals required to actually conduct business and manufacture their products.
- Research and development expenses (an essential expense for a business like META).
Based on the above considerations, META’s ROCE over the past 10 years is shown below. As can be seen, its ROCE was at an impressively high level from 2014 to 2017, hovering between 80% to 90%. Then as competition intensified and growth slowed, its ROCE declined to the current level of around 55%. All told, its long-term average ROCE is 68%. And in tandem with its ROCE decline in recent years, its valuation plummeted. However, the way I see it, the market overacted to its ROCE decline. To put things in perspective, the ROCE of the FAAMG group is roughly 50%~60% in recent years. And a 68% average ROCE is nothing to be sneered at.
Source: author and Seeking Alpha.
Next, let’s look at its reinvestment rate. The next table summarizes my analysis of how META has been allocating its organic earnings (approximated by its OPC, operating cash) in the recent 3 years. Its largest use of OPC has been share repurchases, on average with 31.8% of the OPC. Also note that its maintenance CAPEX is quite low, only 15.1% of its OPC. All told, my analysis shows that its reinvestment rates have been on average 21.0% in recent years. A 21% reinvestment rate is fairly high among mega-caps such as the FAAMG group (whose average reinvestment rate is around 10%). And a large part of META’s high reinvestment rates is driven by its aggressive bets on various metaverse initiatives.
Source: author and Seeking Alpha data.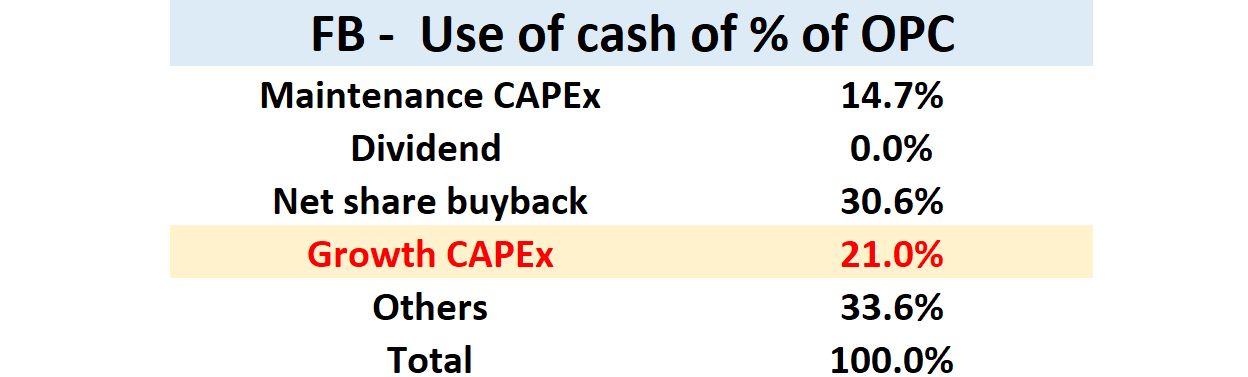
With the combination of a 68% ROCE and 21.0% reinvestment rate, it can maintain an annual growth rate of 14.3% organically (68% ROCE * 21.0% reinvestment rate = 14.3%). Of course, META most likely would not be able to maintain 21% reinvestment rates for the long run and will dial back at some point. However, even with an average 10% reinvestment rate like other mega-caps, its long-term growth rate would be still 6.8% (68% ROCE * 10% reinvestment rate = 6.8%). The actual growth rate ought to be somewhere in between, as reflected in the following consensus estimates. As you can see from the following chart, the consensus estimates are projection an ESP growth from $9.71 in 2022 to $14.43 in 2027, translating into a CAGR of 8.2%.
Source: author and Seeking Alpha data.
Long-Term Return
So now let’s see what our return potentials would be if we get to be long-term holders with an entry price near $122 if the put option is exercised upon us. As also detailed in my blog article, our long-term return on investment (“ROI”) is simply the sum of two parts: the owner’s earning yield when we made the investment (“OEY”), and the long-term growth rate (“LTR”) we just estimated above. That is:
Longer-Term ROI = OEY + PGR
For the OEY, I will just use its EPS as a crude and also a conservative metric for the owner’s earnings. It is conservative in the sense that the owner’s earnings should be EPS plus the portion of growth CAPEx). Its consensus estimate EPS is $9.71 as aforementioned. At an entry price around $122, the OEY is ~7.96% ($9.71/$122 = 7.96%, or equivalent to a 12.56x PE). With this, the next chart puts both pieces together and shows my return projections. The key takeaways are:
- At the current reinvestment rate level of 21%, the total return potential would be over 20% per annum (22.2% to be more exact), consisting of 14.3% of growth and 7.9% OEY as aforementioned.
- In the case of a normalized reinvestment rate of 10%, the total return potential would still be nearly 15% per annum, consisting of 6.8% of growth and 7.9% OEY.
Source: author and Seeking Alpha data.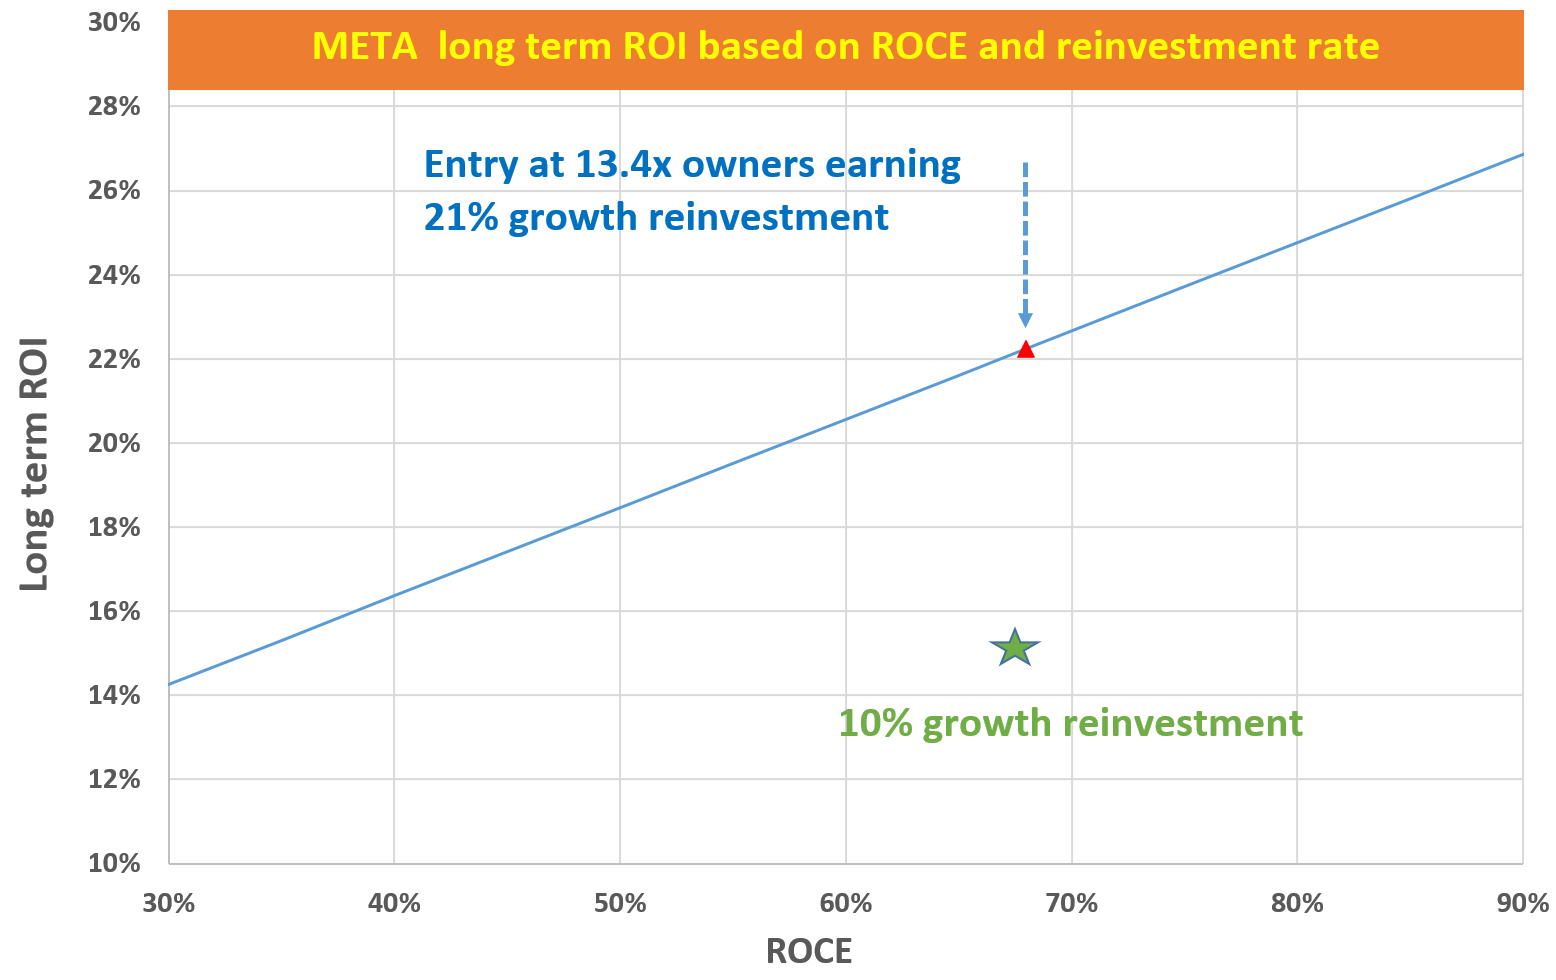
Risks and final thoughts
There are plenty of risks surrounding META in the near-term ranging from macroeconomic factors (such as inflation and geopolitical risks) and also company-specific risks such as competition and regulatory risks. These risks have been eloquently discussed by other SA authors already and I wouldn’t repeat them here anymore.
Instead, let me just say a few words about the use of options itself, particularly the writing option strategy mentioned in this article. At least in theory, there is always a risk that the stock price goes to zero, but you still have to buy the shares at $122 if you write puts. Also, the writing strategy I mentioned here is based on the assumption that you write COVERED options. If you write uncovered (aka naked) options, then your risk/return calculus would change depending on the specific terms of trades (like the margin rates et al).
To conclude, investors’ nervousness about META’s near-term issues and its incoming ER has caused immense surges in its implied volatility. Currently, its IV is only close to its 52-week peak but has already diverged substantially from 30-day historical volatility. In particular, its near-the-money put option with Oct 28, 2022 expiry now offers an opportunity to buy the shares at $122 or get paid 6.4% in one week. Such an opportunity should be attractive both for short-term traders (to earn 6.4% in one week) and also long-term holders (with potential returns projected in the 15% to 20%+).
Be the first to comment