

skynesher/E+ via Getty Images
Investment summary
Whilst the market continues to price in a wave of macroeconomic crosscurrents, it is becoming more than just factors of low volatility and ‘quality’ that are driving equity returns. Investors are looking to bottom-line fundamentals, and shying away from top-line growth. Alas, here I’ve examined Mesa Laboratories, Inc. (NASDAQ:MLAB) in tandem with findings from our research team and found that shares look to be overpriced, and that further downside could be likely. This is coupled with weakening bottom-line fundamentals and profitability, factors that are unattractive in the current climate. I rate MLAB a hold with a $157 valuation.
Headwind: Return on investment trends tightening
I wanted to get a good feel of MLAB’s corporate value to see what we’d be buying into here. This can typically be derived by examining return on invested capital (”ROIC”) and earnings trends, and comparing these to expectations. Here I wanted to see how much quarterly NOPAT was generated from last period’s investments. As noted in Exhibit 2, ROIC has been narrowing on both a sequential and TTM basis for MLAB, to -50bps in Q1 FY23 – its lowest mark since Q4 FY16.
Meanwhile, the level of investment has increased substantially over this period, particularly from late FY19, and again in Q3 FY21 with the acquisition of Agena Bioscience, Inc. The transaction was on a total consideration of ~$300 million (“mm”), although c.$135.8mm of this was booked as goodwill [non-cash, non-amortizable asset].
Nevertheless, the narrowing ROIC is a key risk in the investment debate, as it marks down MLAB’s corporate value, by estimation. As ideally, we’d prefer to see either high, steady, or increasing return from investment – not declining returns on a widening capital load. This suggests capital intensity is potentially high for the company as well, although, this is offset by the large intangibles load on the balance sheet. From CAPEX of $17mm for the quarter was 35% of revenue, and roughly 63% of TTM cash from operations.
Exhibit 1. Quarterly and TTM return on investment continues to tighten for MLAB despite the level of invested capital lifting sequentially.
This presents as a key risk looking ahead. With a weakening economic outlook, I believe positioning against companies generating cash from investments made above the cost of capital. MLAB misses the hurdle here.
- ROIC; Return on Invested Capital – % TTM – Right Hand Side
- Invested capital – Left Hand Side
- ROIC reached a high of 12.3% for the company in mid-late FY18; corresponding with an all-time high in the MLAB share price at the time. Recently, there’s been a divergence in market value to profitability.
Note: All figures are in $mm or [%]. All calculations utilize GAAP earnings with no reconciliations. (Image: HB Insights. Data: MLAB SEC Filings)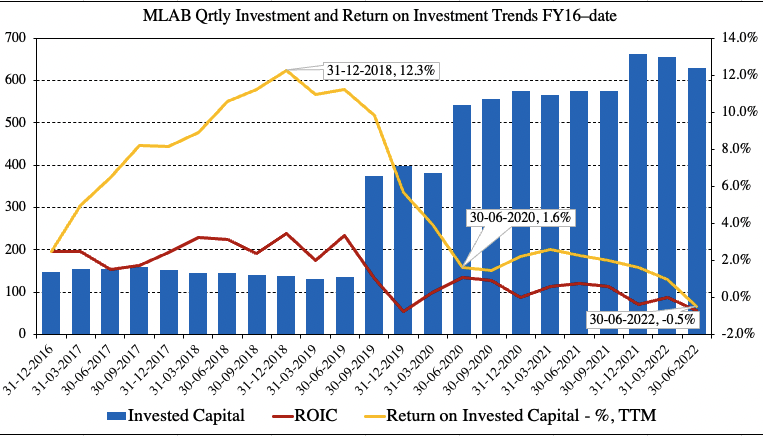
Earnings balance investment debate
The other measure of corporate value is earnings, what’s real and what’s expected. MLAB’s latest numbers were strong year on year however missed consensus estimates at the top and bottom line. Revenue of $50.45mm was up 44.5% YoY, whereas cost on these revenues (“COR”) lifted 50% or $6.4mm to $19mm for the 3 months, however, COR margin only saw ~130bps of gain from Q1 FY22.
Top-line growth was underscored by the clinical genomics and sterilization & disinfection (”S&D”) control segments. Each attributed 29% of turnover to stated revenue, printing $14.5mm and $14.77mm [~$2.70/share each] respectively. Growth in clinical genomics was hampered by strict Covid-related lockdowns during the period. The volume miss from China is a potential concern, but I believe it is likely to revert back towards the mean. Meanwhile, the biopharmaceutical and development business gained 24% YoY to $10.9mm [$0.20/share] underlined by sales momentum in consumables and services.
Management note it realized some cost pass through in this segment during the quarter as well. In fact, the company saw gross margin upsides in biopharmaceutical development [65% from 53%] but saw 200bps downside in S&D and 100bps calibration solutions to 73% and 55% respectively.
As seen in Exhibit 2, quarterly operating metrics have also tightened for MLAB since Q4 FY21, with operating profit and FCF slipping into the red. Note that FCF yield has also continued to snake lower and rests at its lowest mark since FY17, but has hovered between 2-3% since FY19. The softer bottom-line fundamentals wouldn’t be an issue for MLAB if it were seeing decent ROIC to replenish expenditure. However, as demonstrated, above, this isn’t the case, and weakens the valuation further by my estimation.
Exhibit 2. Bottom-line fundamentals have softened in recent quarters but realized FCF yields have been narrowing for several years, despite ROIC also decreasing in this time.
Weaker and even negative FCF yields aren’t necessarily a problem if the company is generating sufficient return on its investments that outpaces the cost of capital. We don’t see this with MLAB at this point in time.
Note: All figures are in $mm or [%]. Free cash flow calculated as [NOPAT + D – Investments] before dividends. All calculations are GAAP figures with no reconciliations. FCF Yield is calculated as TTM per quarter and as a function of enterprise value at date of earnings release (Image: HB Insights. Data: MLAB SES Filings)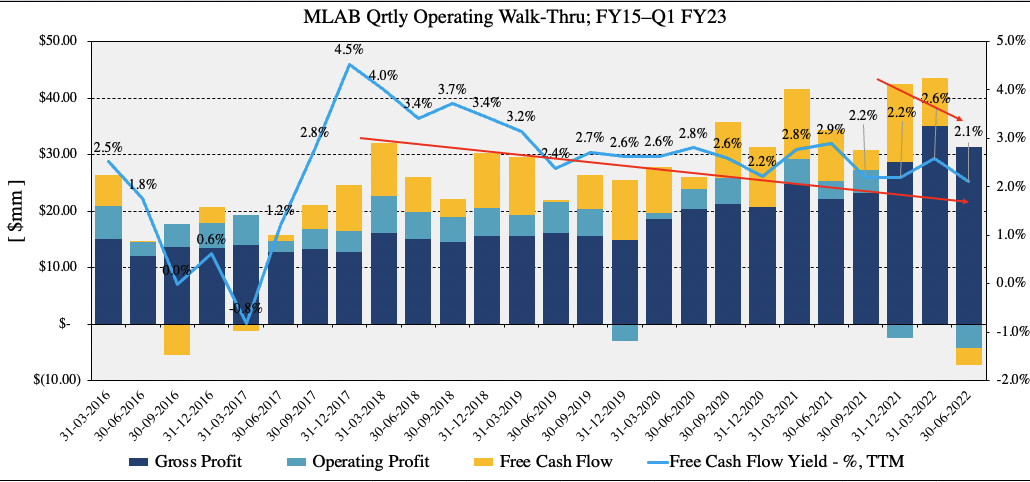
One key finding from my examination is that inventory appears to lead the company’s market capitalization and enterprise value (“EV”), as seen in Exhibit 3. This relationship has also softened at the back end of the pandemic, however, this is interesting data to think about. Inventories increased c.9.2% YoY to $26.8mm, with clinical genomics recognizing the largest gain segmentally, and it will be prudent to track inventory value into the coming periods to understand how the company’s customers/distributors are repurchasing and refilling their own inventory counts, as a signal for end-market demand.
Exhibit 3. Inventory value and turnover will be key numbers to gauge looking ahead to understand how customers/distributors are repurchasing their own stockpiles
Note: Inventory recorded at end of quarter. All figures are in $mm or times [ ‘x’ ] for inventory turnover. Market capitalization and enterprise value recorded at end of each respective quarter (Image: HB Insights. Data: MLAB SEC Filings)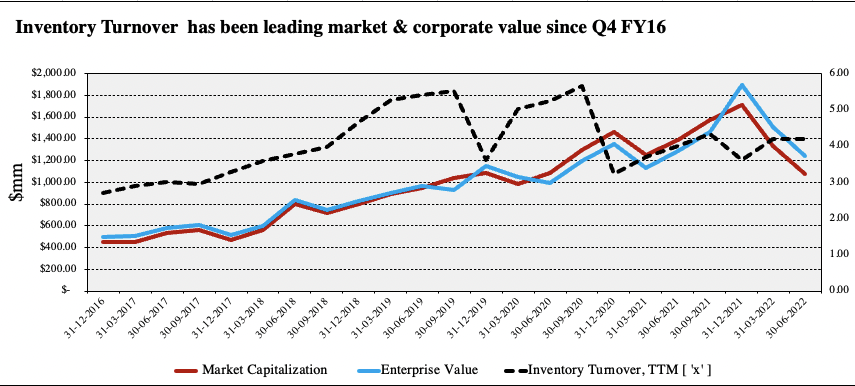
Valuation and conclusion
Shares are trading at 30x TTM EV/EBITDA and are priced at 4.2x sales, a premium and discount to the GICS health care peer group respectively. Shares also appear to be richly priced as 32x cash flow and 2.2x book value. Our research team has forecast FY23 EBITDA of $46mm and FCF of $38mm, putting shares at an 18x and 22x forward multiples on these, respectively.
Assigning these multiples to the forward EBITDA and FCF estimates sets price targets of $156 and $157 respectively, around 3% downside at the time of writing.
These and the above factors in mind, we are comfortable sitting on the sidelines in this name and believe it warrants a hold recommendation in the current investment climate. Rate hold on $157 valuation.
Be the first to comment