


Vertigo3d
A sharp fall in mortgage banking activity will hurt the earnings of Merchants Bancorp (NASDAQ:MBIN) this year. On the other hand, strong loan growth will likely support the bottom line. Further, earnings will benefit from the rising rate environment as most loans are based on variable rates. Overall, I’m expecting Merchants Bancorp to report earnings of $189 million for 2022, down 8% year-over-year. For 2023, I’m expecting earnings to grow by 10%. The year-end target price suggests a moderately high upside from the current market price. Therefore, I’m adopting a buy rating on Merchants Bancorp.
The Slowdown In Mortgage Industry To Have A Sizable Impact On Earnings
Gains on sales of mortgage loans fell by 26% year-over-year during the first half of 2022. This fall was greater than previously anticipated because the rate up-cycle has been more extreme than expected so far this year. The high borrowing costs have not only slashed mortgage refinancing activity, but it has also hurt purchase activity. The Mortgage Bankers Association has revised downwards its expectations for the mortgage market over the last six months, as shown below.
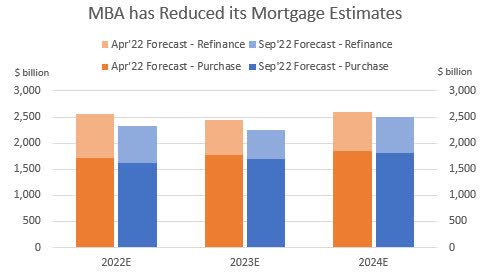
Mortgage Bankers Association
Mortgage banking income is a big component of total revenues for Merchants Bancorp, as shown below.
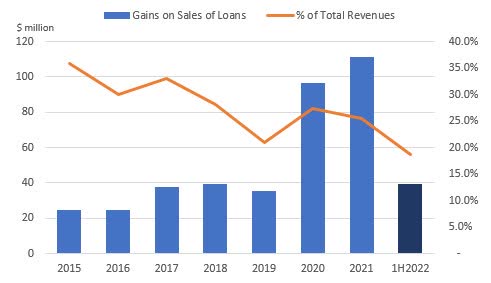
SEC Filings
As a result, the fall in mortgage banking income will deal a heavy blow to earnings this year. Meanwhile, the other fee income will likely grow at a normal rate. Overall, I’m expecting the non-interest income to plunge by 21% year-over-year in 2022.
Loan Growth To Support Earnings
Merchants Bancorp’s loan portfolio grew by 17.7% in the second quarter, or 70.7% annualized, which is even higher than the already impressive historical average. The loan portfolio has actually grown at a compounded annual growth rate of 43% from 2017 to 2021. Similar loan growth is likely for 2022 mostly because of the second quarter’s performance.
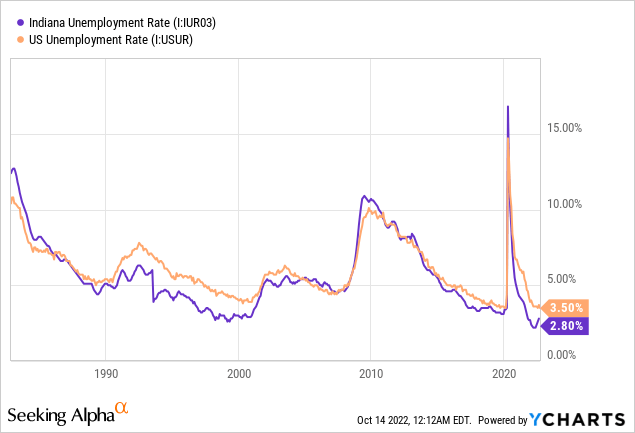
Additionally, strong job markets will support loan growth. Merchants Bancorp’s loans are concentrated in two segments: multifamily financing and healthcare financing. Out of these two segments, the demand for multifamily residential loans will depend on both population growth and unemployment rates (which shows the financial strength of the masses). Merchants Bancorp is focused on Indiana, but has a national reach. Therefore, both Indiana’s and USA’s unemployment rates should be considered while gauging credit demand. As shown below, both unemployment rates are currently at record lows.
Meanwhile, demand for healthcare loans is likely to remain inelastic. Overall, I’m expecting the loan portfolio to grow by 8% every quarter till the end of 2023. Meanwhile, I’m expecting deposits to grow in line with loans. The following table shows my balance sheet estimates. Please note that the per-share data for previous years does not reflect the share split in early 2022.
| FY18 | FY19 | FY20 | FY21 | FY22E | FY23E | |
| Financial Position | ||||||
| Net Loans | 2,045 | 3,012 | 5,508 | 5,751 | 8,204 | 11,161 |
| Growth of Net Loans | 49.7% | 47.3% | 82.8% | 4.4% | 42.6% | 36.0% |
| Other Earning Assets | 1,644 | 3,153 | 3,855 | 5,237 | 3,859 | 3,937 |
| Deposits | 3,231 | 5,478 | 7,408 | 8,983 | 9,502 | 12,456 |
| Borrowings and Sub-Debt | 195 | 181 | 1,348 | 1,034 | 1,499 | 1,529 |
| Common equity | 380 | 441 | 598 | 793 | 957 | 1,152 |
| Book Value Per Share ($) | 13.2 | 15.3 | 20.8 | 27.5 | 22.1 | 26.6 |
| Tangible BVPS ($) | 12.5 | 14.7 | 20.1 | 26.9 | 21.7 | 26.2 |
| Source: SEC Filings, Earnings Releases, Author’s Estimates(In USD million unless otherwise specified) | ||||||
Margin Is Highly Rate-Sensitive As Most Loans Are Based On Variable Rates
Merchants Bancorp’s loan book is highly rate-sensitive. Both multifamily financing and healthcare financing loans, which together make up 64% of total loans, carry a base rate of SOFR that adjusts on a monthly basis, as mentioned in the latest 10-Q filing. Other loan classes are also based on variable rates, with sometimes longer repricing timeframes. Only loans in the Agricultural segment (1.3% of total loans) have fixed rates.
Unfortunately, the deposit book is also heavy on variable-rate products. Interest-bearing checking, savings, and money market accounts altogether made up an overwhelming 86.6% of total deposits during the second quarter of 2022. However, the management was confident it could keep down deposit costs as rates rise. According to the results of the management’s rate-sensitivity analysis given in the 10-Q filing, a 200-basis point hike in interest rates can boost the net interest income by 20.9% over twelve months.
Considering these factors, I’m expecting the margin to grow by 25 basis points in the second half of 2022 and by a further 10 basis points in 2023.
Expecting Earnings To Dip By 8% In 2022 Before Recovering Next Year
The anticipated drop in mortgage banking income will be the biggest contributor to an earnings decline this year. On the other hand, strong loan growth will support earnings through the end of 2023. Further, significant margin expansion will lift earnings. Overall, I’m expecting Merchants Bancorp to report earnings of $189 million for 2022, down 8% year-over-year. For 2023, I’m expecting earnings to grow by 10%. The following table shows my income statement estimates. For the per-share data given below, please note that Merchants Bancorp split its shares outstanding in early 2022. I have not adjusted previous years’ per-share figures. Instead, the numbers below are as previously reported.
| FY18 | FY19 | FY20 | FY21 | FY22E | FY23E | |
| Income Statement | ||||||
| Net interest income | 90 | 122 | 224 | 278 | 315 | 433 |
| Provision for loan losses | 5 | 4 | 12 | 5 | 19 | 20 |
| Non-interest income | 50 | 47 | 127 | 157 | 124 | 75 |
| Non-interest expense | 51 | 63 | 96 | 125 | 136 | 175 |
| Net income – Common Sh. | 60 | 68 | 166 | 206 | 189 | 209 |
| EPS – Diluted ($) | 2.07 | 2.37 | 5.77 | 7.14 | 4.37 | 4.82 |
| Shares Outstanding (‘m) | 29 | 29 | 29 | 29 | 43 | 43 |
| Source: SEC Filings, Earnings Releases, Author’s Estimates (In USD million unless otherwise specified) | ||||||
Actual earnings may differ materially from estimates because of the risks and uncertainties related to inflation, and consequently the timing and magnitude of interest rate hikes. Further, a stronger or longer-than-anticipated recession can increase the provisioning for expected loan losses beyond my estimates.
Moderately High Price Upside Justifies A Buy Rating
Merchants Bancorp has increased its dividend every year since its IPO (adjusting for the stock split). Given the earnings outlook, I’m expecting the company to increase its dividend by $0.01 per share to $0.08 per share in the first quarter of 2023. The earnings and dividend estimates suggest a payout ratio of just 6.6% for 2023, which is close to the five-year average of 8.6%. Based on my dividend estimate, Merchants Bancorp is offering a forward dividend yield of 1.3%.
I’m using the historical price-to-tangible book (“P/TB”) and price-to-earnings (“P/E”) multiples to value Merchants Bancorp. The stock has traded at an average P/TB ratio of 0.93x in the past, as shown below.
| FY17 | FY18 | FY19 | FY20 | FY21 | Average | |
| T. Book Value per Share ($) | 14.2 | 12.5 | 14.7 | 20.1 | 26.9 | |
| Average Market Price ($) | 12.5 | 15.9 | 12.5 | 13.0 | 26.5 | |
| Historical P/TB | 0.88x | 1.27x | 0.86x | 0.65x | 0.99x | 0.93x |
| Source: Company Financials, Yahoo Finance, Author’s Estimates | ||||||
Multiplying the average P/TB multiple with the forecast tangible book value per share of $21.7 gives a target price of $20.1 for the end of 2022. This price target implies a 16.8% downside from the October 13 closing price. The following table shows the sensitivity of the target price to the P/TB ratio.
| P/TB Multiple | 0.83x | 0.88x | 0.93x | 0.98x | 1.03x |
| TBVPS – Dec 2022 ($) | 21.7 | 21.7 | 21.7 | 21.7 | 21.7 |
| Target Price ($) | 17.9 | 19.0 | 20.1 | 21.2 | 22.3 |
| Market Price ($) | 24.2 | 24.2 | 24.2 | 24.2 | 24.2 |
| Upside/(Downside) | (25.8)% | (21.3)% | (16.8)% | (12.3)% | (7.8)% |
| Source: Author’s Estimates |
The stock has traded at an average P/E ratio of around 7.8x in the past, as shown below.
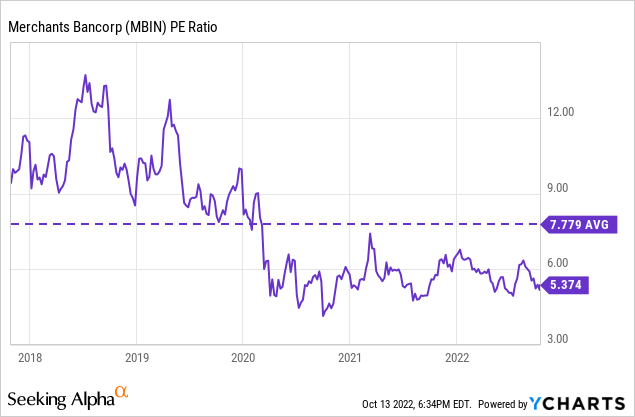
Multiplying the average P/E multiple with the forecast earnings per share of $4.37 gives a target price of $34.0 for the end of 2022. This price target implies a 40.7% upside from the October 13 closing price. The following table shows the sensitivity of the target price to the P/E ratio.
| P/E Multiple | 5.8x | 6.8x | 7.8x | 8.8x | 9.8x |
| EPS – 2022 ($) | 4.37 | 4.37 | 4.37 | 4.37 | 4.37 |
| Target Price ($) | 25.2 | 29.6 | 34.0 | 38.3 | 42.7 |
| Market Price ($) | 24.2 | 24.2 | 24.2 | 24.2 | 24.2 |
| Upside/(Downside) | 4.5% | 22.6% | 40.7% | 58.8% | 76.8% |
| Source: Author’s Estimates |
Equally weighting the target prices from the two valuation methods gives a combined target price of $27.0, which implies an 11.9% upside from the current market price. Adding the forward dividend yield gives a total expected return of 13.3%. Hence, I’m adopting a buy rating on Merchants Bancorp.
Be the first to comment