

Stanislau Kharytanovich/iStock via Getty Images
Thesis and Background
Both Medical Properties (NYSE:MPW) and Omega Healthcare (NYSE:OHI) are excellent candidates for an income account. They are also both excellent examples to illustrate the investment strategy of our newly launched marketplace service. So I thought it is a good idea to first provide a bit of background about ourselves and our strategy.
My family is in the final stage toward retirement (after about 15 years of work). Through our own personal journey, we learned the key to building and protecting wealth is to pursue growth and income with ISOLATED risks. Sadly, we’ve seen too many people around us make the tragic mistake of mixing growth with income generation, or even worse, focusing on growth before ensuring adequate income. That is why we urge our readers to ALWAYS build two portfolios (and also why we provide 2x such model portfolios in our service) – one for income in the short term and one for growth in the long term – the so-called barbell model.
Under this context, the remainder of this article will compare MPW and OHI to highlight the things we look for in a holding on the short-term end of the barbell – the end to generate current income to support withdrawal and survival. Specifically, we look for:
- Adequate and safe income. We are looking for a relatively high current yield that is safely covered by strong financials. Both MPW and OHI fit this criterion. OHI is currently yielding 8.9%+ and MPW 7%+. Both are yielding substantially above the overall equity market (about 1.4%), the bond markets (about 3%), and also their historical average (by 10% to 20%).
- Favorable odds for price appreciation. Specifically, we are looking for a margin of safety due to valuation or a catalyst in the near term. And you will also see this is one reason we favor MPW better later.
- Finally, we like to examine the sustainability of their dividends. For dividend stock, besides the usual payout ratios, we always go a step further to examine it under a broader context of cash position, debt, and sustainability of their profit. And you will see this is the second key reason why we favor MPW over OHI.
All told, MPW has delivered a total return of 238%, almost 50% above OHI, over the past ten years. And for the reasons mentioned above, I think MPW’s past outperformance is very likely to continue in the future, as we will detail immediately below.
Seeking Alpha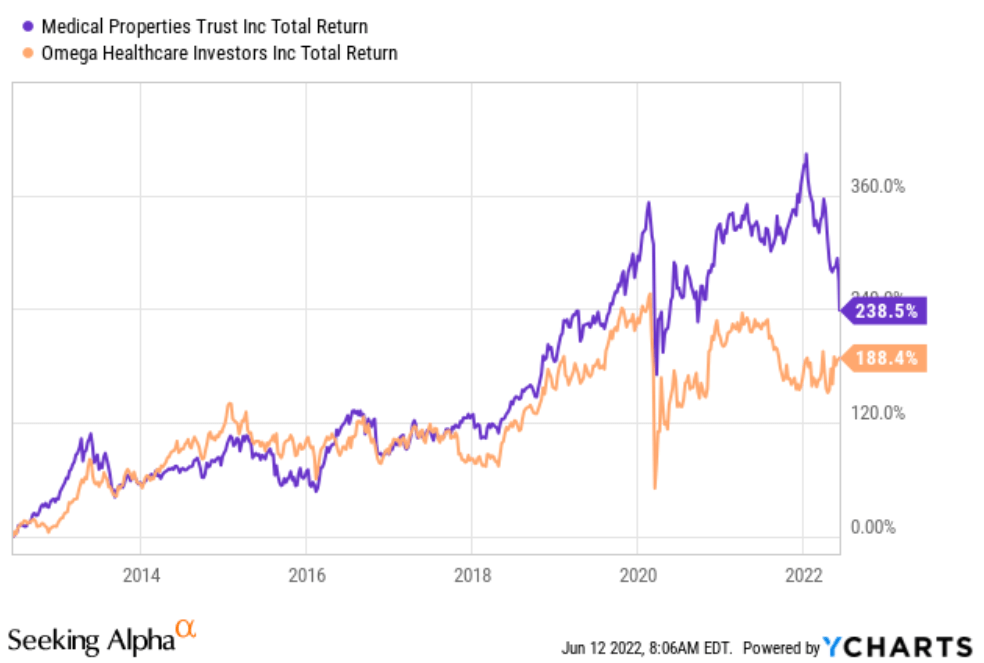
MPW and OHI – business fundamentals and outlook
Both MPW and OHI are specialty REITs in the general healthcare industry. MPW focuses on the acquisition and development of net-leased hospital facilities. OHI invests in the long-term healthcare industry, primarily in skilled nursing and assisted living facilities. A key reason we like both is the secular support from the aging population in the U.S. For a combination of factors (baby boomers, steadily improving life expectancy, et al), the portion of adults 65+ in our population is projected to increase by 44% in the next 20 years. Such megatrend will provide long-term tailwind for both MPW and OHI.
Both of them also share similar risks such as health insurance policy changes, government reimbursement policies, et al. The recent COVID pandemic provide an illustrative example of these risks, to be detailed later.
MPW vs OHI: dividend safety
Both MPW and OHI currently offer an attractive dividend yield of about 7.07% and 8.92%, respectively. And the dividends from both companies are supported by healthy profitability as you can see from the following chart. However, overall, MPW enjoys superior profitability. To cite a few key metrics, MPW enjoys a gross margin of 97.4%, almost 700 bps higher than OHI’s 90.6%. MPW also enjoys a much higher net margin of 69.4%, almost 1.6x higher than OHI’s 42.9%. Finally, MPW is also larger with a total of $802M cash from operations (about 18% more than OHI). A larger scale naturally adds more safety.
Seeking Alpha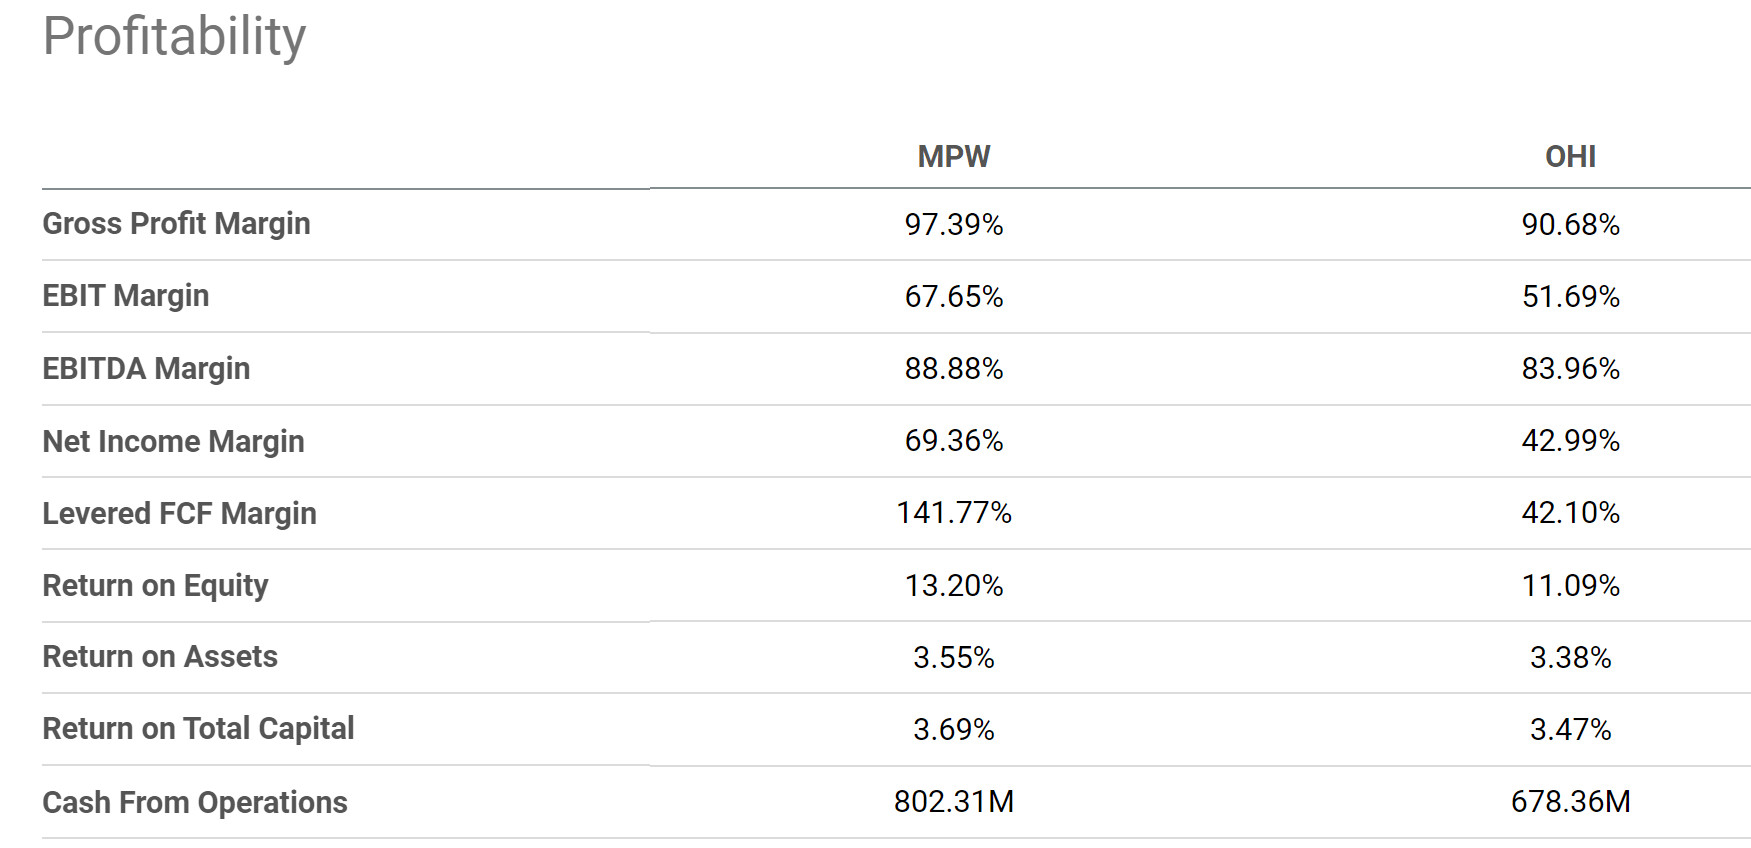
And for dividend investors, I am sure all of us know all the typical metrics to gauge dividend safety such as payout ratio in terms of earnings, payout ratio in terms of cash flow, et al. The following chart shows MPW and OHI’s payout ratio in terms of cash flow. As you can see here, MPW has been doing a more consistent and conservative job than OHI in managing the dividend payout. Its payout ratio is on average 87.7%, substantially lower than OHI’s 103%. Furthermore, you can see that OHI’s current payout ratio is essentially on par with its historical average (101.7% vs 103%), but MPW’s ratio is lower than its historical average by a good margin (79% vs 87.7%), adding extra safety in comparison.
Also note the differences in consistency, a key factor we look for. In MPW’s case, the payout ratio has fluctuated in a very narrow range between 90% to about 100% in the past decade. In comparison, OHI’s ratios fluctuated in a much wide range from about 87% all the way to above 140%. Such a comparison further corroborates MPW’s superior profitability discussed above.
Seeking Alpha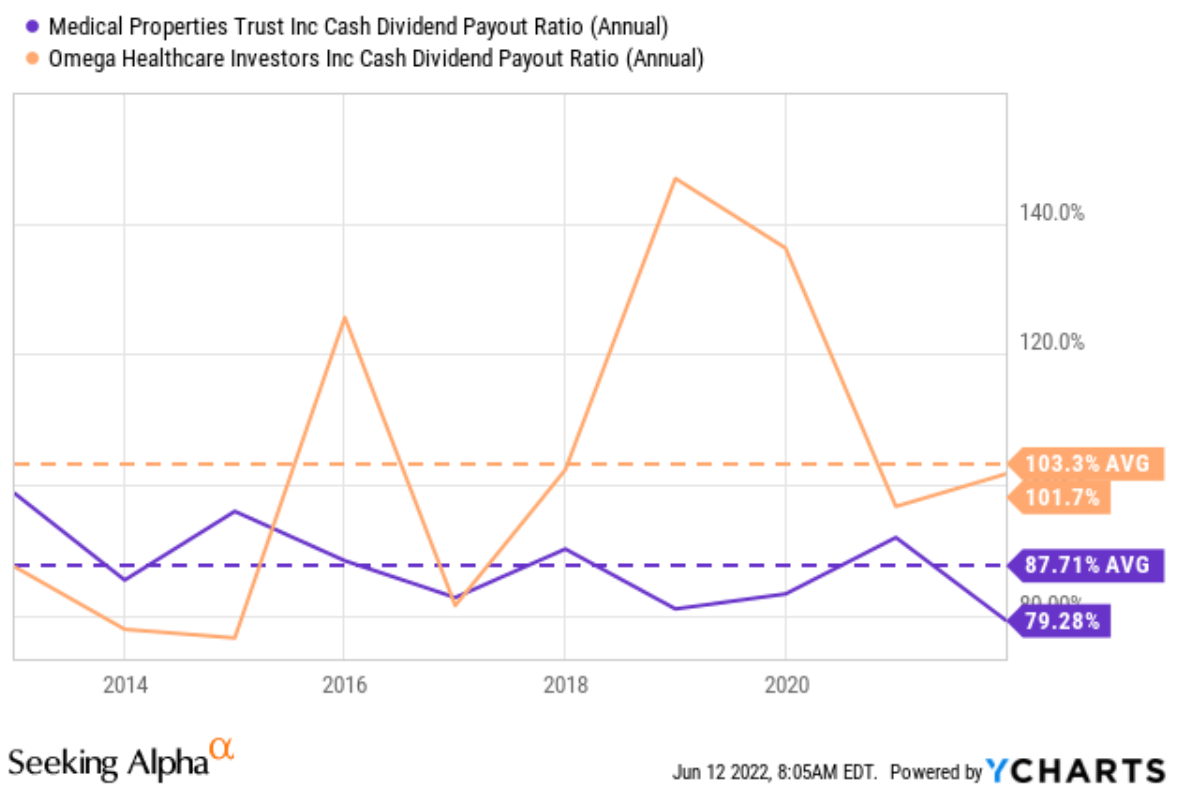
MPW vs OHI: dividend cushion ratios
The above pay-out ratios we commonly quote enjoy simplicity, and we like to go a step further for a more comprehensive assessment of dividend safety. As detailed in my earlier article here, the major limitations of the above simple payout ratios are twofold:
- The simple payout ratio ignores the current asset. Obviously, for two firms otherwise identical, the one with more cash on its balance sheet should have a higher level of dividend safety.
- The simple payout ratio also ignores the upcoming financial obligations. Again, obviously, for two firms otherwise identical, the one with lower obligations (debt, CAPEX expenses, et al) should have a higher level of dividend safety.
We find the dividend cushion ratio an effective tool to address the above issues. A detailed description can be found in Brian M Nelson’s book entitled Value Trap. And a summary is quoted below:
The Dividend Cushion measure is a ratio that sums the existing net cash (total cash less total long-term debt) a company has on hand (on its balance sheet) plus its expected future free cash flows (cash from operations less all capital expenditures) over the next five years and divides that sum by future expected cash dividends (including expected growth in them, where applicable) over the same time period. If the ratio is significantly above 1, the company generally has sufficient financial capacity to pay out its expected future dividends, by our estimates. The higher the ratio, the better, all else equal.
We made one revision to the above method here. Instead of subtracting the total long-term debt, we subtracted the total interest expenses over a past five-year period. This revision is to adjust for the status of businesses like BMY and ABBV. Such mature businesses probably will never have the need to repay all the debt at once. But it does need to service its debt.
With this background, the dividend cushion ratios for MPW and OHI are calculated and shown below. The following chart compares MPW and OHI dividend cushion ratios. As can be seen, MPW has been maintaining an average dividend cushion ratio of about 1.84x in the past 10 years, and OHI has been maintaining a lower cushion ratio of 1.04x. MPW is consistently above 1 by a good margin of 84%. OHI’s cushion ratio is at the threshold of 1 (which is a healthy sign), but we like the much thicker cushion MPW offers. A cushion ratio of 1.84 approximately means that MPW has enough cushion to maintain dividends and financial health even if their profits hit some speed bumps 2 years in a row.
Author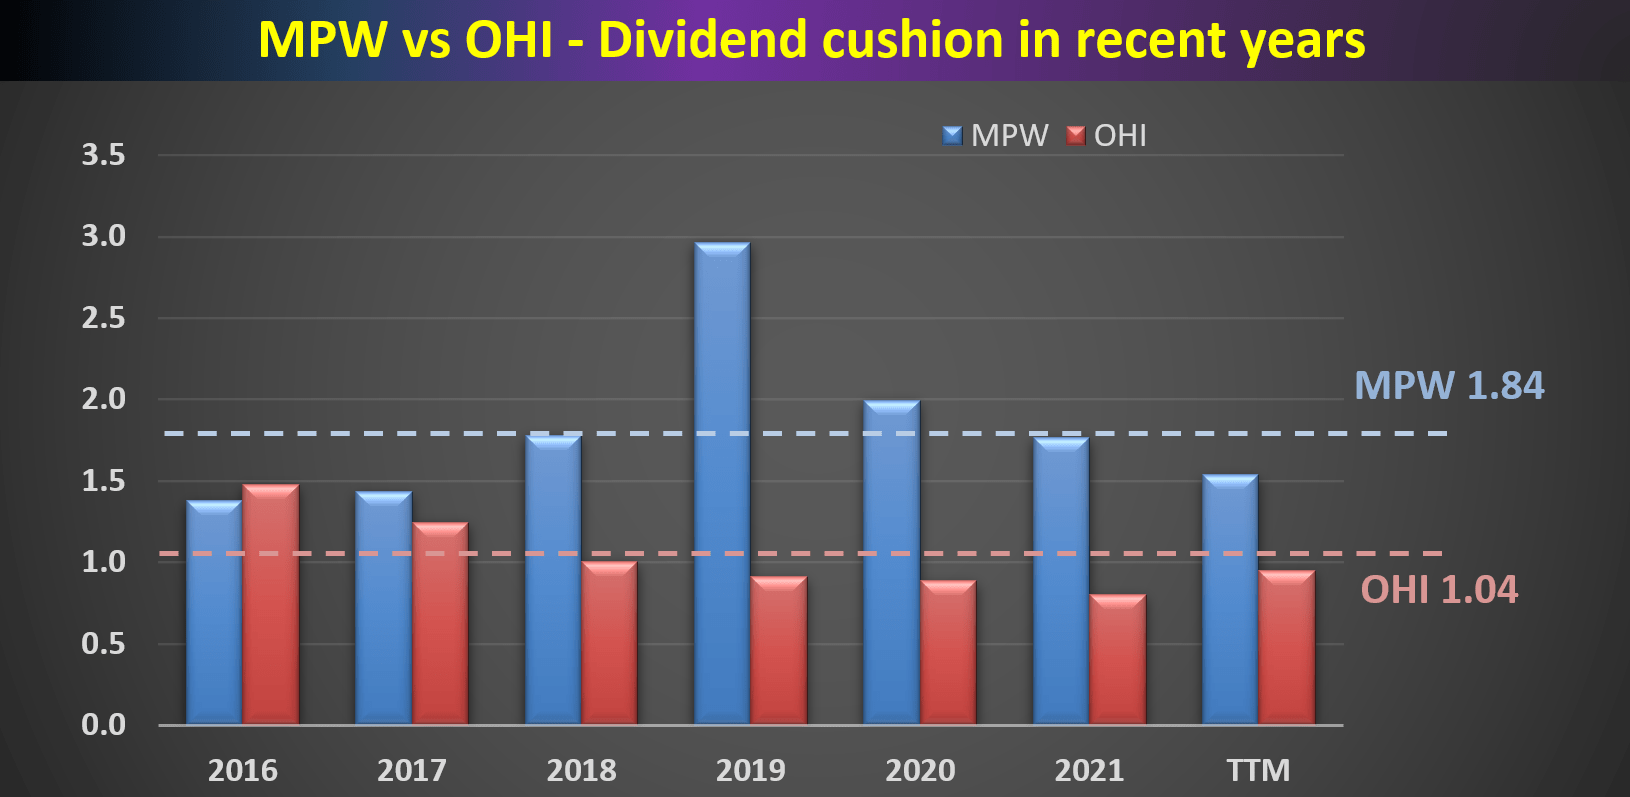
MPW vs OHI: Valuation
As can be seen from the following numbers in the table, at their current price levels, OHI and MPW are similarly valued despite the variance across different metrics. Let’s start with the most common metrics for REIT stocks, the price-to-cash-flow ratios. MPW is priced at 11.9x cash flow, about 14% above OHI. However, when leverages are adjusted for, the premium disappears and MPW is now valued at a relative discount. As can be seen, its TTM EV/EBITDA multiple is about 13.5x, about 5% lower than OHI’s 14.2x. In terms of PE multiples (less useful for REITs), these two stocks are also similarly valued with MPW at a slight discount (11.2x FY2 PE vs OHI’s 14.6x for example).
Seeking Alpha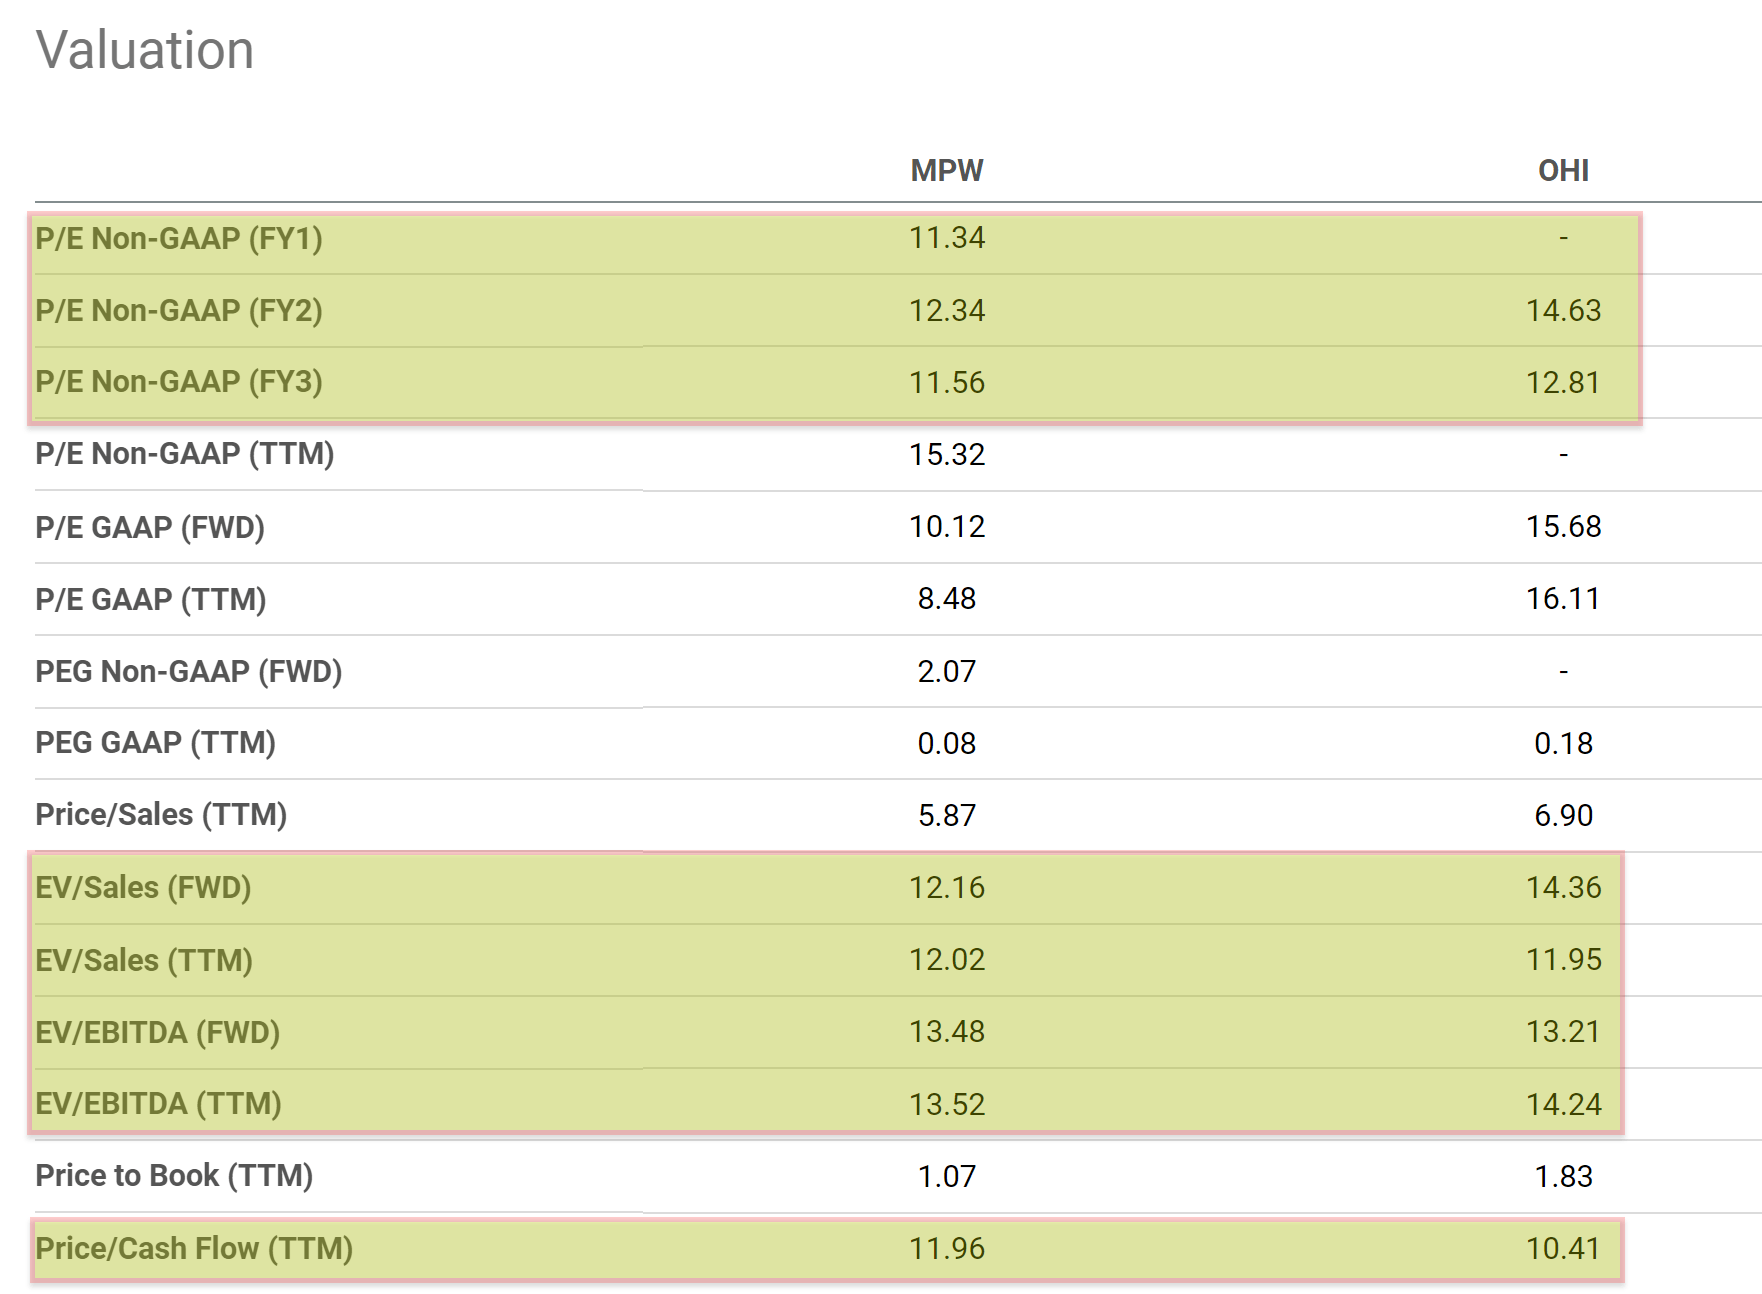
Now, what is more even more telling to me is the valuation relative to their own historical track record. As aforementioned, both are trading below their historical average valuations by 10% to 20%, which is a good sign that triggered my interest in the first place.
As you can see from the next chart, MP has been yielding on average 5.92% in the past ten years. And currently, it is yielding 7.07%, a 20% discount relative to its historical average. In OHI’s case, it has been yielding an average of 8.07% in the past ten years. And currently, it is yielding 8.92%. Therefore, it is at a 10% discount in terms of yield compared to its historical average.
So here we see a discount 2x larger from MPW than OHI, offering a much more substantial margin of safety.
Seeking Alpha
Conclusion and Risks
MPW and OHI are best examples to illustrate the barbell strategy we apply on our personal accounts and in our marketplace service. Both are excellent fits for the withdrawal end of the barbell. Both provide attractive current income (7% to 9%). Their dividends are protected by healthy profitability and secular support in the long term. Finally, both are reasonably valued and at a discount from their historical record.
Upon closer examination, we like MPW more. It offers a thicker dividend cushion (1.84x compared to OHI’s 1.04x), more consistent payout management, and better profitability metrics. Yet, they are similarly valued. MPW is actually at a discount when leverages are adjusted for. MPW’s TTM EV/EBITDA multiple is about 13.5x, about 5% lower than OHI’s 14.2x. MPW is at a 20% discount from its historical average, about 2x larger than OHI’s 10% discount, offering a much more substantial margin of safety.
Finally, investments in both MPW and OHI involve some other risks. As aforementioned, they face similar risks such as health insurance policy changes, government reimbursement policies, et al. I view the COVID situation as their largest risk presently. Both MPW and OHI have been impacted by the COVID pandemic in terms of rent collection, staff isolation, occupancy rates, staff shortage, et al. The COVID situation is not completely clear yet as MPW’s CEO Edward Aldag commented below (abridged and emphases added by me). These comments are from MPW, but I think they apply equally well to OHI.
Average occupancy was approximately 2.5 points ahead of where it was last year. Q1, 2022 is expected to be in line with expectations despite COVID-related self-isolation staffing issues. Personnel costs through February 2022 are below budget but 8% up year-over-year when compared to a significantly lower staffing level in Q1 2021.. Staffing pressures have been identified as a concern with personnel costs through February being up 4%, but year-over-year only 1% over budget.
Be the first to comment