

Kwarkot
Investment thesis
For those of you who have been landlords, you know that investing in REIT stocks shares many similarities with investing in physical properties. In this article, I will apply two lessons learned from my landlord experiences to Medical Properties Trust (NYSE:MPW). The first lesson is to never forget that the most dangerous four-letter word in real estate is debt. And the second lesson is that when you think you see a good bargain, seek independent assessments to make sure it is not a trap.
These lessons are very applicable to the current situation surrounding MPW. On the one hand, its valuation is at such an attractive level, and it seems to be a really good bargain. Its dividend yield is near its peak level in a decade. As you will see later also, it’s only trading at 8.1 times its FFO, almost a 40% discount from its historical average. But on the other hand, its long-term debt is at a record level of $11.3 billion, almost doubled from its pre-pandemic level. And the borrowing rates are on the climb. At the same time, it faces several operation challenges due to COVID-related self-isolation staffing issues, personnel costs, and occupancy rates.
Thus, the focus of this article is to examine its debt closely and also seek independent assessments of its valuation. You will see that its debt is admitted high in absolute terms, but it is not that alarming when put under historical perspective. In terms of valuation, you will see that it is attractive in terms of FFO multiples as just mentioned. From an independent perspective, its current valuation also leaves a large margin of safety when evaluated by a dividend discount analysis.
Seeking Alpha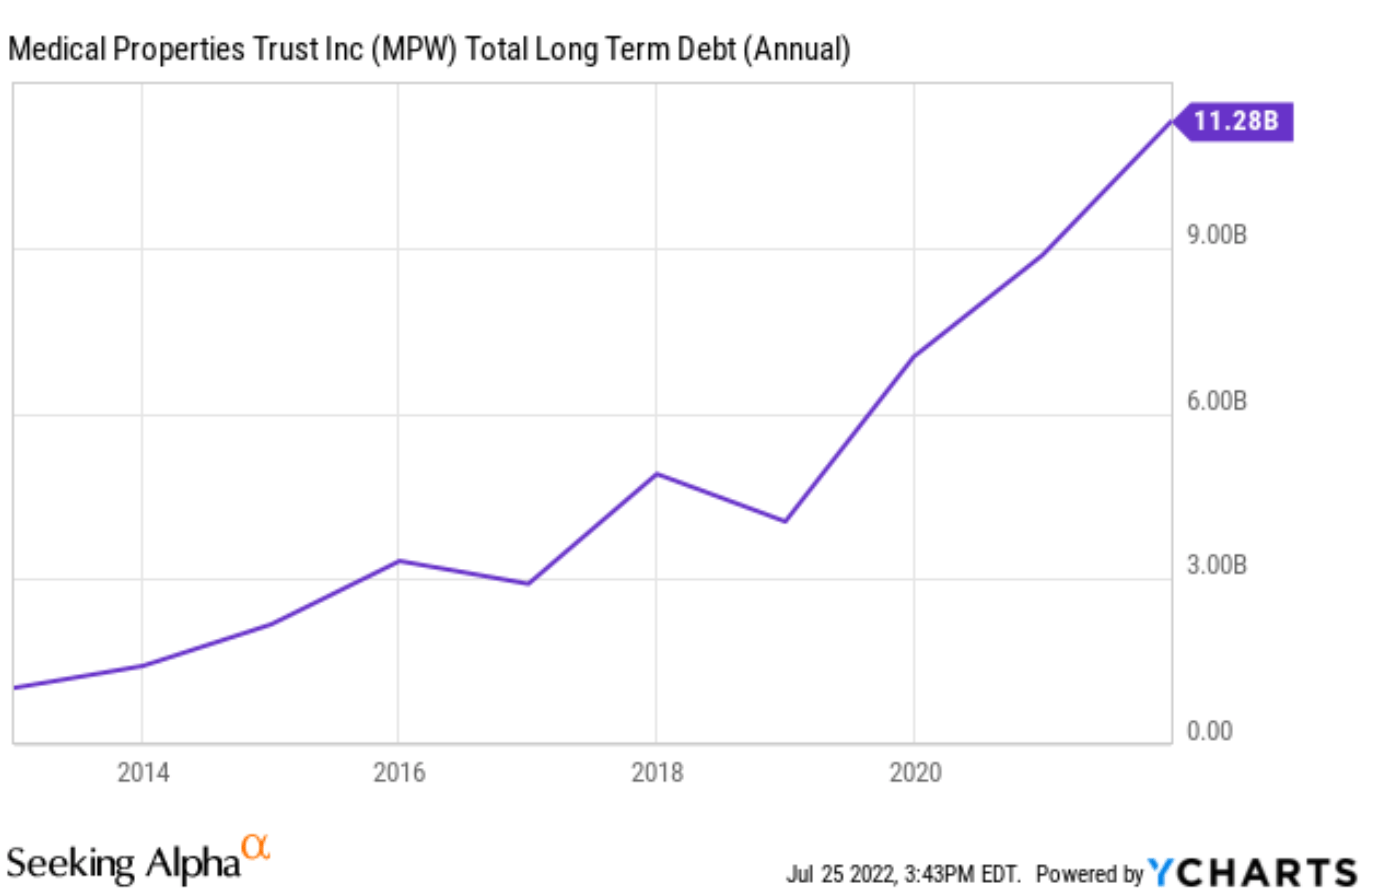
Stable capital structure
Let’s address the debt issue first. The following table shows the capital structure of MPW in the past 10 years. A few key observations here. Firstly, the cost of the debt has been steadily decreasing over the past decade from 5.7% in 2012 to the current level of 3.7%, a decline of more than 35%. As a result, with everything else being equal, the business could take on 35% more debt today without additional difficulty to service compared to 2012. Secondly, thanks to its growing book value and stock price appreciation, its capital structure has actually been very stable and consistent. In terms of equity/EV ratio, it has been fluctuating in a stable range between 60% to 43%, and the current ratio of 53% is totally within the normal range. The Debt/EV ratio paints the same picture.
Author based on Seeking Alpha data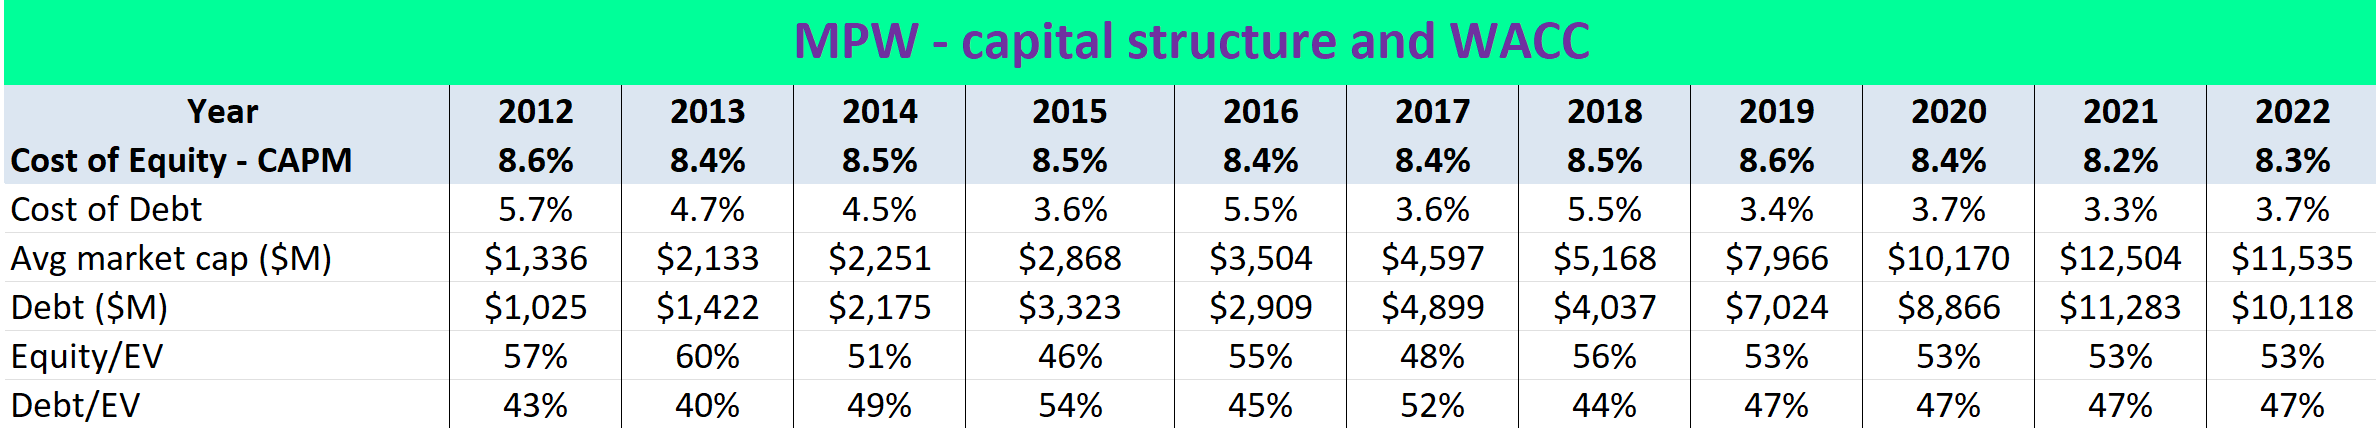
Cost of capital vs. return on capital
This section evaluates its profitability by comparing its cost of capital to its return on capital. This analysis uses the Weighted Average Cost of Capital (“WACC”) to evaluate the cost of capital. As detailed in our earlier article here:
The WACC is calculated as:
WACC = portion of equity * cost of equity + portion of debt * cost of debt * (1- tax rate)
We already have all the inputs above for the WACC calculation from the capital structure evaluation. So the next chart directly shows the WACC results. Note that the cost of equity is calculated using the Capital Asset Pricing Model (“CAPM”), considering the volatility of the stock (the beta) and the risk-free return (the 10-year treasury bond yield).
As seen, the cost of equity for MPW has been quite stable at around an average of 6.4% in the past decade. It is substantially lower than the typical range of 8-10% commonly quoted, both due to its lower volatility and relatively lower borrowing cost. Also, MPW’s WACC has been quite stable also and only fluctuated from 5.7% to 7.3% over the past decade.
Author based on Seeking Alpha data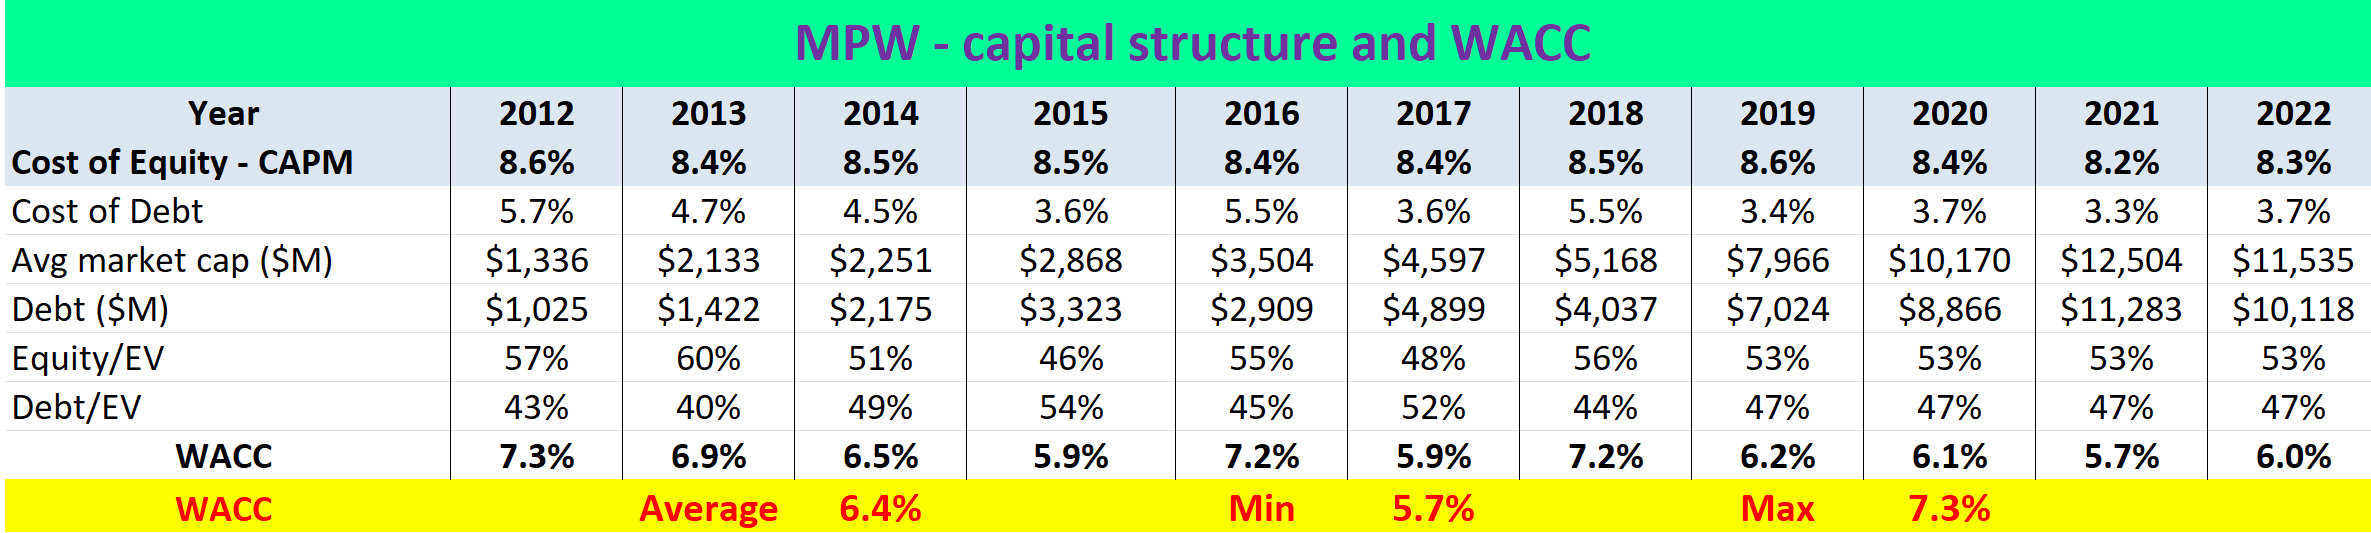
The next chart compares its WACC against its return on equity (“ROE”). As you can see, its ROE has also been quite stable, a hallmark of a business with a stable moat. The ROE has fluctuated in a relatively narrow range (when the outlier data point in 2019 is ignored) between about 6% to 10% with an average of 9.11% in the past 10 years. Its current ROE of 8.32% is again squarely within the normal range.
Thus, MPW’s ROE has been on average higher than its average WACC of 6.4% by a consistent and healthy margin of about 2.5%. WACC is the hurdle rate of return, and this comparison shows that WPW can sustainably earn a healthy return on capital raised.
After checking its debt and profitability, next, we will assess its valuation by two independent approaches.
Seeking Alpha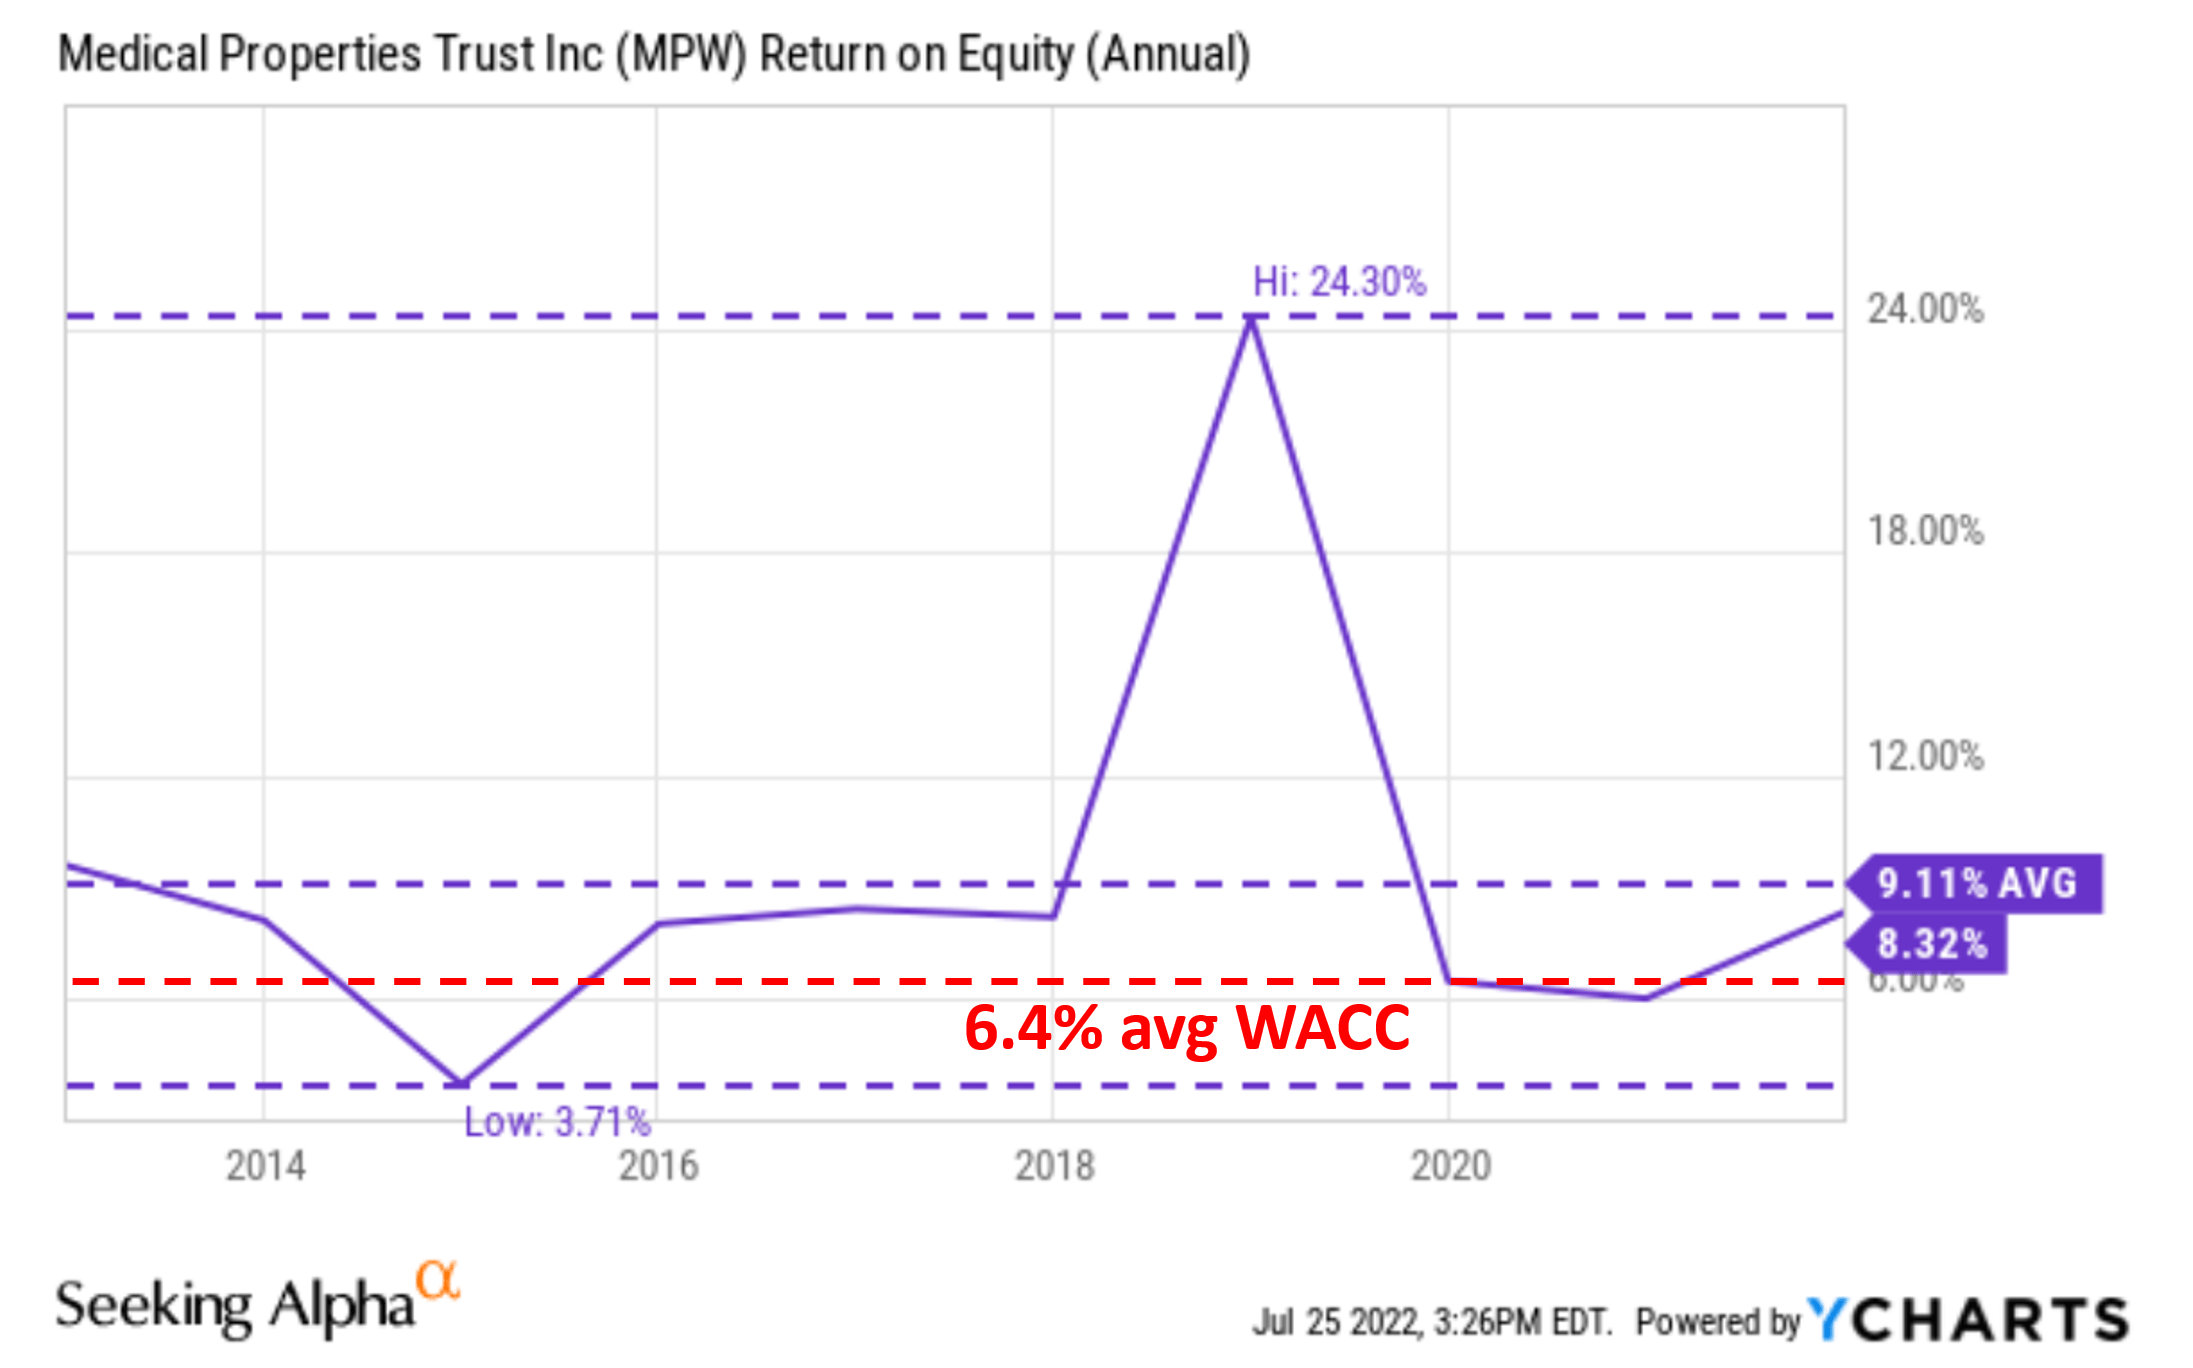
Assessment 1: FFO valuation
First, we will look at the FFO multiples. The stock has exhibited quite a bit of volatility and its FFO multiple has varied from as low as 4.6x to as high as 23x in the past decade, a swing of almost five-fold. Although when short-term volatilities are ignored, MPW has been on average valued at 13.2x historically as you can see from the chart below.
The stock is currently valued at about 8.14x FFO, a whopping discount of almost 40% compared to its historical average.
Seeking Alpha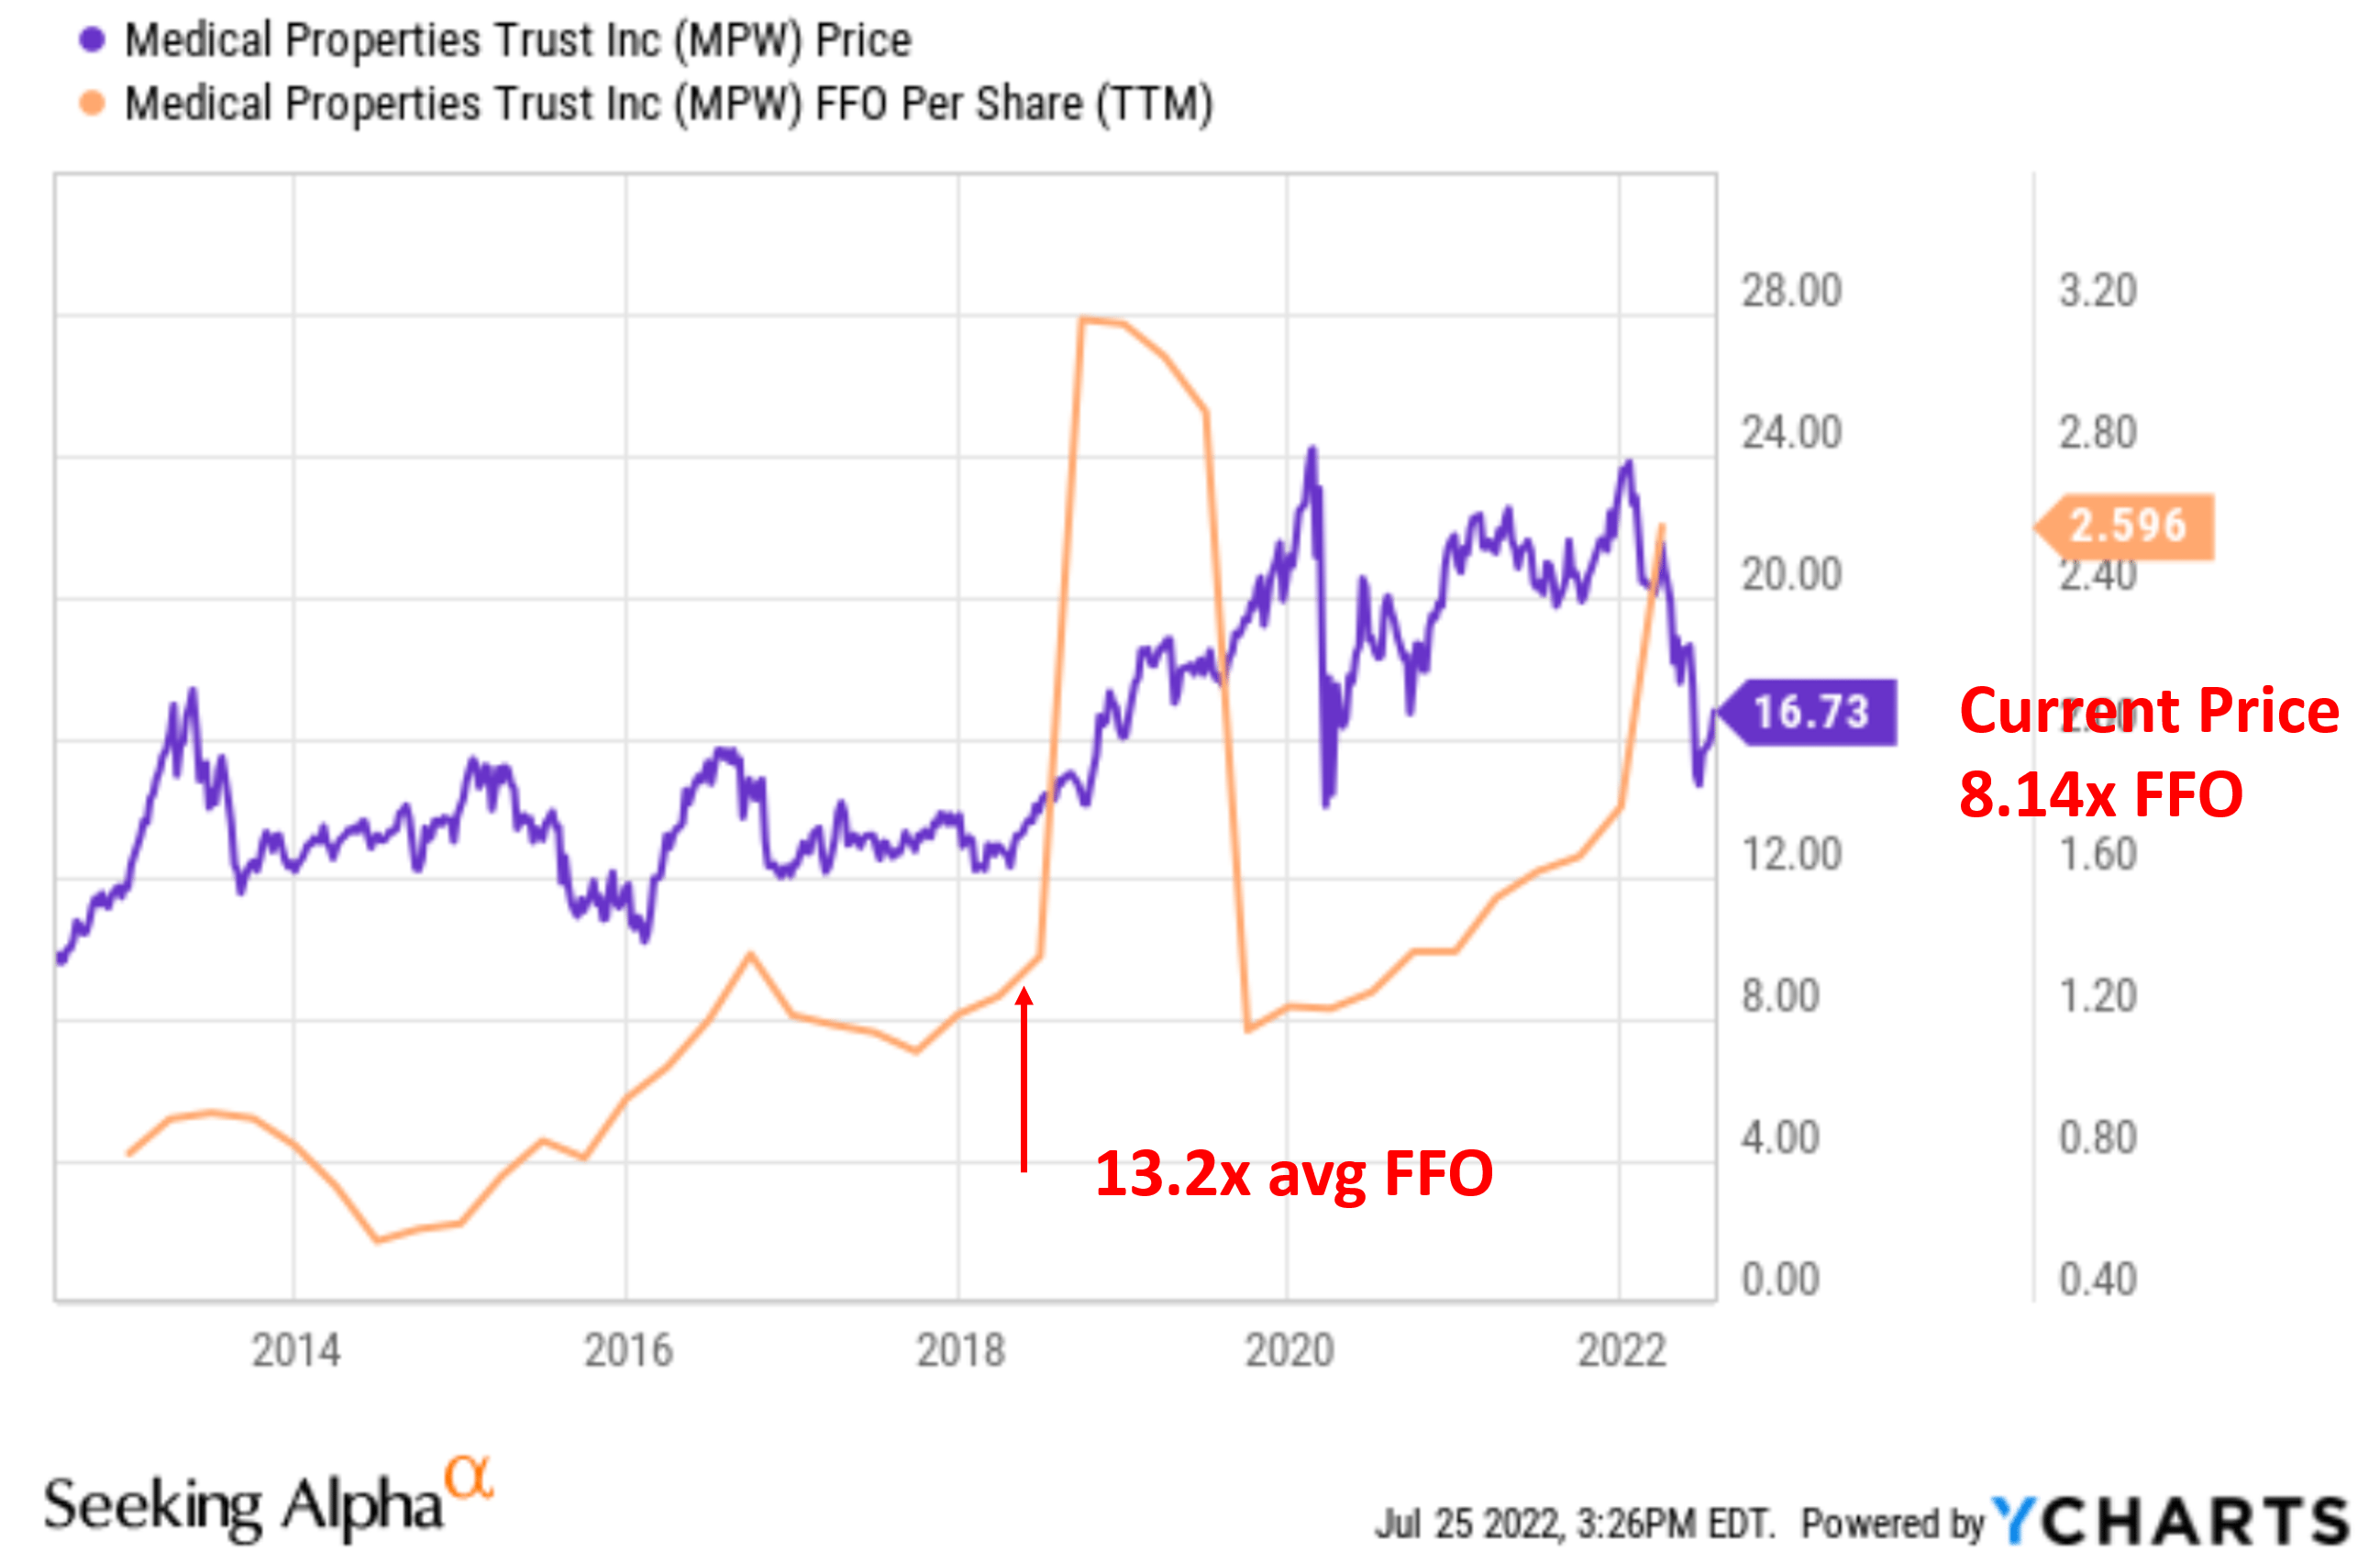
Assessment 2: Dividend discount model
Next, I will apply the discounted dividend model (“DDM”) to MPW, given its stable dividends. Details of the DDM are again in our earlier article here. And I will just point out the following assumption:
And this analysis uses the WACC as the discount rate because WACC is the minimum required return that a business needs to make to overcome the cost of capital. Therefore, it is the minimum rate that future earnings should be discounted.
With the above understanding, the DDM calculations for MPW are shown below. These calculations considered different combinations of A) WACC ranging from 6% to 8.5% based on our discussions above, and B) terminal dividend growth rate (“DGR”) ranging from 1.0 to 4.0%. The most probable scenarios are those in the middle, highlighted with red. The key observations are:
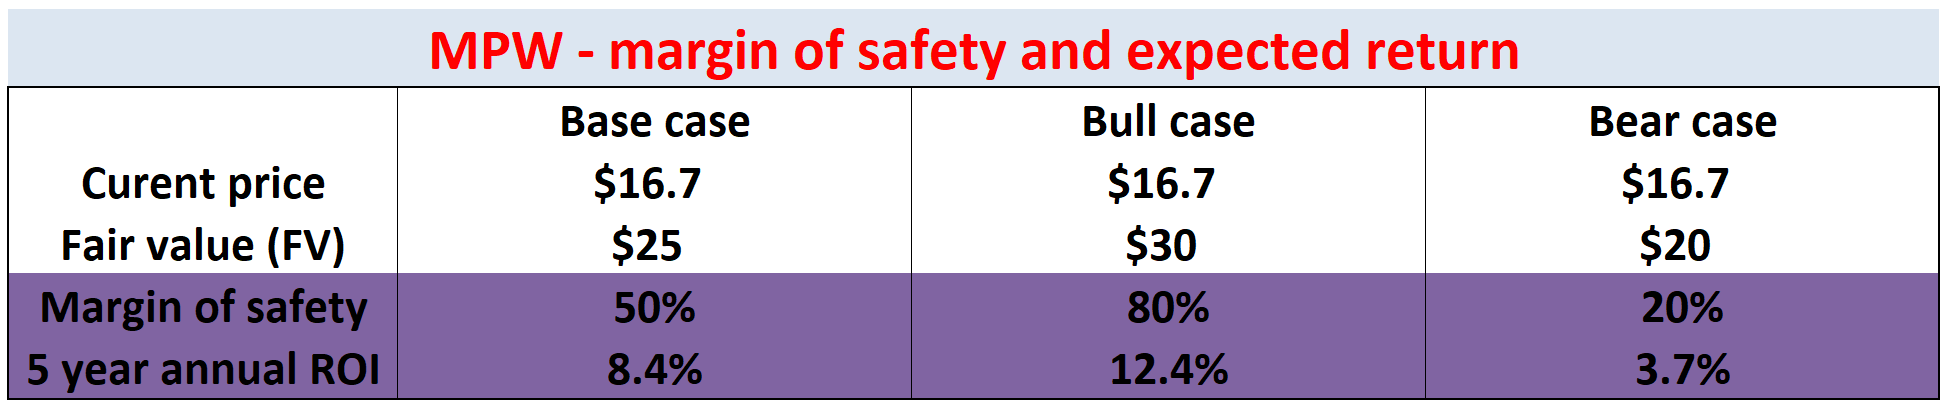
- As a base case, I expect the fair value to be about $25. The base case considers an average WACC of around 7% to 7.5% considering its historical record and my anticipation of future borrowing rates. The base case provides a margin of safety of 50% and an annual return potential of 8.4% in the next 3 to 5 years.
- The bull case considers a lucky combination of a higher growth rate and a lower cost of capital. The fair value in this case will be about $30. In this case, investment at the current price features a margin of safety of 80%, and the annual return is estimated to be around 12.4%.
- Finally, the bear case is projected to have a fair value of $20. Even this case provides a decent margin of safety, about 20%.
Author based on Seeking Alpha data Author based on Seeking Alpha data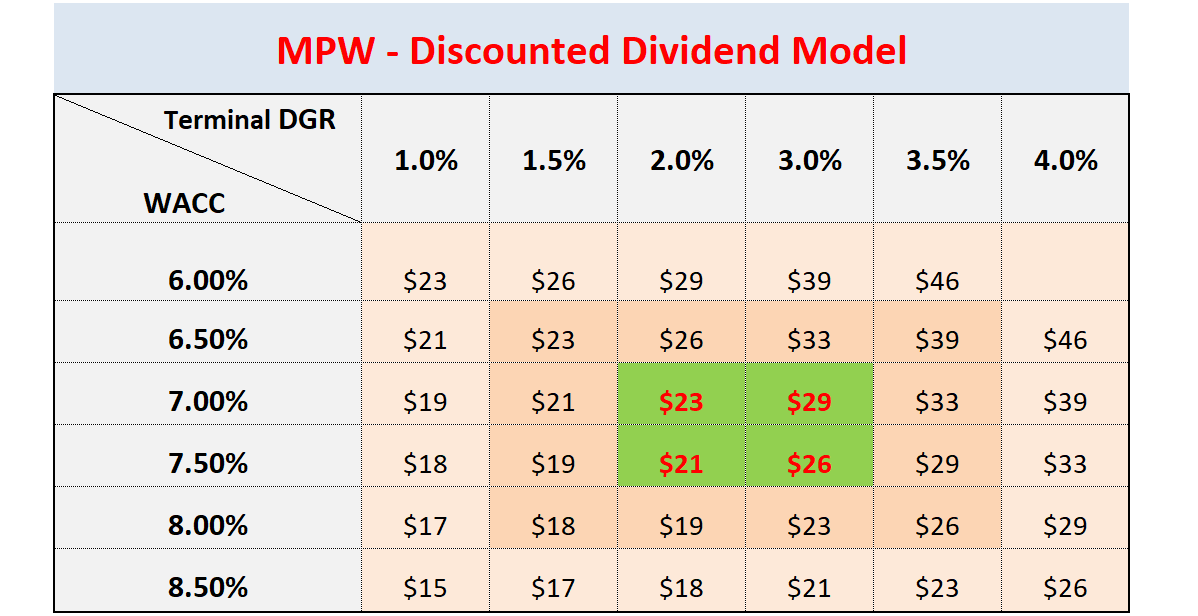
Final thoughts and risks
MPW showed up on my radar recently as its dividend yield surged to a record level in a decade. A closer look reveals some areas of concern such as leverage and COVID-induced interruptions. However, I think these issues are either within the normal range of fluctuation when put under the historical context or are temporary. In terms of valuation, assessment based on both FFO and DDM analysis shows a large margin of safety. Fundamentally, the business is backed by a strong secular tailwind. It operates the most critical facilities in the healthcare delivery continuum and enjoys the highest-priority position among all creditors.
Finally, risks. As aforementioned, it does face several operation challenges in the near term. These issues include lower staffing levels due to COVID-related self-isolation and rising personnel costs. And its occupancy rates are still in the process of recovering. Finally, as noted above, the stock has demonstrated quite extreme valuations volatility. Its FFO multiple has varied by about 5x in the past decade, from a bottom of 4.6x FFO to a peak around 23x.
Be the first to comment