

Talaj/iStock via Getty Images
In a mid-July report, JPMorgan (JPM) estimated Bitcoin (BTC-USD) miner production costs fell to about $13,000 per coin. This figure was widely reported in the crypto sector and business media. The general reporting seemed to overstress the number itself and its implications for the miners more broadly. However, Decrypt ran an interesting piece exploring beyond the headline number and spoke with the CEO of mining company CleanSpark (CLSK) about the topic.
The JPMorgan report emphasized that the cost reduction may reduce pressure on miners to sell their Bitcoin holdings. The report also attributed the lower production costs to a “strong effort” by the miners to maintain profitability by deploying more efficient mining equipment. Related to this last idea, the report cast doubt on the assumption that a meaningful amount of lower efficiency miners have gone offline.
The article below pushes back, in part, against these conclusions. It also presents a more granular way to look at mining costs, especially for the larger U.S and Canada based public mining companies. And it concludes with a look at the recent pivot in the total network hash rate trend, a key component of yield and therefore cost per coin.
Cambridge Bitcoin Electricity Consumption Index
JPMorgan estimates the average per coin production cost dropped from about $20,000 at the beginning of June to the current estimate of $13,000. In my opinion this is a rather bold proposition. And importantly, they believe that the decline in the cost was largely driven by the decline in electricity used.
The JPMorgan cost model uses the Cambridge Bitcoin Electricity Consumption Index as a proxy to gauge electricity usage. The graphic below shows the CBECI best-guess for daily power demand with its dark orange line. The shaded area represents the theoretical upper and lower bounds of the daily demand. The lower bound basically represents all miners running the most efficient hardware, while the upper bound assumes all miners use the least efficient hardware that is still profitable at current Bitcoin price and total hash conditions.
Bitcoin Power Demand (CBECI)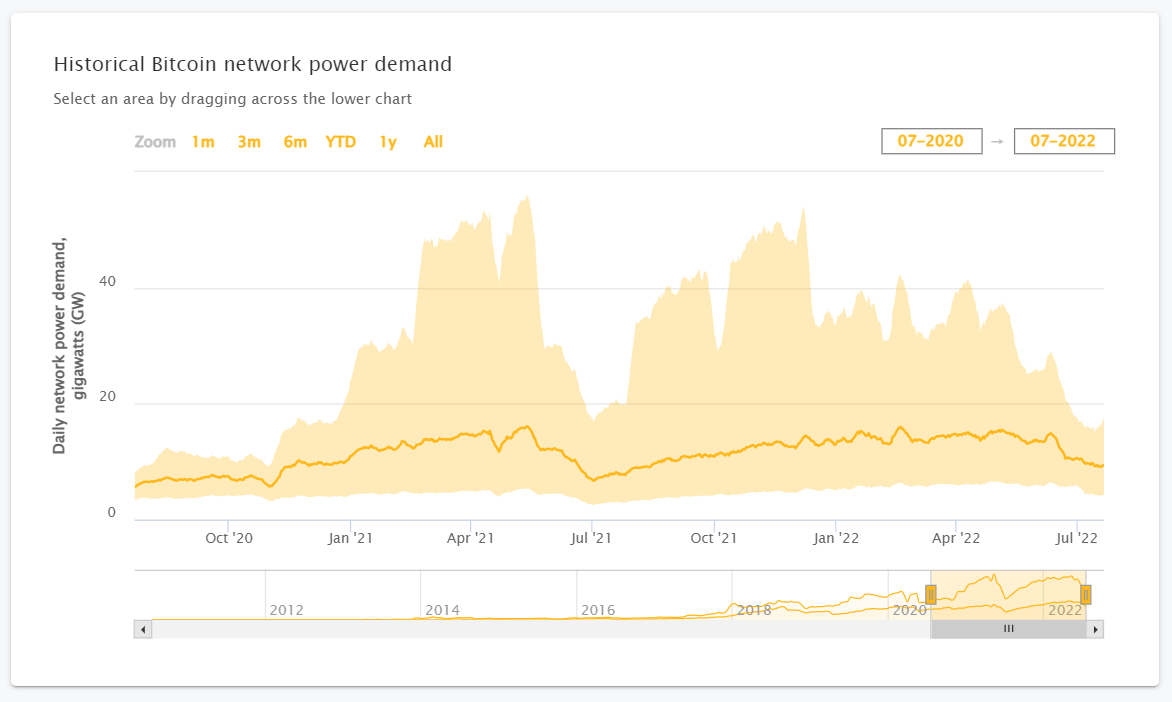
Note the sharp decline in June of this year, both in the best-guess and the upper bound. In the CBECI method, with other factors held constant, as the price of Bitcoin falls, the theoretical share of low efficiency mining equipment is quickly removed from the calculation, as it is assumed to no longer be profitable. So during the June period, when prices collapsed and total network hash rate remained relatively flat, the model sees a large increase in productivity. Put differently, it is weighting this similar hash rate total to a theoretical set of substantially more efficient equipment, with lower power demands. By extension, this means lower costs.
But the CBECI knows the model has limitations:
…it is unlikely that miners are able to react as quickly to short-term changes in the profitability threshold. While we attempt to smoothen the effect of short-term hashrate variations and price volatility, applying a moving average of 14 days (profitability threshold), may not be sufficient.
…assuming that all profitable equipment is equally distributed among miners is unrealistic given that not all hardware is produced in equal quantities and readily available. The exact market share is unknown, although existing data suggests that a few large manufacturers dominate the market.
Source: Methodology, Cambridge Bitcoin Electricity Consumption Index (link above)
Also note that the CBECI fundamentally changed their model’s hardware selection method on May 17th of this year, lowering the representation of older equipment and eliminating all small scale manufacturers’ rigs. They also happened to add three additional ultra-high efficiency miners from Bitmain and MicroBT to the model’s hardware selection in June.
For the combined reasons above, it is my opinion the JPMorgan cost model is only weakly attached to the real-world dynamic, especially over a short span of 45 days during a period of flux in a key component of the model’s methodology. To summarize, meaningful changes to the CBECI methodology in May and June, and the rapid drop in Bitcoin prices, caused a large, though only theoretical, decrease in Bitcoin network energy usage. In turn, the JPMorgan cost model reports an unrealistic 35% decrease in Bitcoin mining costs per coin over just a month and half.
Crypto Miners Now Sell Bitcoin Holdings
While some miners receive dollar denominated revenues for providing hosting services, revenues are largely in the form of bitcoins. However, miners have substantial dollar denominated energy, maintenance and administration costs. Recently, the miners have sold their Bitcoin production or a portion of holdings to fund these current operations.
Over the last eighteen months it was more common for the miners to raise dollars though share sales, as stock prices were high, or through financing, when they were receiving preferable rates. So in my opinion, a change in dollar denominated costs will not meaningfully change the need for increasing sales of production or holdings as miners’ cash on hand diminishes over time. For a period, even as stock prices recover, it is likely miners continue to sell production for dollars. Looking forward, it is unlikely all miners will return to a 100% hodl stance even if Bitcoin recaptures the $30,000 range.
Miner Cost Per Coin
One useful way to look at current costs for the miners is pulling data from the 10-Q for U.S. companies like Riot Blockchain (RIOT), and from the MD&A for Canadian companies like Bitfarms (BITF). The adjusted cost of sales per mined coin shown below represents energy costs plus items like repairs, maintenance, and upgrades to existing equipment and facilities. (Riot 10-Qs Link – Bitfarms MD&As Link)
Note that for simplicity, the discussion that follows does not include the meaningful general and administrative costs. As an example using Bitfarms, these types of costs, even exclusive of share based compensation, were a somewhat surprising $6,000 per coin in Q1’22. Depreciation costs have also been removed and of course no capital expenses are included here.
Adjusted Cost of Sales Per Mined Coin
| Q3’21 | Q1’22 | |
| Riot Blockchain | $10,100 | $13,600 |
| Bitfarms | $8,600 | $10,600 |
Source: Author, from company reports
And over 80% of these adjusted cost of sales per mined coin were energy costs.
Bitfarms’ Direct Costs Per Mined Coin (Energy Costs)
| Q3’20 | Q4’20 | Q1’21 | Q2’21 | Q3’21 | Q4’21 | Q1’22 |
| $7.5K | $7.5K | $8.3K | $9.0K | $6.9K | $8.0K | $8.7K |
Source: Author, from company reports
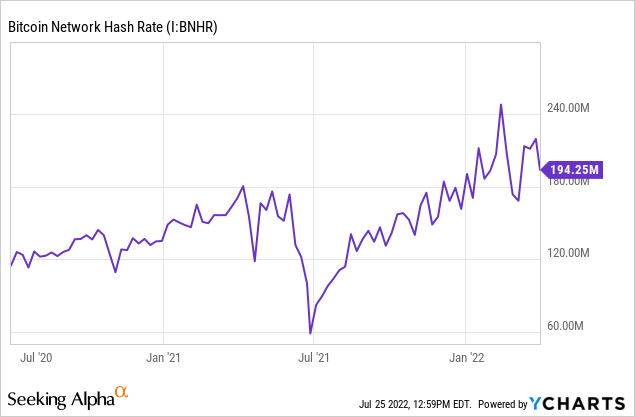
Further, direct costs on a per coin basis are most sensitive to the rapidly changing total network hash rate. Compare the timing and movements in table above, with the graphic below. And note both the large spike down in costs and the total network rate were due to the mining crackdown in China which temporarily decreased completion and surged yields for Western miners.
As JPMorgan noted, miners may be marginally improving costs per mined coin by adding new high-efficiency miners each month. But bear in mind these additions of thousands of units are generally being added to large fleets with tens of thousands of rigs, the large majority of which are also high-efficiency. So changes in the total network hash rate remains the driving and more meaningful force behind changes to miners’ costs on a per coin basis.
Going Forward: Total Network Hash Rate
We have definitely seen a flattening and reversal in the total network hash rate over the past two months. Note the orange line in the graphic below shows the total hash rate and is in millions of TH/s. For reference, a million TH/s is one EH/s.
One factor driving a lower total network hash rate is the record temperatures in the U.S. and Europe. Riot meaningfully curtailed power usage in June and most miners in Texas, for example, are said to have substantially curtailed this month as well. This curtailment is similar, though apparently more extensive, to what one sees with the Canadian miners during the coldest winter months.
Bitcoin miners, which increasing use renewable sources, enable supply expansions that would not be economically feasible or workable otherwise. During peak demand, these sources can be used to mitigate brownouts. For those interested, Block (SQ) produced an interesting memo with data from ARK Invest titled, Bitcoin is Key to an Abundant, Clean Energy Future.
One additional item, the majority of Marathon Digital’s (MARA) large 4 EH/s capable fleet went offline in June due to a storm at their main location in Hardin, MT. And note the fleet largely remains offline.
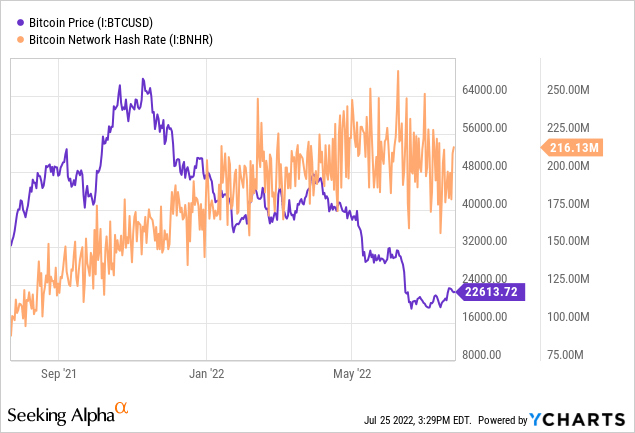
Lastly, the war in Ukraine has been disruptive to energy markets. And because miners without energy contracts are facing higher rates in the current environment, and the price of Bitcoin has fallen substantially, there is likely some marginal loss in the total network hash rate at the low-efficiency end. For example, at Bitcoin prices below $24,000, the popular Bitmain S9 miners are likely unprofitable when paying above $.04/KWh for the electricity.
Energy prices may remain elevated for some time and partially depress total network hash rate growth. But curtailment effects likely pass as fall approaches. Marathon will eventually power their fleet and already have plans to move equipment out of Montana. If Bitcoin prices were to regain the upper $20,000 range, low-efficiency miners will return. For these reasons, I expect to see a renewed trajectory toward a higher total network hash rate as new equipment is always being deployed. And as mining becomes increasingly energy intensive at higher total rates, mining costs per coin will rise.
The upshot for those investing in the Nasdaq listed Bitcoin miners is to not over-emphasize the JPMorgan report. Don’t extend the large reported increase in profitability to your thinking for second and third quarter earnings estimates.
The adjusted cost of sales per mined coin before SG&A expense for these large miners is currently around $12,000. In Q2 these costs were likely flattish to up as total network hash rate peaked in June. Going forward, I believe the upward trajectory in the total network hash resumes and accelerates, increasing costs per coin upwards of $1,000 per quarter. However, even when factoring in SG&A expenses, prices above $20,000 provide low profitability.
Generally speaking, these miners are not financially stressed and could sell current production to cover current operations and service commitments. And these sales would not be sizeable enough to affect pricing in the spot market. In current Bitcoin price and hash rate conditions, the large Western miners appear reasonably priced based at their current multiples, and they rate holding.
My new marketplace service is coming soon! Complete Crypto Analytics is launching in the near future and will have an in-depth, dedicated Bitcoin miner comparison feature. Please keep reading my articles here for updates so you can reserve your spot as a Legacy Discount Member! There will be a generous introductory price for early subscribers. Thank you for following my work.
Be the first to comment