

Pgiam/iStock via Getty Images
Investment Thesis
The “fundamentals” of evolving medical technology and techniques of hospital and care management facilities make staying current in these fields an intensive, full-time job. That leaves individual investors often excluded from that necessary part of the value analysis.
Instead, competent and experienced full-time employee analysts at big-$ investment “institutions” keep track of those developments while others at the firm integrate the investment industry moving parts into capital-commitments of desired share-holding trades. Then Market-Makers take over to find “other side of the trade” balancing partners at other institutions with their own reasons for actions.
In the process risks must be taken and protected against, where predictive markets by their pricing translate expectations into coming prices per share bounds, both to the upside and the down. The market’s subsequent actions put odds on the expectations.
Descriptions of the Companies with securities involved
“Medical Properties Trust, Inc. is a self-advised real estate investment trust formed in 2003 to acquire and develop net-leased hospital facilities. From its inception in Birmingham, Alabama, the Company has grown to become one of the world’s largest owners of hospitals with 431 facilities and roughly 43,000 licensed beds in nine countries and across four continents on a pro forma basis. MPT’s financing model facilitates acquisitions and recapitalizations and allows operators of hospitals to unlock the value of their real estate assets to fund facility improvements, technology upgrades and other investments in operations.”
Source: Yahoo Finance
Yahoo Finance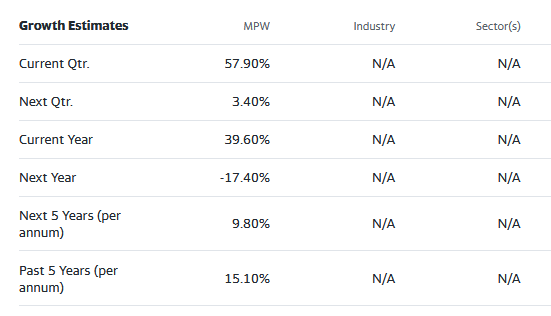
“Evolent Health, Inc., a healthcare company, through its subsidiary, Evolent Health LLC, provides clinical and administrative solutions to payers and providers in the United States. The Evolent Health Services segment provides an integrated administrative and clinical platform for health plan administration and population health management. The Clinical Solutions segment offers specialty care management services support a range of specialty care delivery stakeholders during their transition from fee-for-service to value-based care, independent of their stage of maturation and specific market dynamics in oncology and cardiology; and holistic total cost of care improvement. The company was founded in 2011 and is headquartered in Arlington, Virginia.”
Source: Yahoo Finance
Yahoo Finance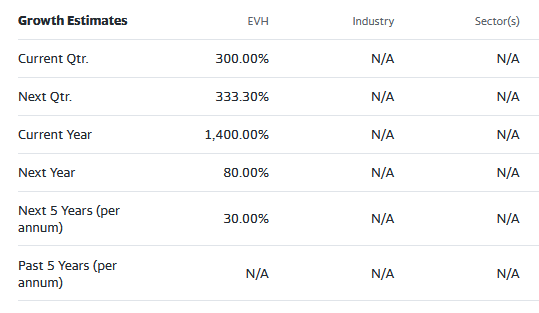
These growth estimates have been made by and are collected from Wall Street analysts to suggest what conventional methodology currently produces. The typical variations across forecast horizons of different time periods illustrate the difficulty of making value comparisons when the forecast horizon is not clearly defined.
Risk and Reward Balances Among Healthcare Providers
Let’s consider selections from at an “Opportunity Set” of comparable companies ranging from most to least attractive to examine in one particular area of Healthcare today – longer-term care, often of elderly Among the many active participants are two we have an interest.
One widely owned stock is Medical Properties Trust (NYSE:MPW). Another is Evolent Health, Inc. (EVH). Here in Figure 1 is how the markets currently appraise their Reward ~ Risk trade-offs, based on behavioral analysis (of what investing systems require to be done, not of emotional investor errors) of actions by Market-Makers [MMs] as they protect their at-risk capital from possible damaging future market-price moves.
Figure 1
blockdesk.com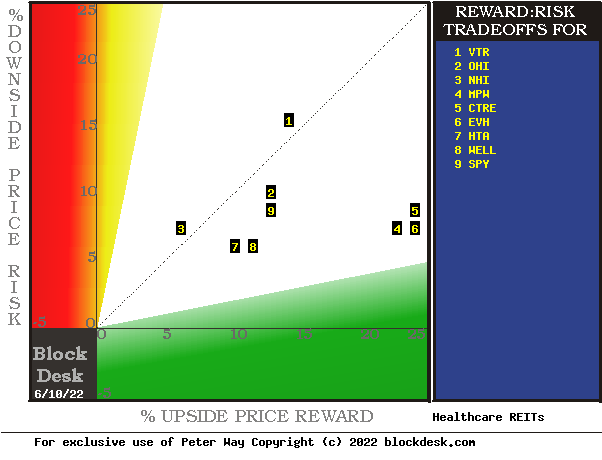
(used with permission)
Their actions are essential to the conduct of irregular large-volume “block trades” which are the frequent movers of stock prices, rather than the continual small-volume traffic of the “investing public” individuals. Upside price rewards are from their potential reward forecasts, measured by the green horizontal scale.
The risk dimension is of actual price drawdowns at their most extreme point while being held in previous pursuit of upside rewards similar to the ones currently being seen. They are measured on the red vertical scale.
Both scales are of percent change from zero to 25%. Any stock or ETF whose present risk exposure exceeds its reward prospect will be above the dotted diagonal line. Capital-gain attractive to-buy issues are in the directions down and to the right.
Our principal interest is in MPW at location [4], high near the reward scale’s right-hand boundary but also low on the vertical red risk scale. Next to it is EVH at [6]. A “market index” norm of reward~risk tradeoffs is offered by SPY at [9]. Most appealing by this Figure 1 view is EVH.
The Figure 1 map provides a good visual comparison of the two most important aspects of every equity investment in the short term. There are other aspects of comparison which this map sometimes does not communicate well, particularly when general market perspectives like those of SPY are involved. Where questions of “how likely’ are present other comparative tables, like Figure 2, may be useful.
Yellow highlighting of the table’s cells emphasize factors important to securities valuations and the security EVH of most promising of near capital gain as ranked in column [R]. The pink highlighting identifies the less-favored REIT, MPW.
Figure 2
blockdesk.com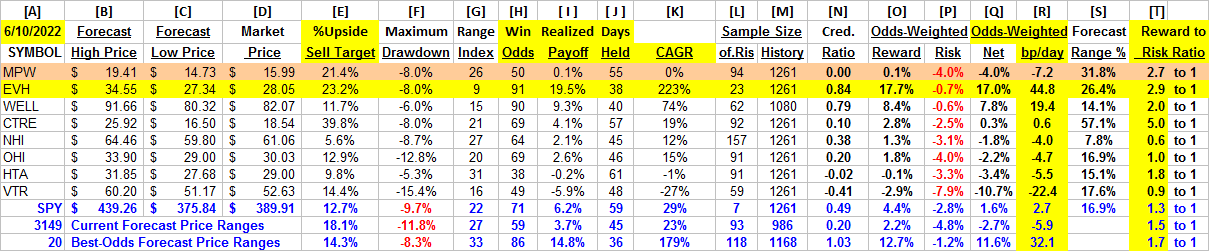
Why do all this math?
Figure 2’s purpose is to attempt universally comparable answers, stock by stock, of a) How BIG the prospective price gain payoff may be, b) how LIKELY the payoff will be a profitable experience, c) how SOON it may happen, and d) what price drawdown RISK may be encountered during its holding period.
Readers familiar with our analysis methods after quick examination of Figure 2 may wish to skip to the next section viewing price range forecast trends for EVH and MPW.
Column headers for Figure 2 define investment-choice preference elements for each row stock whose symbol appears at the left in column [A]. The elements are derived or calculated separately for each stock, based on the specifics of its situation and current-day MM price-range forecasts. Data in red numerals are negative, usually undesirable to “long” holding positions. Table cells with yellow fills are of data for the stocks of principal interest and of all issues at the ranking column, [R]. Cells with pink fills, like column [H] row VET warn of deficiencies from minimum standards. In this case, less than 80% of prior forecasts history at today’s Range Index earning a profit.
The price-range forecast limits of columns [B] and [C] get defined by MM hedging actions to protect firm capital required to be put at risk of price changes from volume trade orders placed by big-$ “institutional” clients.
[E] measures potential upside risks for MM short positions created to fill such orders, and reward potentials for the buy-side positions so created. Prior forecasts like the present provide a history of relevant price draw-down risks for buyers. The most severe ones actually encountered are in [F], during holding periods in effort to reach [E] gains. Those are where buyers are emotionally most likely to accept losses.
The Range Index [G] tells where today’s price lies relative to the MM community’s forecast of upper and lower limits of coming prices. Its numeric is the percentage proportion of the full low to high forecast seen below the current market price.
[H] tells what proportion of the [L] sample of prior like-balance forecasts have earned gains by either having price reach its [B] target or be above its [D] entry cost at the end of a 3-month max-patience holding period limit. [I] gives the net gains-losses of those [L] experiences.
What makes EVH most attractive in the group at this point in time is its ability to produce earnings most consistently at its present operating balance between share price risk and reward, the Range Index [G]. Credibility of the [E] upside prospect as evidenced in the [I] payoff is shown in [N].
Further Reward~Risk tradeoffs involve using the [H] odds for gains with the 100 – H loss odds as weights for N-conditioned [E] and for [F], for a combined-return score [Q]. The typical position holding period [J] on [Q] provides a figure of merit [fom] ranking measure [R] useful in portfolio position preferencing. Figure 2 is row-ranked on [R] among alternative candidate securities, with EVH in top rank below the deficient MPW.
Along with the candidate-specific stocks these selection considerations are provided for the averages of some 3100 stocks for which MM price-range forecasts are available today, and 20 of the best-ranked (by fom) of those forecasts, as well as the forecast for S&P 500 Index ETF (SPY) as an equity-market proxy.
As shown in column [T] of figure 2, those levels vary significantly between stocks. What matters is the net gain between investment gains and losses actually achieved following the forecasts, shown in column [I]. The Win Odds of [H] tells what proportion of the Sample RIs of each stock were profitable. Odds below 80% often have proven to lack reliability.
Recent Forecast Trends of Primary Subjects
Figure 3
blockdesk.com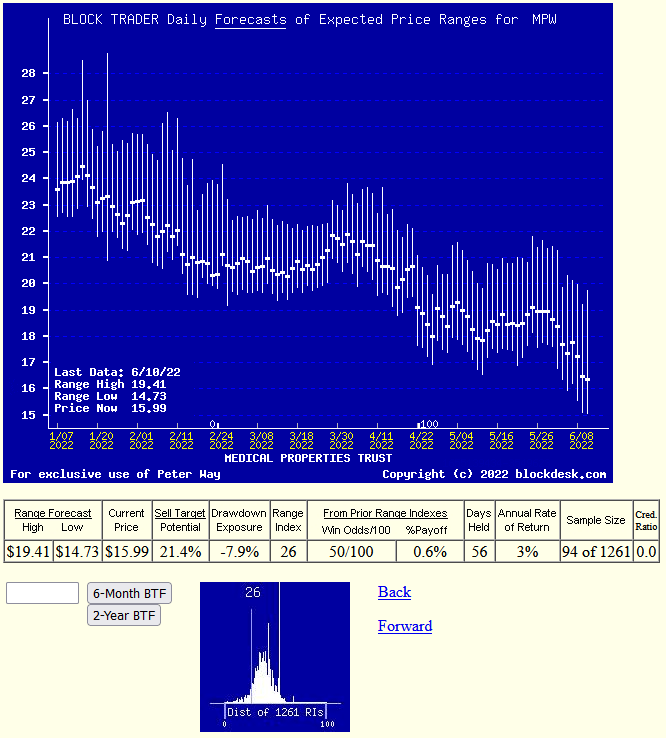
Figure 4
blockdesk.com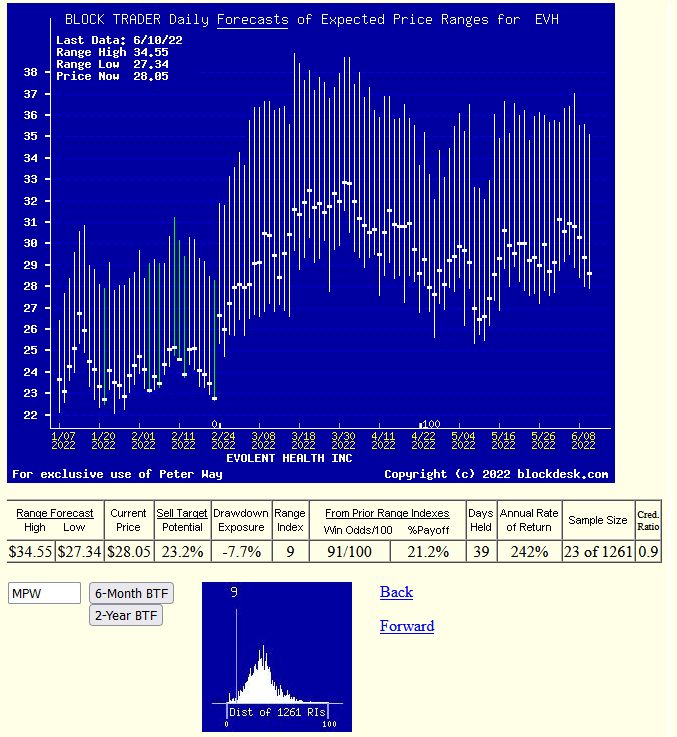
Many investors confuse any picture of time-repeating stock prices with typical “technical analysis charts” of past stock price history. Instead, Figure 3’s vertical lines are a daily-updated visual record of price range forecast limits expected in the coming few weeks and months. The heavy dot in each vertical is the stock’s closing price on the day the forecast was made.
That market price point makes an explicit definition of the price reward and risk exposure expectations which were held by market participants at the time, with a visual display of the vertical balance between risk and reward.
The measure of that balance is the Range Index (RI). Here in EVH, ONLY 9% of the full forecast range of $27 to $35 lies between the current price of $28 and $27. With today’s RI there is ten times as much upside price change in prospect as downside. Nine out of every ten prior forecasts like today’s RI balance have been profitable, leaving only two of those 23 earliers with losses. The net of that has been to modestly reduce the expected potential of +23% upsides to net accomplishments of +19.5% gains in 38 market days, or about two months. So history’s advantage could be repeated six times a year, which compounds into a CAGR of +223% which compares to only a 3% dividend yield on MPW.
Also please note the smaller pictures in Figures 3 and 4. They show the past 5-year distribution of Range Indexes with the current level visually marked. For EVH the dominant history has been evaluations with higher prices and Range Indexes.
Conclusion
Based on direct comparisons with VET and other Healthcare Maintainers, there are several clear reasons to prefer a capital-gain seeking buy in Evolent Health, Inc.
An active investment response would be to swap capital out of MPW into EVH, anywhere the principal is sheltered from taxation by its portfolio circumstances.
Be the first to comment