

Sjo/E+ via Getty Images
Introduction
The Weekly Breakout Forecast continues my doctoral research analysis on MDA breakout selections over more than 7 years. This high frequency breakout subset of the different portfolios I regularly analyze has now exceeded 280 weeks of public selections as part of this ongoing live forward-testing research. The frequency of 10%+ returns in a week is averaging over 4x the broad market averages in the past 5+ years.
In 2017, the sample size began with 12 stocks, then 8 stocks in 2018, and at members’ request since 2020, I now generate only 4 selections each week. In addition 2 Dow 30 picks are provided, as well as a new active ETF portfolio that competes against a signal ETF model. Monthly Growth & Dividend MDA breakout stocks continue to beat the market each year as well. I offer 11 top models of short and long-term value and momentum portfolios that have beaten the S&P 500 since my trading studies were made public.
Market Outlook
The Momentum Gauges® continue positive in extremely high volatility after the Fed FOMC rate hike record selloff and the CPI inflation rally reaction last week. Many of the FANG mega cap stocks hit new 2022 year lows last week and META hit the lowest levels since 2015 last Friday. More of these incredible charts are detailed here in my most recent article.
We are still in a pattern of bearish rallies in a longer negative channel from November 2021. There are strong similarities to the volatility and patterns of 2018 and 2008 with investors very cautious. Follow the Momentum Gauges and be ready for more swift changes.
At around 4100, the S&P 500 will test the top of the negative channel in 2022 shown below. S&P 500 closed at 3,992 on Friday.
yuriymatso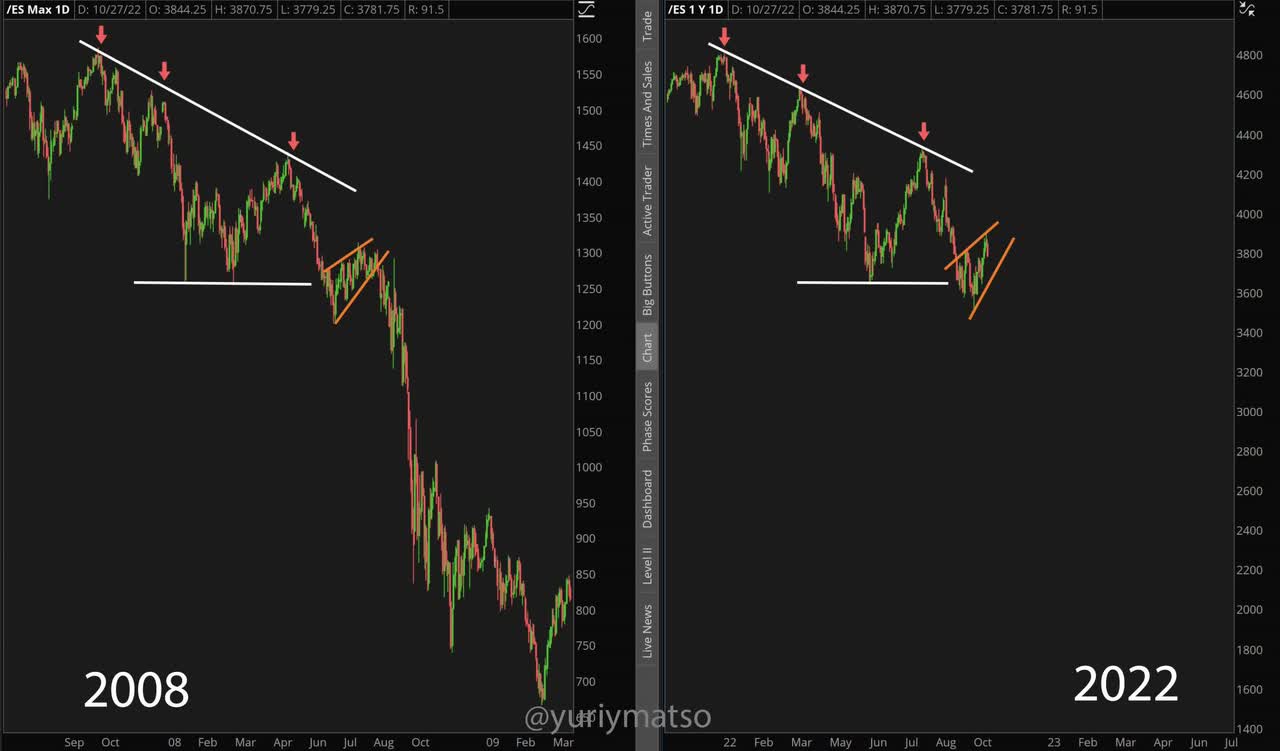
Morgan Stanley chief strategist says “buy-the-dip” but watch out for another pull back after the S&P 500 moves above 4100.
JPMorgan says don’t buy here, you should be selling into S&P 500 above 3900 where we are now.
Momentum Gauges® Stoplight ahead of Week 46. The Stock Market and S&P 500 momentum gauges are positive and the weekly gauges continue positive for a 3rd consecutive week. The technology sector turned positive this week and that is the largest sector both by market cap and number of stocks. It is typically a good indicator of the start of stronger momentum conditions.
VMBreakouts.com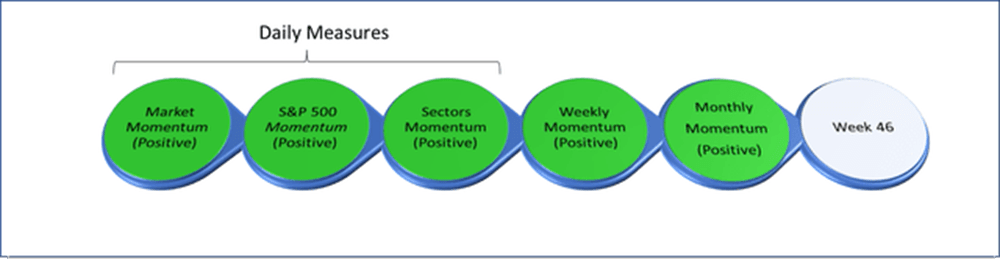
As a reminder much greater detail is covered live every day in the Chat Rooms with current charts and signals. If you are not reviewing the latest charts and updates you could be missing out.
Weekly Momentum Gauges continue positive for a 3rd consecutive week.
VMBreakouts.com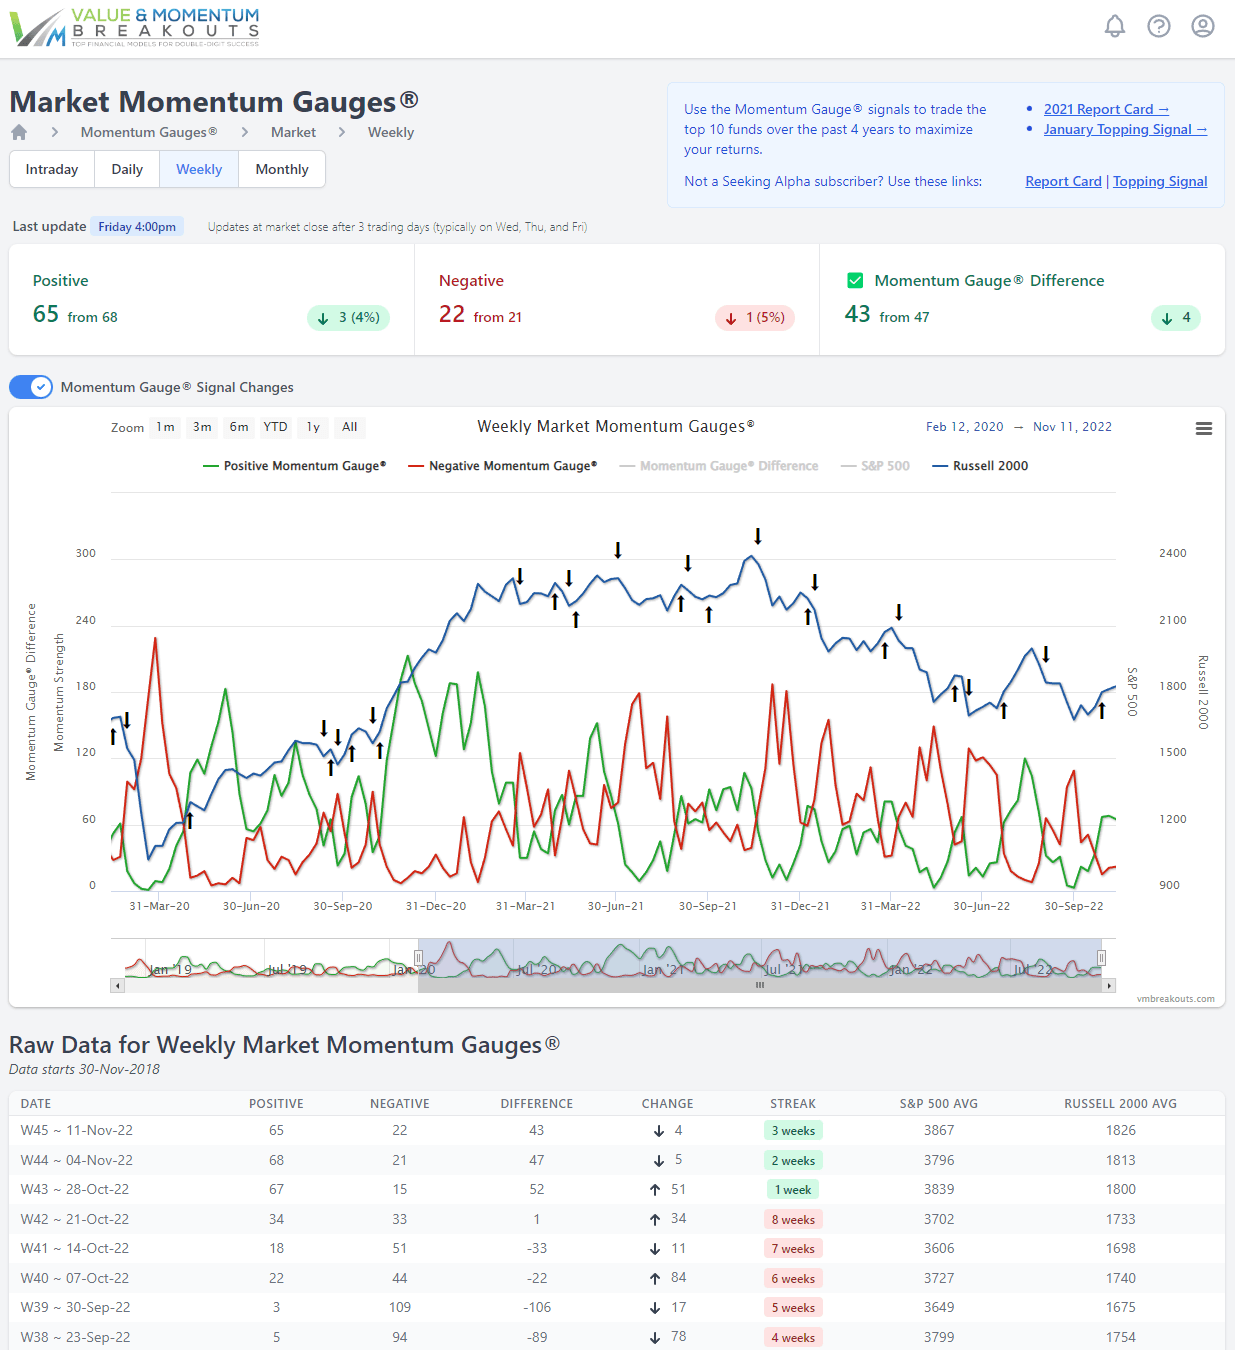
S&P 500 Daily Momentum Gauges continue positive from October 21st with very high volatility.
VMBreakouts.com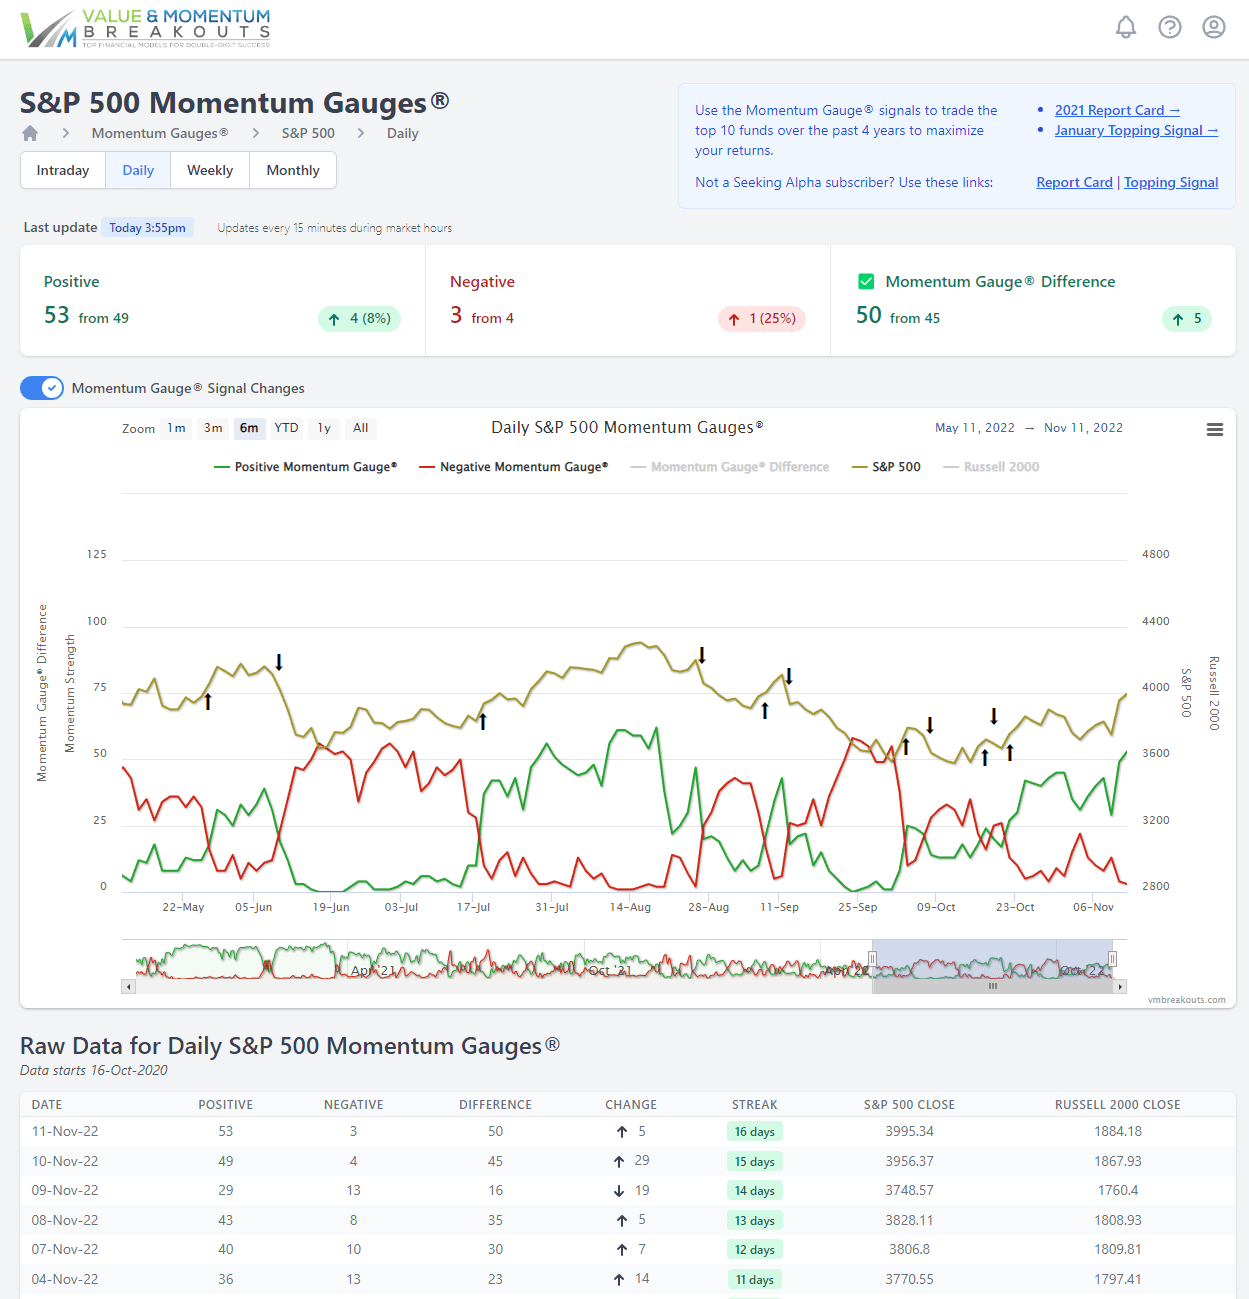
Current Returns
So far YTD 2022 there are 124 picks in 45 weeks beating the S&P 500. 98 picks are beating the S&P 500 by over 10%+ in double digits. Leading MDA gainers include (NUVL) +57.9%, (MNRL) +62.9%, (RES) +123.7%, (TDW) +178.0%, (TUSK) +68.5%, (ZYME) +43.7%, (VRDN) +59.2%, (ZYXI) +64.6%.
Despite such high negative momentum conditions all year, 46 picks in 45 weeks have gained at least 10% in less than a week. Additionally, 98 picks in 45 weeks have gained over 5% in less than a week in these high frequency breakout selections.
VMBreakouts.com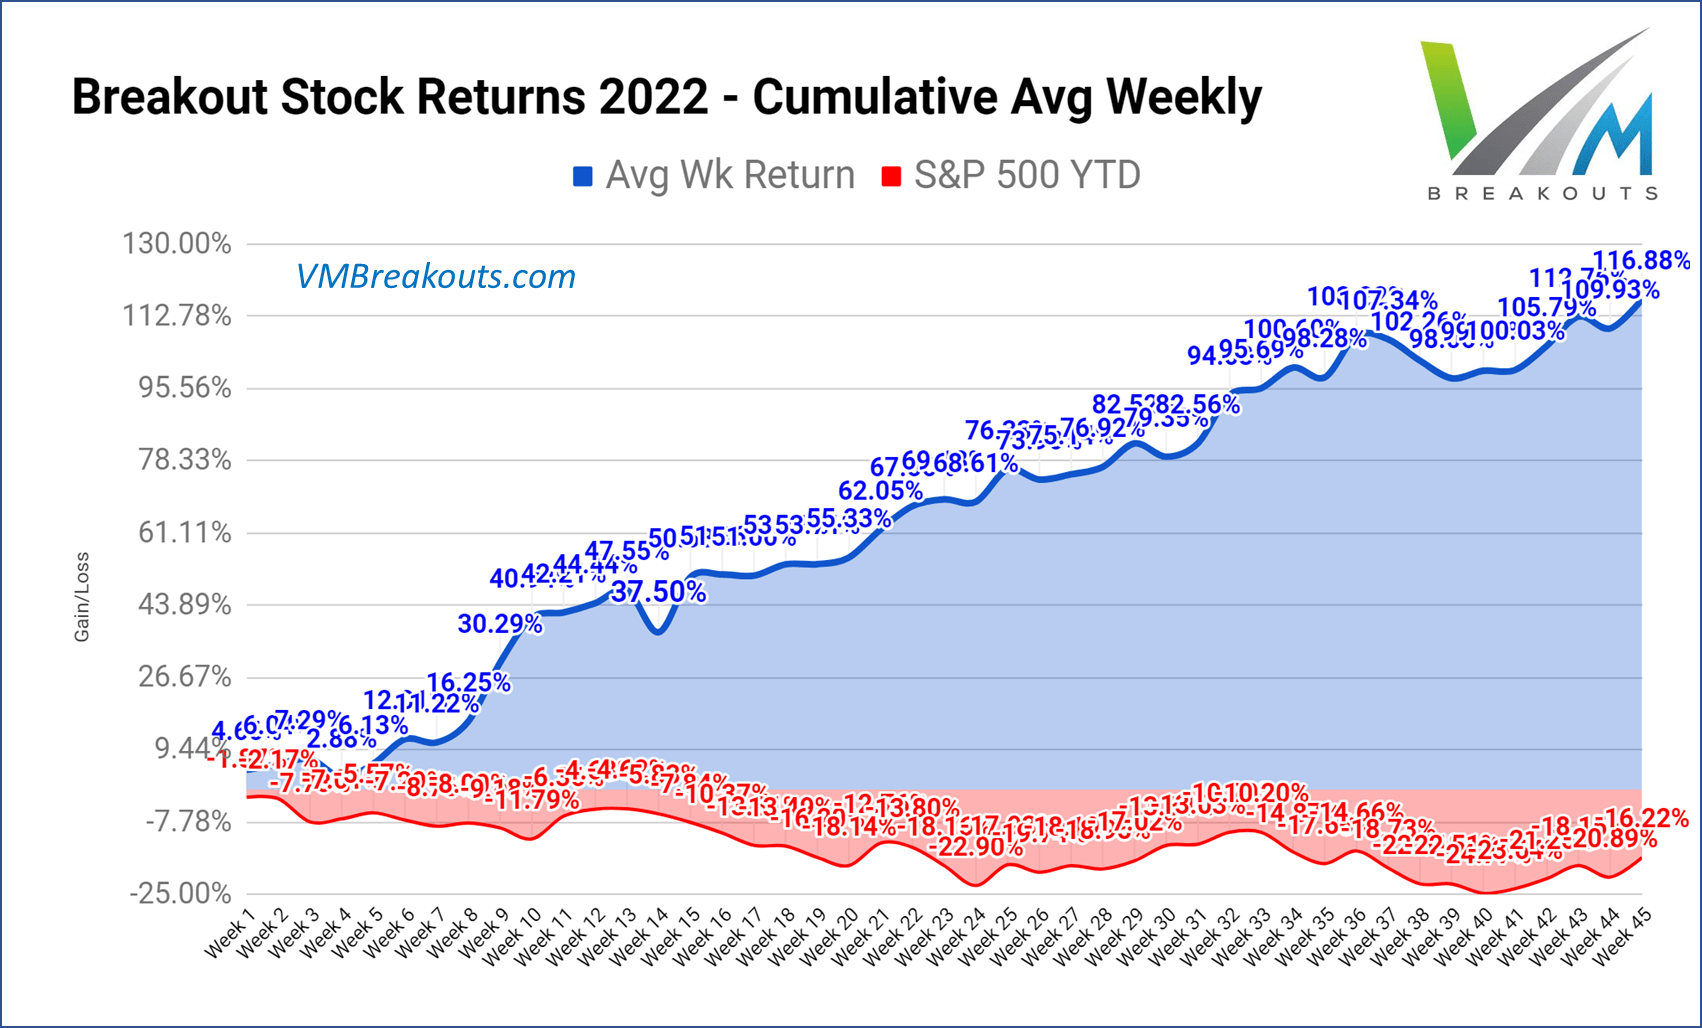
Additional background, measurements, and high frequency breakout records on the Weekly MDA Breakout model is here: Value And Momentum MDA Breakouts +70.5% In 52 Weeks: Final 2021 Year End Report Card
Leveraging The Momentum Gauges With ETFs
In addition to timing MDA breakout stock picks for the best returns, the gauges are used for live ETF bull/bear timing signals with strong results.
VMBreakouts.com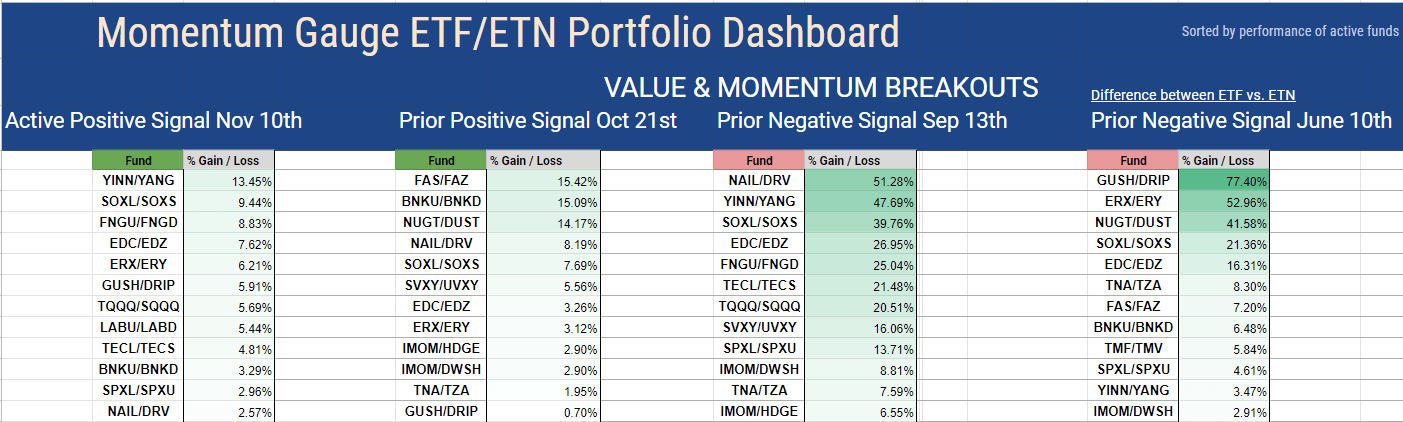
Historical Performance Measurements
Historical MDA Breakout minimal buy/hold returns are at +70.5% YTD when trading only in the positive weeks consistent with the positive Momentum Gauges® signals. Remarkably, the frequency streak of 10% gainers within a 4- or 5-day trading week continues at highly statistically significant levels above 80% not counting frequent multiple 10%+ gainers in a single week.
VMBreakouts.com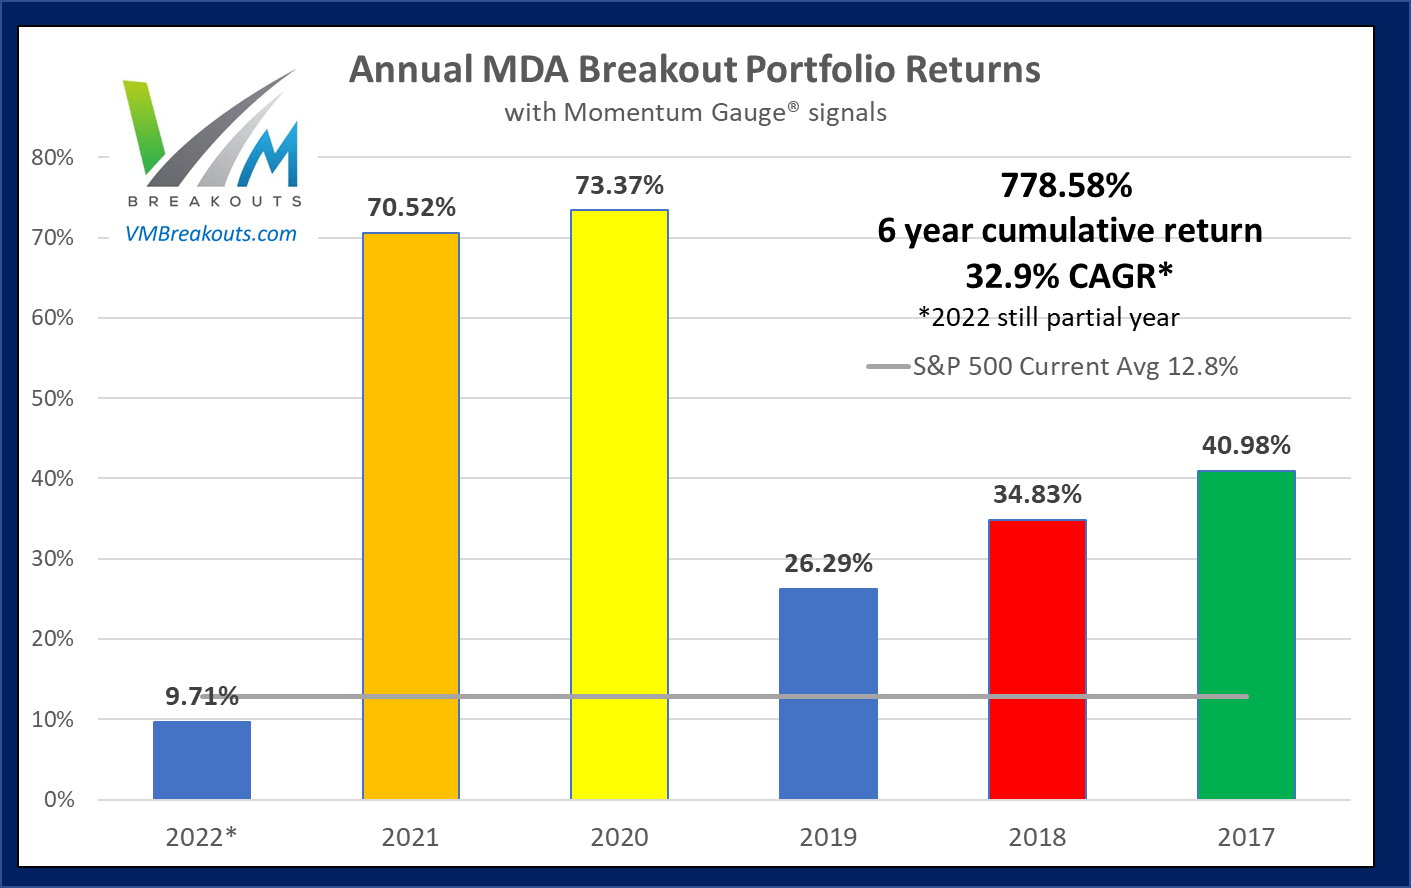
Longer term many of these selections join the V&M Multibagger list now at 110 weekly picks with over 100%+ gains, 48 picks over 200%+, 18 picks over 500%+ and 11 picks with over 1000%+ gains since January 2019 such as:
- Enphase Energy (ENPH) +2,011.4%
- Celsius Holdings (CELH) +1,886.2%
- Northern Oil and Gas (NOG) +1,300.0%
- Trillium Therapeutics (TRIL) +1008.7%
More than 300 stocks have gained over 10% in a 5-day trading week since this MDA testing began in 2017. A frequency comparison chart is at the end of this article. Readers are cautioned that these are highly volatile stocks that may not be appropriate for achieving your long term investment goals: How to Achieve Optimal Asset Allocation
The Week 46 – 2022 Breakout Stocks For Next Week Are:
The picks for next week consist of 1 Healthcare, 1 Industrial, 1 Financial, and 1 Consumer Cyclical sector stocks. Energy and Basic Materials sectors continue extremely positive and you may want to stay in prior week picks. These stocks are measured from release to members in advance every Friday morning near the open for the best gains. Prior selections may be doing well, but for research purposes I deliberately do not duplicate selections from the prior week. These selections are based on MDA characteristics from my research, including strong money flows, positive sentiment, and strong fundamentals — but readers are cautioned to follow the Momentum Gauges® for the best results.
- FREYR Battery (FREY) – Industrials / Electrical Equipment
- Futu Holdings Ltd. (FUTU) – Financial / Capital Markets
FREYR Battery – Industrials / Electrical Equipment
FinViz.com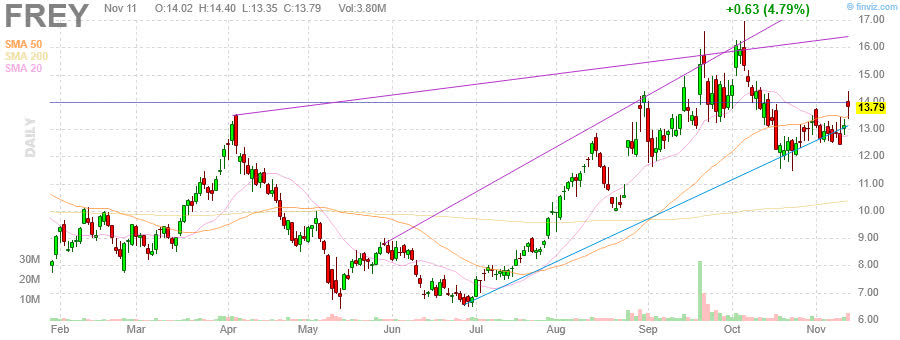
Price Target: $18/share (See my FAQ #20 on price targets)
(Source: Company Resources)
FREYR Battery engages in the production and sale of battery cells for stationary energy storage, electric mobility, and marine applications in Europe and internationally. The company designs and manufactures lithium-ion based battery cell facilities.
StockRover.com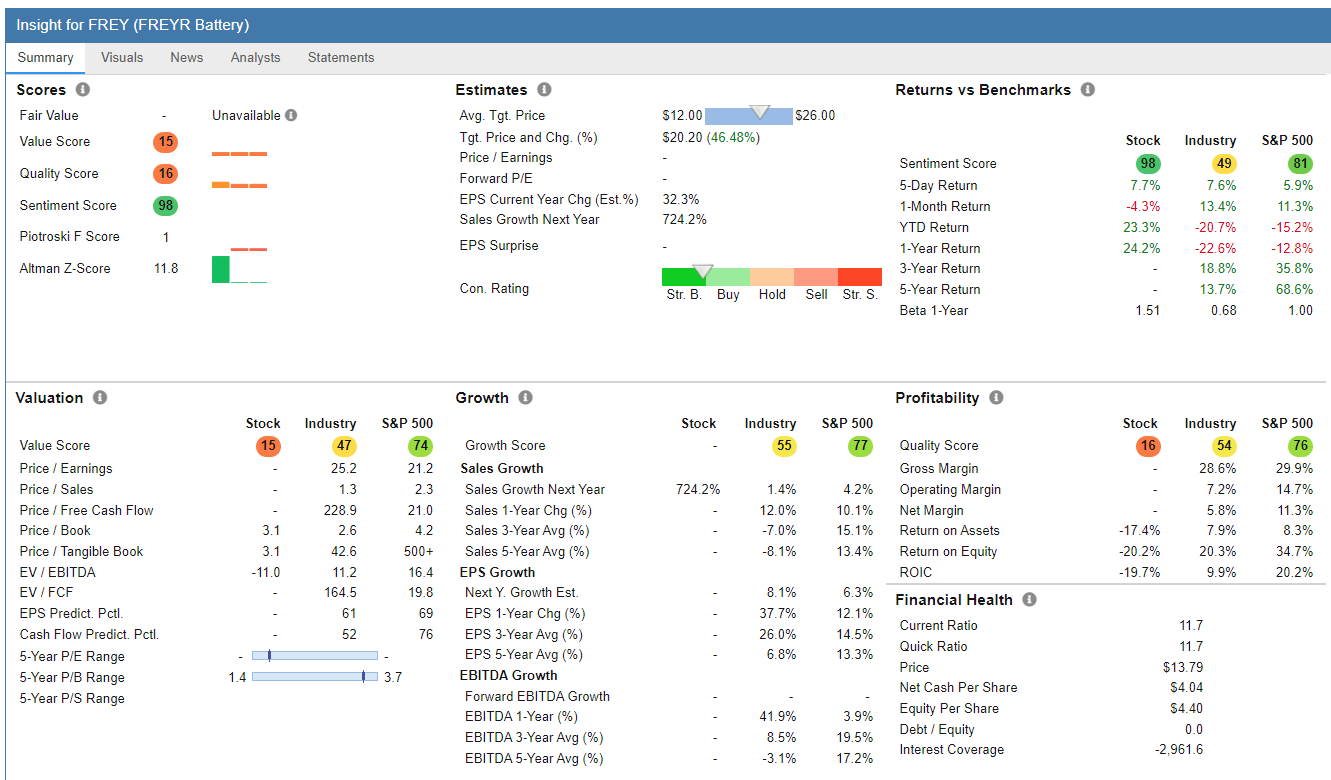
Futu Holdings Ltd. – Financial / Capital Markets
FinViz.com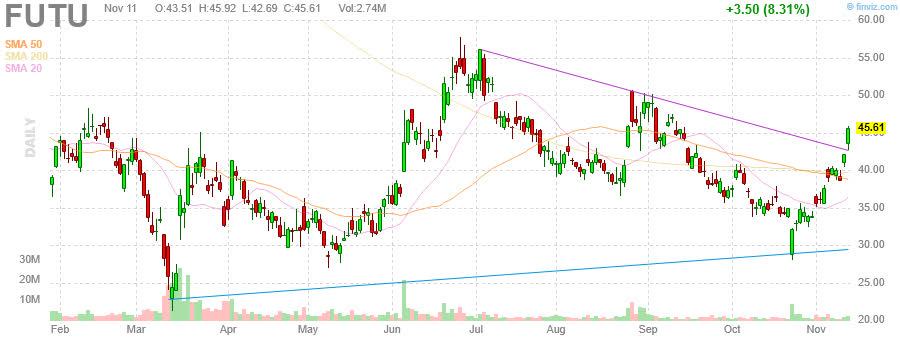
Price Target: $55/share (See my FAQ #20 on price targets)
(Source: Company Resources)
Futu Holdings Limited operates an online brokerage and wealth management platform in Hong Kong and internationally. The company provides trading, clearing, and settlement services; margin financing and securities lending services; and stock yield enhancement program. It also offers online wealth management services under the brand of Futu Money Plus through its Futubull and moomoo platforms, which give access to mutual funds, private funds, and bonds; market data and information services; and NiuNiu Community, which serves as an open forum for users and clients to share insights, ask questions, and exchange ideas.
StockRover.com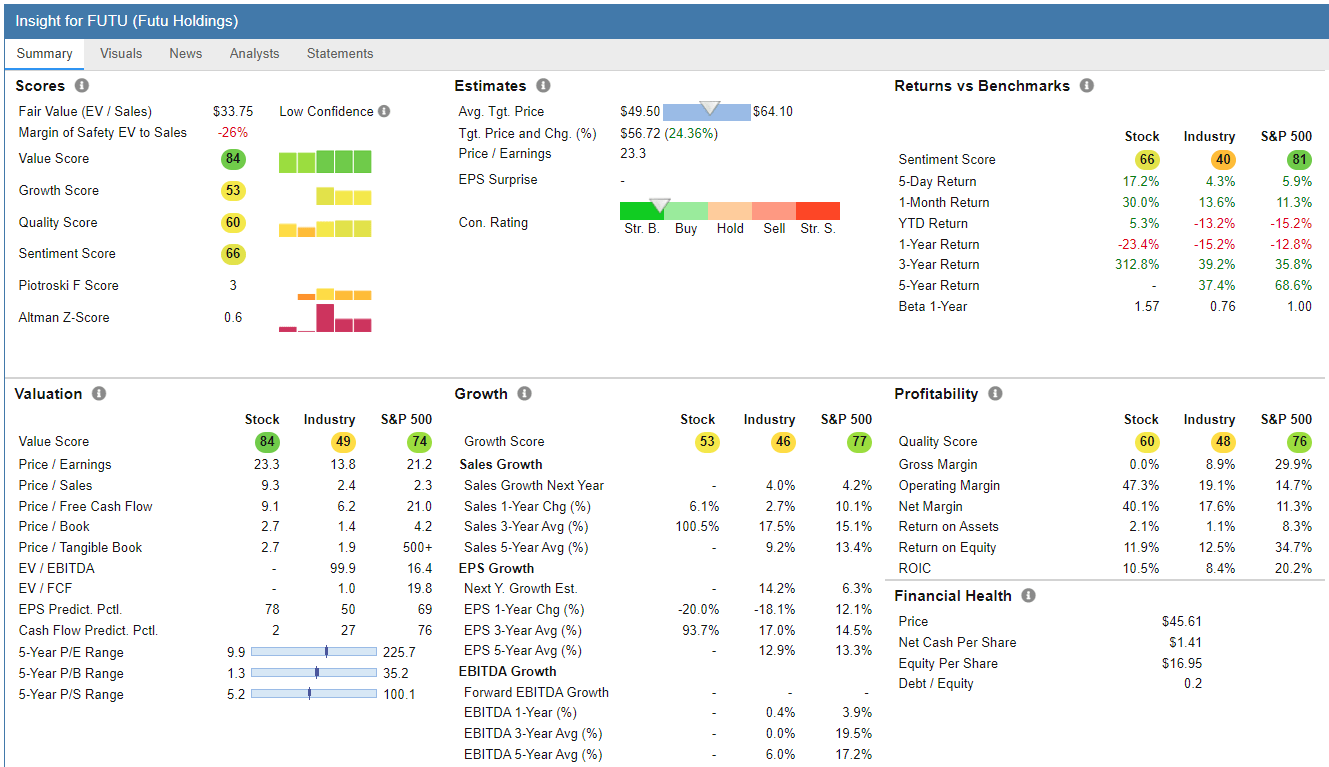
Top Dow 30 Stocks To Watch For Week 46
First, be sure to follow the Momentum Gauges® when applying the same MDA breakout model parameters to only 30 stocks on the Dow Index. Conditions have delivered the worst first half to the stock market since 1970. Second, these selections are made without regard to market cap or the below-average volatility typical of mega-cap stocks that may produce good results relative to other Dow 30 stocks. The most recent picks of weekly Dow selections in pairs for the last 5 weeks:
| Symbol | Company | Current % return from selection Week |
| (NKE) | Nike Inc. | +10.75% |
| (DOW) | Dow Inc. | +8.38% |
| CVX | Chevron Corp. | +2.20% |
| (INTC) | Intel Corp. | +7.03% |
| CVX | Chevron Corp. | +10.37% |
| TRV | Travelers Companies | +5.61% |
| (JPM) | JPMorgan Chase | +21.68% |
| (GS) | Goldman Sachs Group | +28.39% |
| MRK | Merck & Co. | +11.83% |
| (CVX) | Chevron Corp. | +16.52% |
If you are looking for a much broader selection of large cap breakout stocks, I recommend these long term portfolios. The new mid-year selections were released to members to start July:
Piotroski-Graham enhanced value –
- July midyear at +10.42%
- January portfolio beating S&P 500 by +30.08% YTD.
- July midyear down -5.01%
- January Positive Forensic beating S&P 500 by +6.78% YTD.
- July midyear down -16.08%
- January Negative Forensic beating S&P 500 by +27.53% YTD
Growth & Dividend Mega cap breakouts –
- July midyear down -5.47%
- January portfolio beating S&P 500 by +12.25% YTD
These long term selections are significantly outperforming many major hedge funds and all the hedge fund averages since inception. Consider the actively managed ARK Innovation fund down -57.3% YTD, Tiger Global Management -58% YTD.
The Dow pick For Next Week Is:
Dow Inc. (DOW)
Dow was a prior week breakout selection on very strong Q3 results. Earnings and revenue beat estimates on October 20th and the technical indicators are showing strong breakout conditions. Price has moved above the negative channel from June for the first time and past the $50/share resistance discussed last week. Institutions are net buyers in the current quarter and insiders have become net buyers. Watch for the continued move to $55/share next resistance.
FinViz.com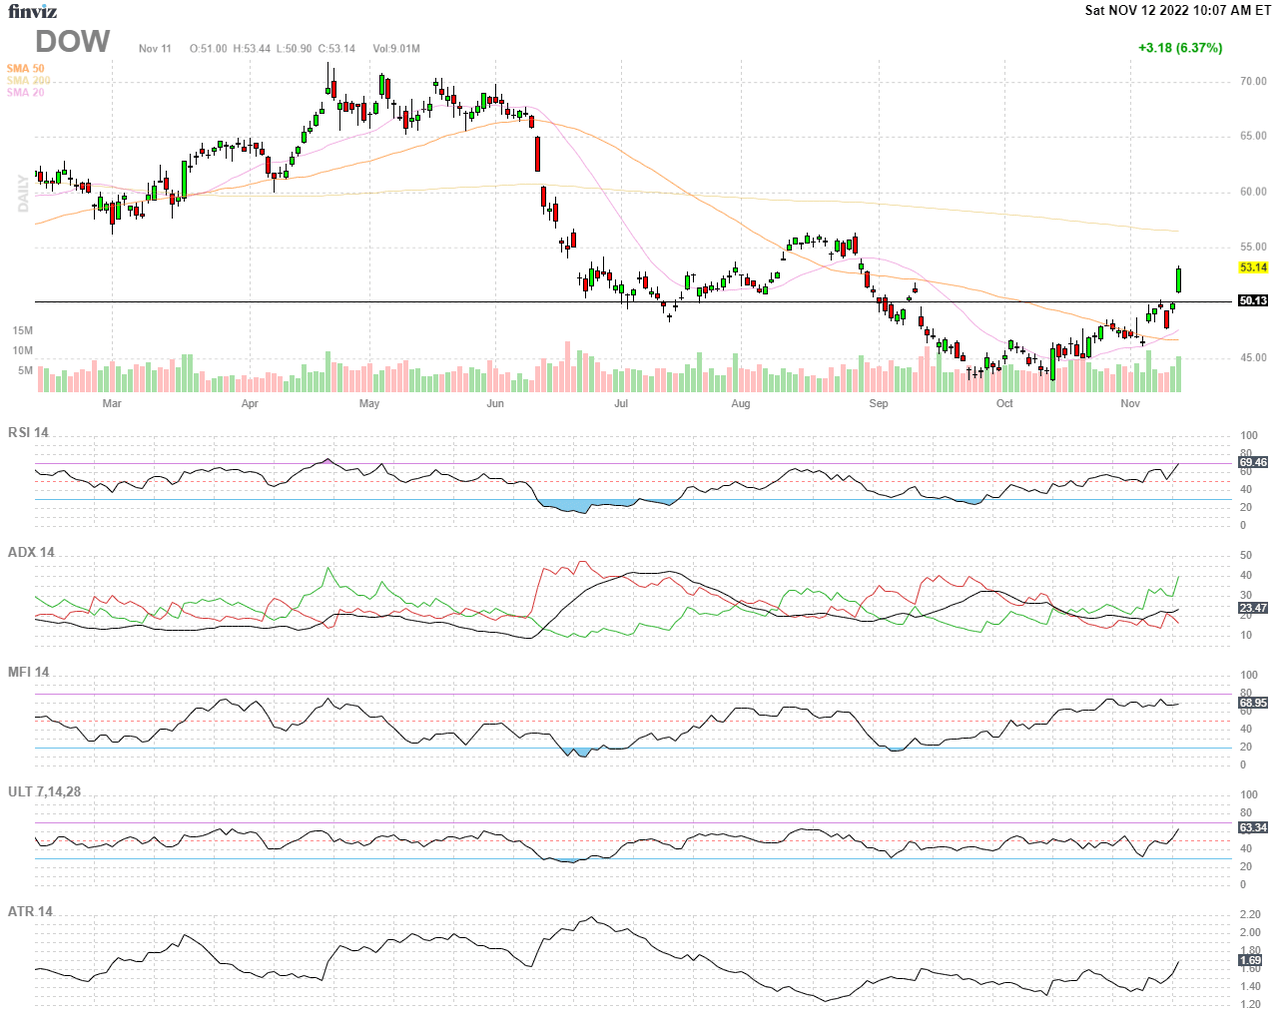
Background On Momentum Breakout Stocks
As I have documented before from my research over the years, these MDA breakout picks were designed as high frequency gainers.
These documented high frequency gains in less than a week continue into 2020 at rates more than four times higher than the average stock market returns against comparable stocks with a minimum $2/share and $100 million market cap. The enhanced gains from further MDA research in 2020 are both larger and more frequent than in previous years in every category. ~ The 2020 MDA Breakout Report Card
The frequency percentages remain very similar to returns documented here on Seeking Alpha since 2017 and at rates that greatly exceed the gains of market returns by 2x and as much as 5x in the case of 5% gains.
VMBreakouts.com
The 2021 and 2020 breakout percentages with 4 stocks selected each week.
VMBreakouts.com
MDA selections are restricted to stocks above $2/share, $100M market cap, and greater than 100k avg daily volume. Penny stocks well below these minimum levels have been shown to benefit greatly from the model but introduce much more risk and may be distorted by inflows from readers selecting the same micro-cap stocks.
Conclusion
These stocks continue the live forward-testing of the breakout selection algorithms from my doctoral research with continuous enhancements over prior years. These Weekly Breakout picks consist of the shortest duration picks of seven quantitative models I publish from top financial research that also include one-year buy/hold value stocks. Remember to follow the Momentum Gauges® in your investing decisions for the best results.
All the V&M portfolio models are beating the market indices through the worst 6 month start since 1970. New mid-year value portfolios are again leading the major indices to start the next long term buy/hold period.
VMBreakouts.com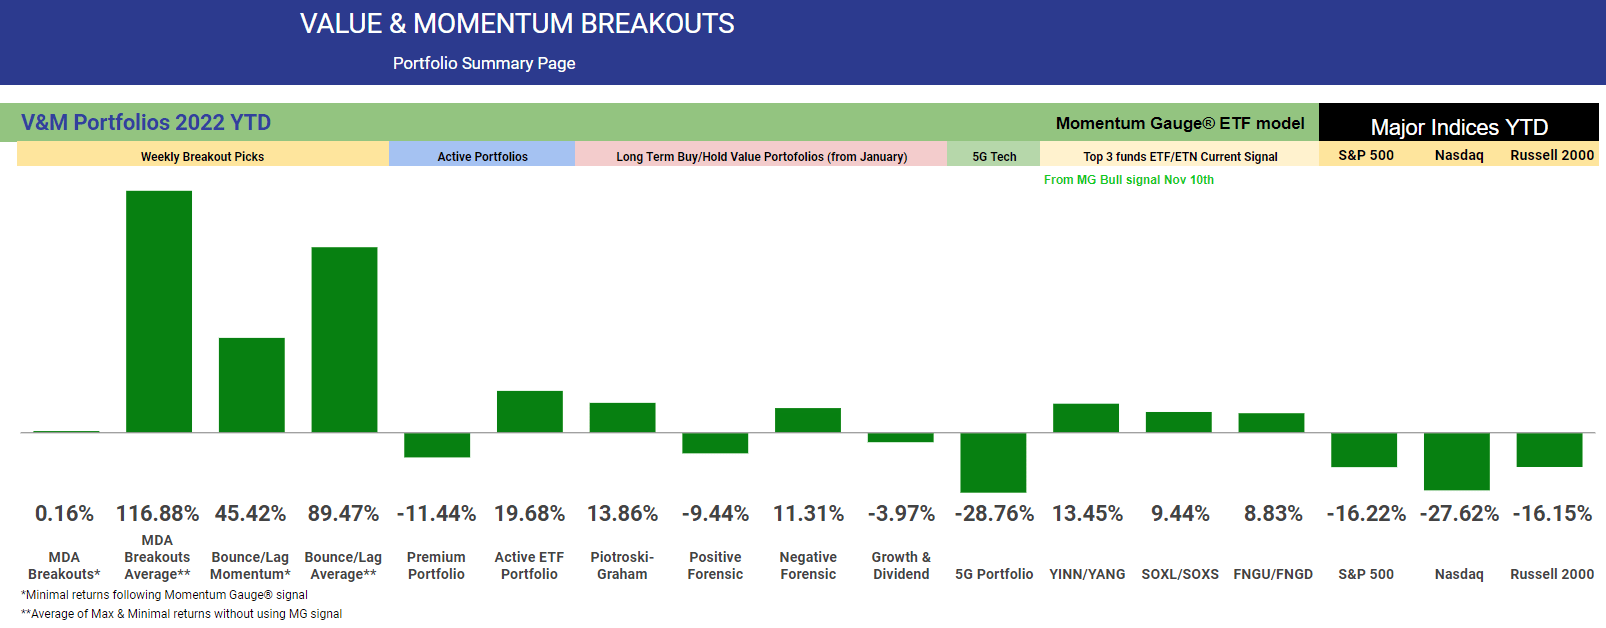
The final 2021 returns for the different portfolio models from January of last year are shown below.
VMBreakouts.com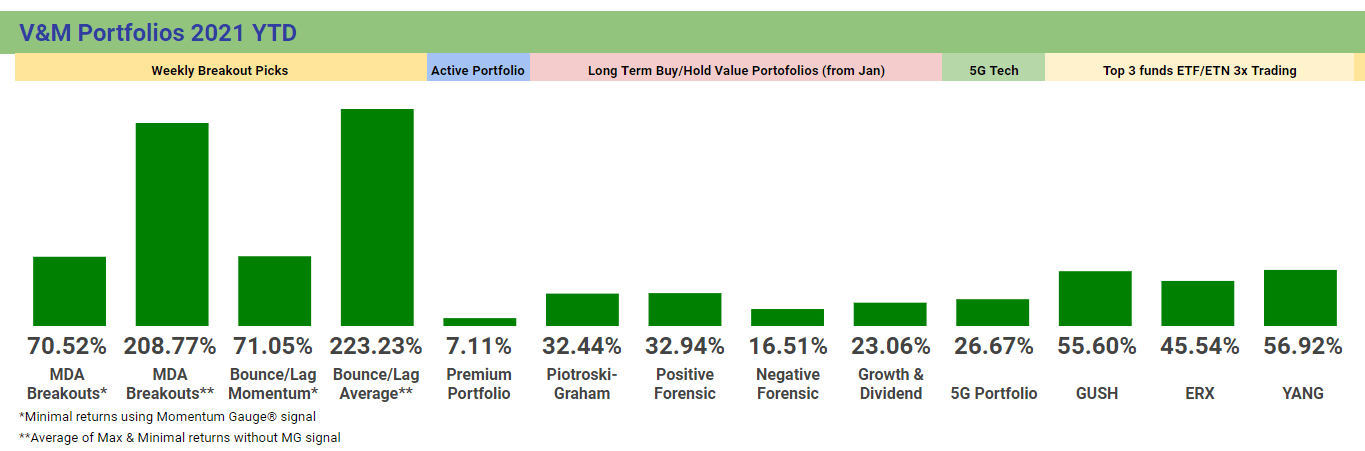
All the very best to you, stay safe and healthy and have a great week of trading!
JD Henning, PhD, MBA, CFE, CAMS
Be the first to comment