

Oat_Phawat
Introduction
The Toronto-based McEwen Mining (NYSE:MUX) released its third-quarter 2022 results on November 7, 2022. Also, on November 28, 2022, McEwen reported that the ongoing exploration program had identified four new gold veins in the Grey Fox area within the Fox Complex.
Finally, 2022 guidance was revised in 3Q22:
Revised guidance for 2022 production is 134,600-141,800 GEOs, reflecting a decrease of approximately 6,500 GEOs at Fox and 14,000 GEOs at Gold Bar due to carbonaceous material encountered throughout 2022, which should be alleviated with Gold Bar South beginning production, and an adjustment due to the gold:silver price ratio.
This article aims to look at the company’s recent history, including the third quarter earnings, and find a way to invest profitably in this company through fundamental and technical analysis. All charts in this article give several years of history.
Note: This article is an update of my article published on July 25, 2022. I have followed MUX on Seeking Alpha since July 2021.
Also, I will be using the most recent presentation published in November 2022.
1 – 3Q22 Results Snapshot
McEwen Mining counts three gold and silver producing mines and one development Project in Mexico.
MUX Assets presentation (MUX Presentation)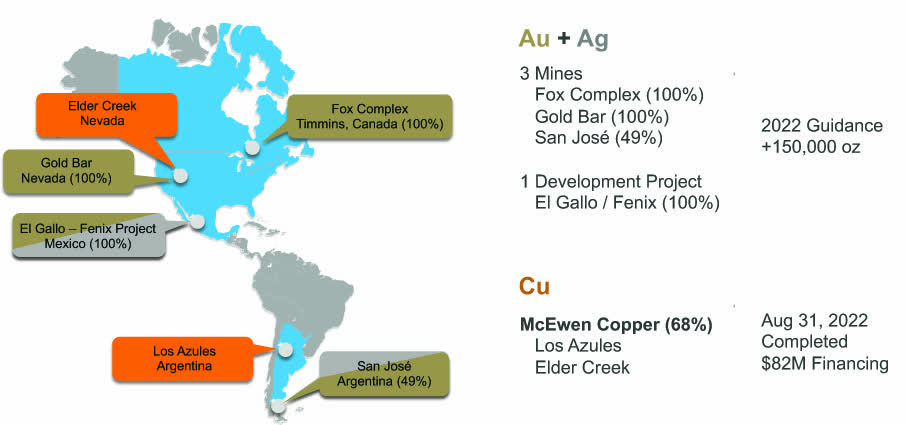
McEwen Mining came out with a third-quarter loss of $10.53 million or $0.21 per diluted share compared to a loss of $17.40 million or $0.38 per share in 3Q21. The net loss included $7.8 million invested in exploration and advancing the Los Azules project.
Revenues were $25.99 million, down from $37.13 million in 3Q21 and down 15.2% sequentially. Finally, the 3Q22 generic free cash flow from operations was a loss of $15.09 million.
MUX 3Q21 versus 3Q22 GEO Production (Fun Trading)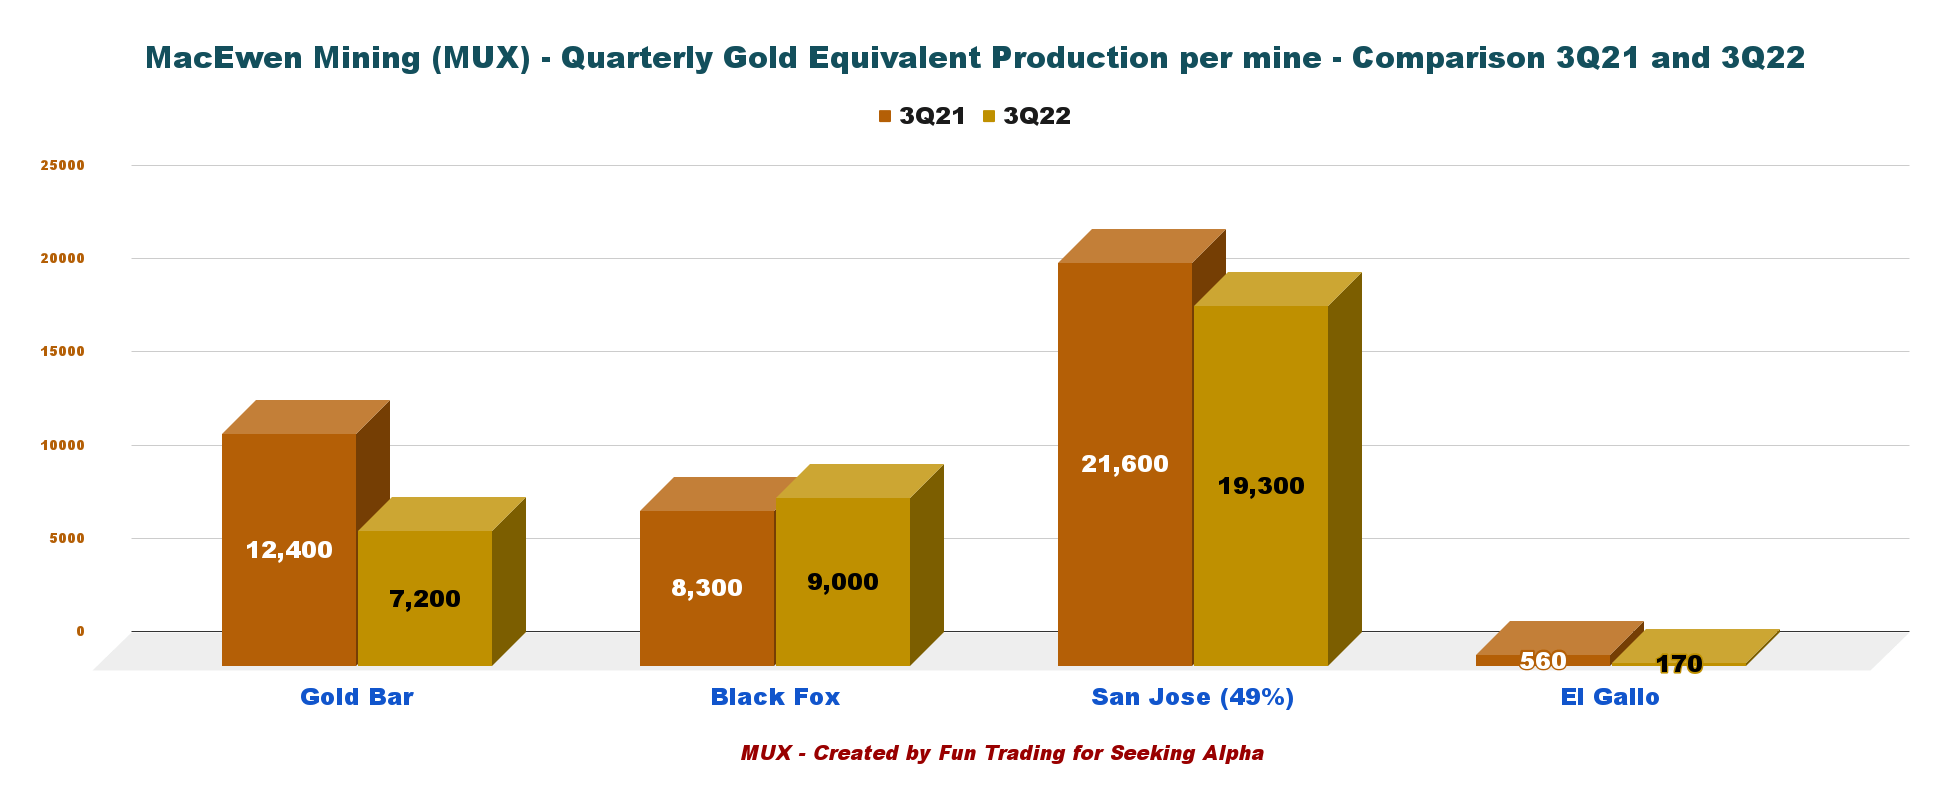
During Q3, we addressed a number of the overhanging concerns about McEwen Mining. First, the financing of McEwen Copper. We completed an $82 million financing in a really tough market. Not only did we complete it, but we have the second largest mining company in the world becoming a shareholder through its subsidiaries.
2 – Investment Thesis
McEwen Mining had been struggling in 2022, and it is realistic to look at the stock as mainly a trading tool.
However, despite a weak balance sheet, I see some great potential in 2023. Unfortunately, the free cash flow recurring loss and dismal AISC darken the picture a lot.
CEO Rob McEwen admitted that the company was financially struggling even though progress had been made during the third quarter. The company owns a subsidiary called McEwen Copper. On August 31, 2022, McEwen indicated that it owns 68.13%. In the 10-Q:
On August 31, 2022, the Company announced that McEwen Copper had closed its third and final tranche of the Series B private placement offering under which McEwen Copper issued 2,685,000 additional common shares at a price of $10.00 per share for gross proceeds of $26.9 million. As a result of the common shares issued, the Company’s 76.09% ownership in McEwen Copper was reduced by 7.96% to 68.13%.
McEwen Copper Ownership (MUX Presentation)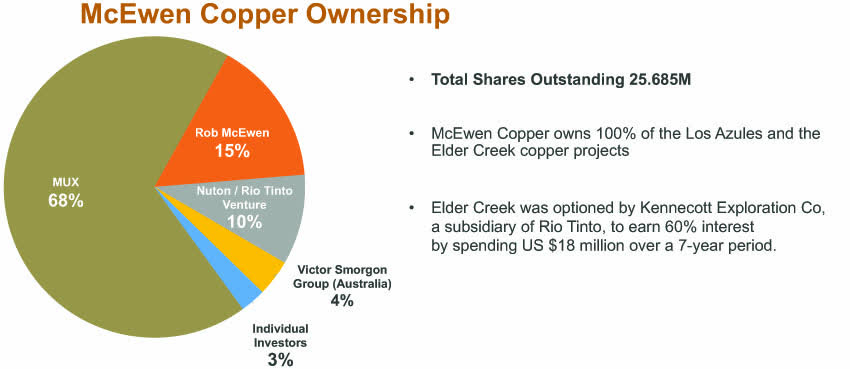
The company said that closing the $81.85 million financing was a critical step to fund activities necessary to complete an updated PEA (Preliminary Economic Assessment) for the Los Azules project.
Reminder: The company has been forced to declare a 1 for 10 reverse split to stay listed on the NYSE. The reverse split 1:10 was effective starting Tuesday, July 26, 2022.
Thus, it is prudent to trade short-term the stock here and keep only a tiny core position long-term.
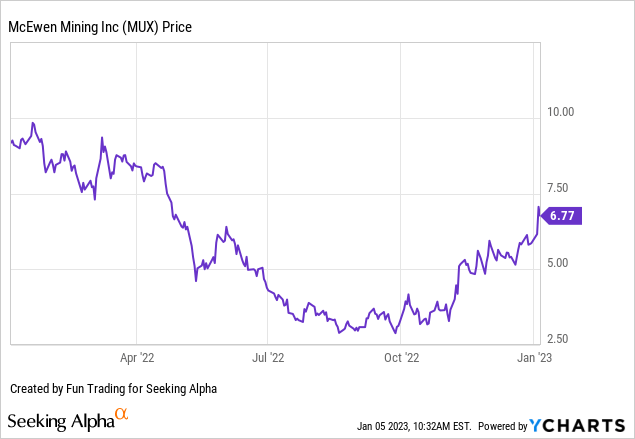
3 – Stock Performance
MUX is down 26% after a long slide that started around November 2021 and bottomed out in November 2022. MUX has significantly underperformed the VanEck Gold Miners (GDX).
MUX – Financial Snapshot History ending 3Q22: The Raw Numbers
Note: Numbers are indicated in US$.
| MUX | 3Q21 | 4Q21 | 1Q22 | 2Q22 | 3Q22 |
| Total Revenues $ million | 37.13 | 34.97 | 25.54 | 30.65 | 25.99 |
| Quarterly Earnings in $ million | -17.40 | -20.86 | -19.33 | -12.45 | -10.53 |
| EBITDA $ million | -10.77 | -12.56 | -16.63 | -6.88 | -4.58 |
| EPS (diluted) $ Per Share | -0.38 | -0.41 | -0.40 | -0.26 | -0.21 |
| Operating Cash Flow $ million | -11.00 | -1.15 | -15.62 | -28.74 | -6.20 |
| CapEx in $ | 8.11 | 6.41 | 4.05 | 4.21 | 8.89 |
| Free Cash Flow | -19.11 | -7.55 | -19.67 | -32.94 | -15.09 |
| Total Cash in $ million | 64.94 | 56.09 | 66.21 | 46.42 | 56.31 |
| Total LT Debt in $ million | 46.68 | 48.87 | 63.55 | 63.69 | 63.83 |
| Shares Outstanding (diluted) | 45.92 | 45.93 | 46.40 | 47.43 | 50.78 |
| Gold and Silver Production | 3Q21 | 4Q21 | 1Q22 | 2Q22 | 3Q22 |
| Quarterly Gold Equivalent Oz GEOs | 42,860 | 40,150 | 25,170 | 36,100 | 35,653 |
| Quarterly Au Production Oz | 32,100 | 31,300 | 20,850 | 27,600 | 26,200 |
| Quarterly Silver production Oz | 792,000 | 682,700 | 336.500 | 704.600 | 853.000 |
Source: Company release 10-Q filing
McEwen Mining – Gold Production and Balance Sheet Details
1 – Revenues and Trends. Revenues were $25.99 million in 3Q22
MUX Quarterly Revenues history (Fun Trading) The third-quarter revenues were $25.99 million, down from $37.13 million in the same quarter a year ago. Net loss was $10.53 million or $0.21 per diluted share, of which $7.8 million was related to the Los Azules project expenditures and $5 million on the continued exploration at Canadian and US operating sites. Cash from operations was a loss of $6.20 million.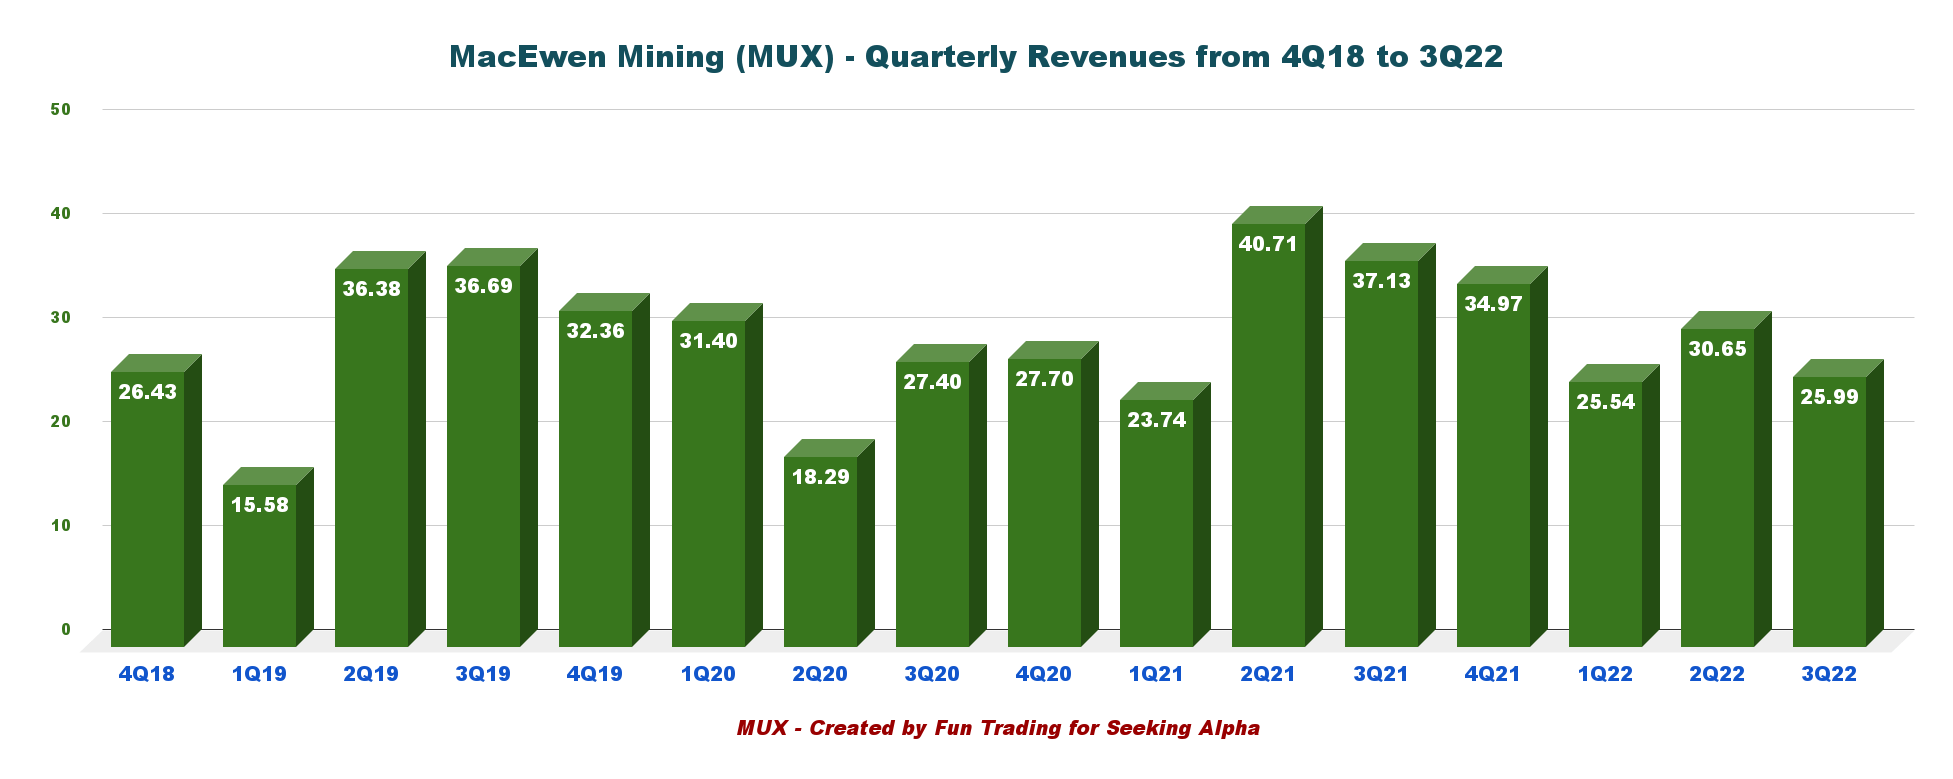
2 – Free cash flow was a loss of 15.09 million in 3Q22
MUX Quarterly Free cash flow history (Fun Trading) Note: Generic free cash flow is the cash from operations minus CapEx. It may differ from the company calculation.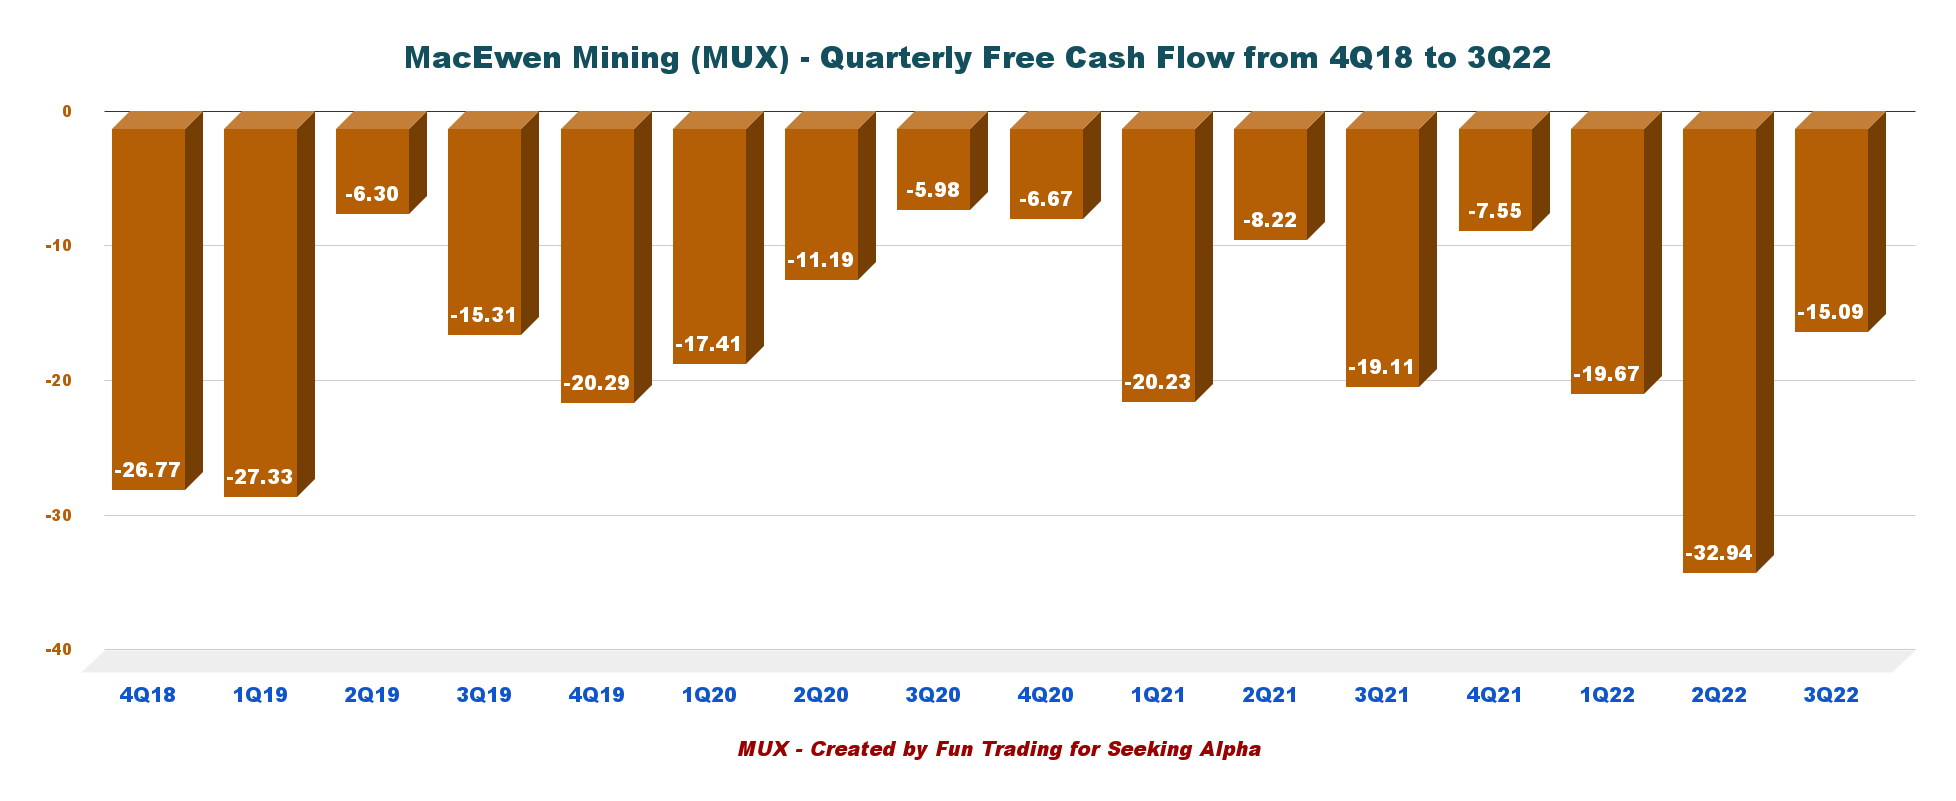
Trailing 12-month free cash flow ttm was a loss of $75.25 million, and the free cash flow for the third quarter was a loss of $15.09 million.
CapEx for McEwen copper and other mines has been relatively high and affects the free cash flow.
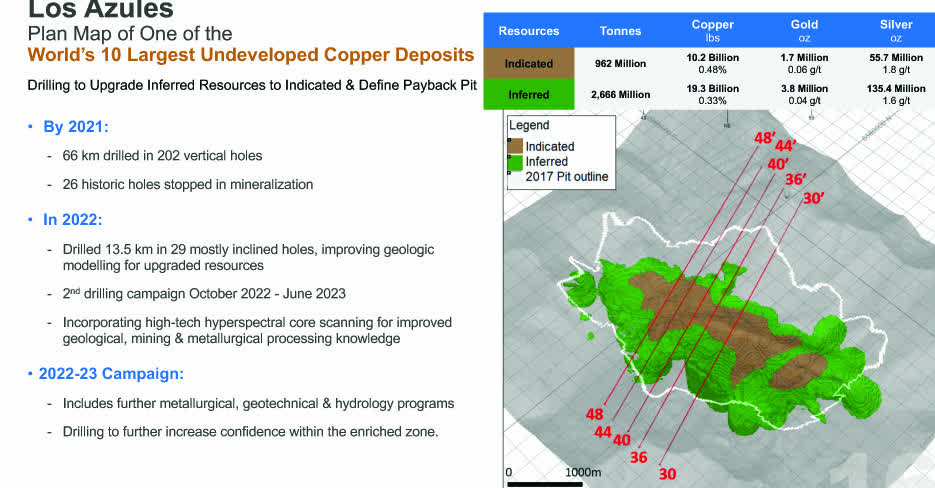
3 – Debt situation and the Los Azules copper project
MUX Quarterly Cash versus Debt history (Fun Trading) The total cash was $56.31 million at the end of September 2022. Long-term debt is $63.83 million. The Los Azules project (68.13% owned by MUX) has been the main focus of the company: MUX Los Azules valuation (MUX Presentation) It is an excellent copper project but with an initial CapEx of $2.4 billion that could go much higher with the recent inflationary pressures. However, I wonder if McEwen is not trying to bite off more than it can chew.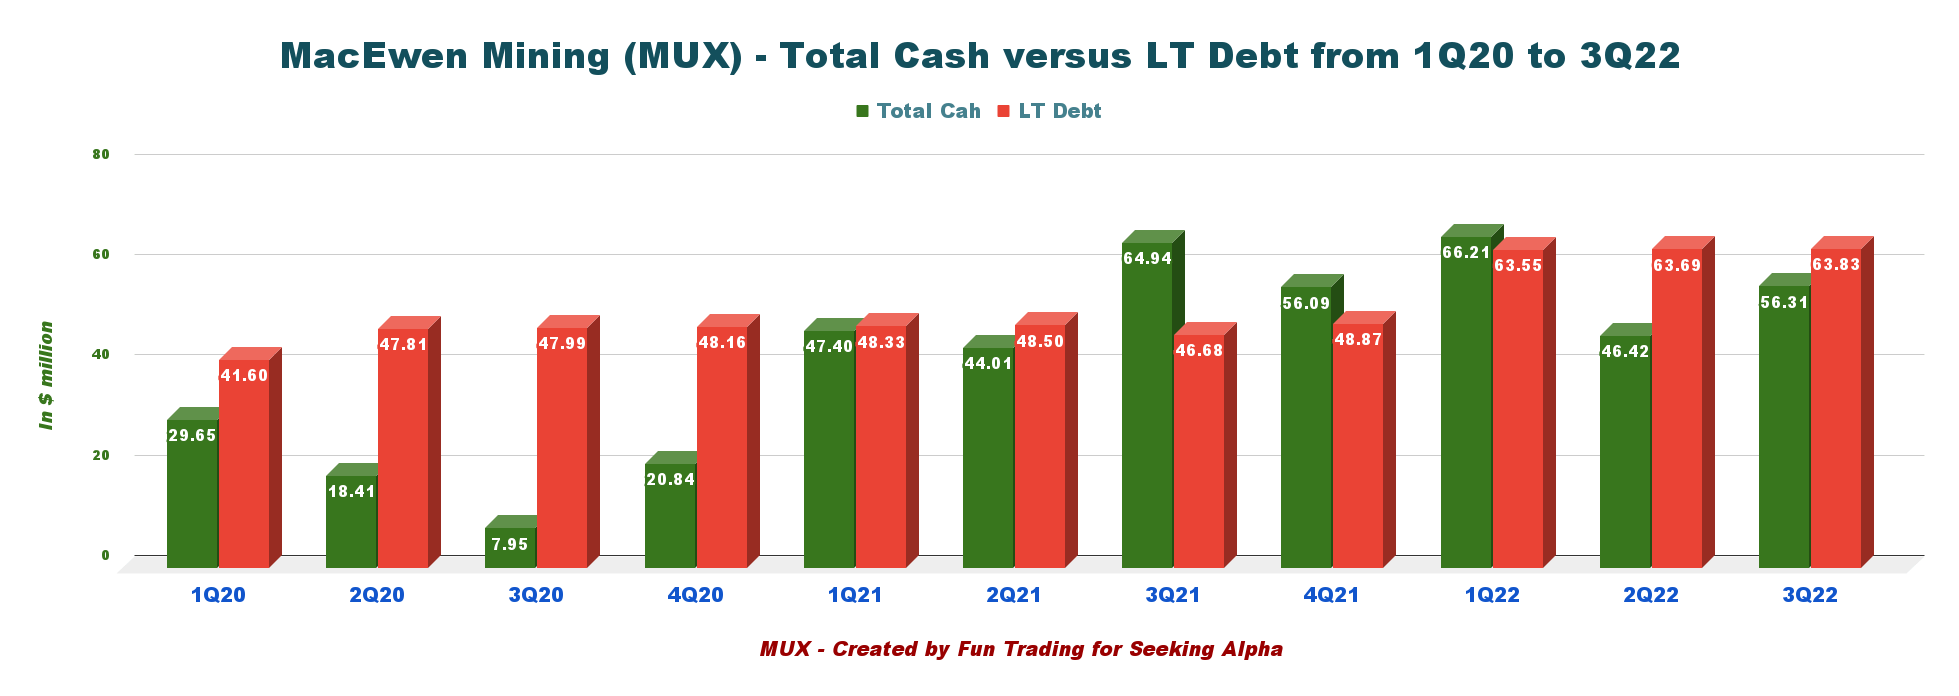
4 – Gold Equivalent production details. The company produced 35,633 GEOs in 3Q22
4.1 – Production in GEOs
MUX Quarterly gold equivalent production history (Fun Trading) Gold Equivalent production was 35,653 Au Eq. Oz, down significantly from 42,874 Au Eq. Oz in 3Q21. The company experienced technical issues at Fox. The COO, William Shaver, said in the conference call: Unfortunately, we have continued to have some mechanical issues in the Fox processing plant that have constricted the availability in the plant to approximately 77% for the quarter. This has allowed this stockpiled ore to increase substantially over the quarter. In October, the plant availability was significantly better, at 90%, based on a nominal rate of 50 tons per hour or 1,200 tons a day. Thus, the plant operated at approximately 1,100 tons a day.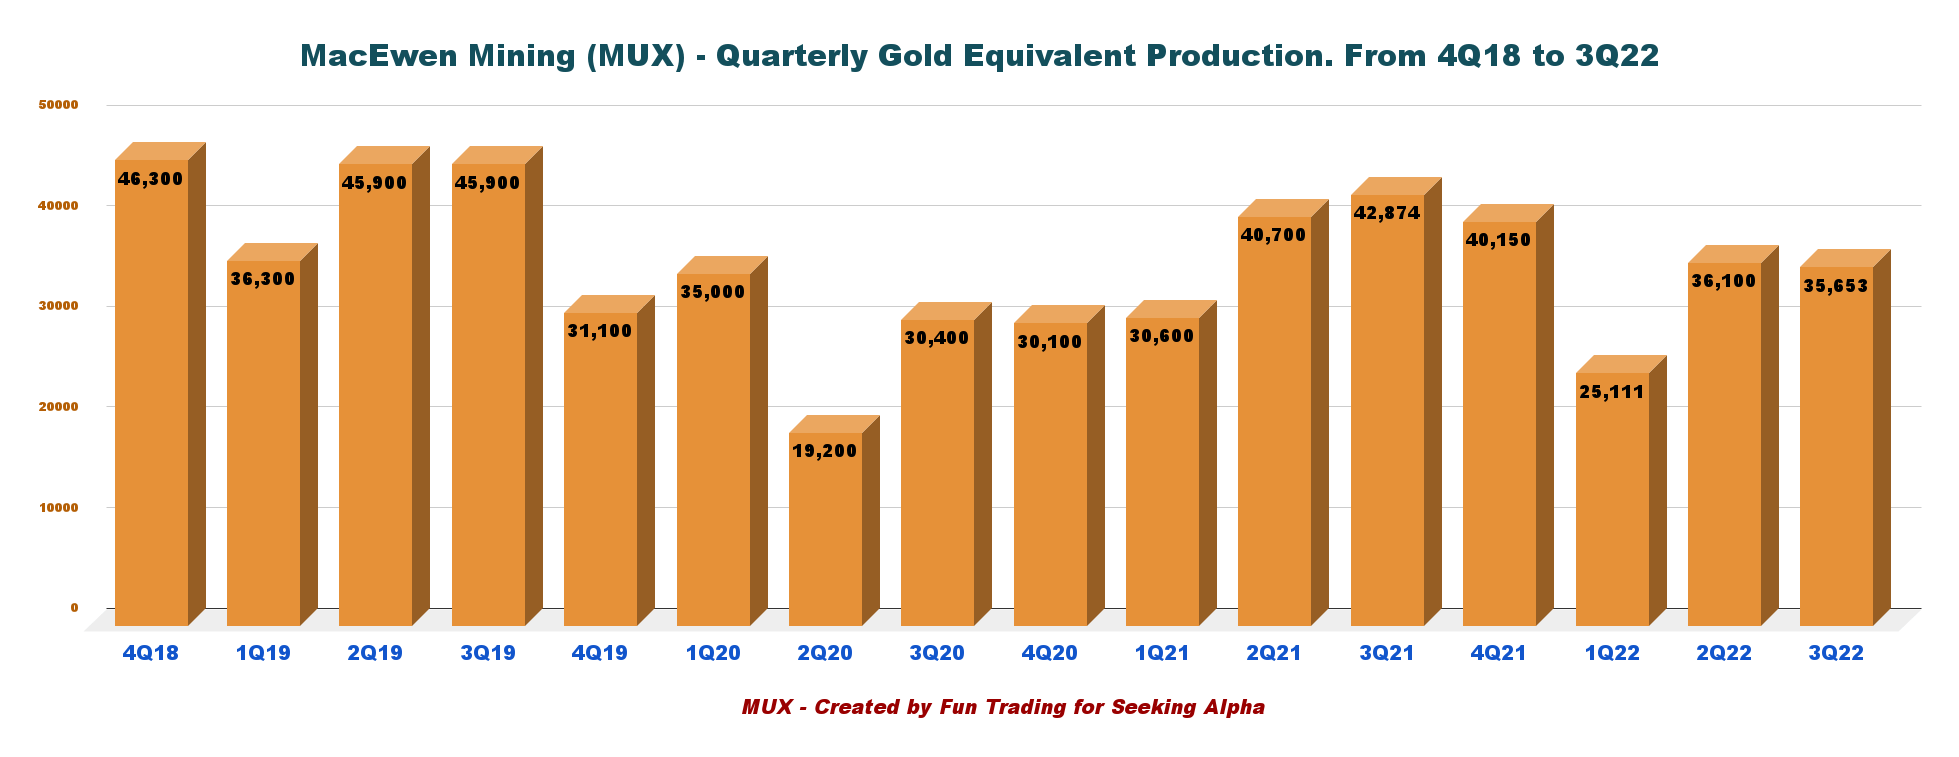
4.2 – Production details per mine:
MUX Quarterly production per mine history (Fun Trading) Also, El Gallo is coming to the end of its life with only 170 GEOs for the third quarter. CEO McEwen said: In Mexico, it looked like we are coming to the end of the life of the mine. We did have a feasibility study there for a project called Fenix, and we’ve improved the economics of it considerably with the purchase of a process plant on very advantageous terms.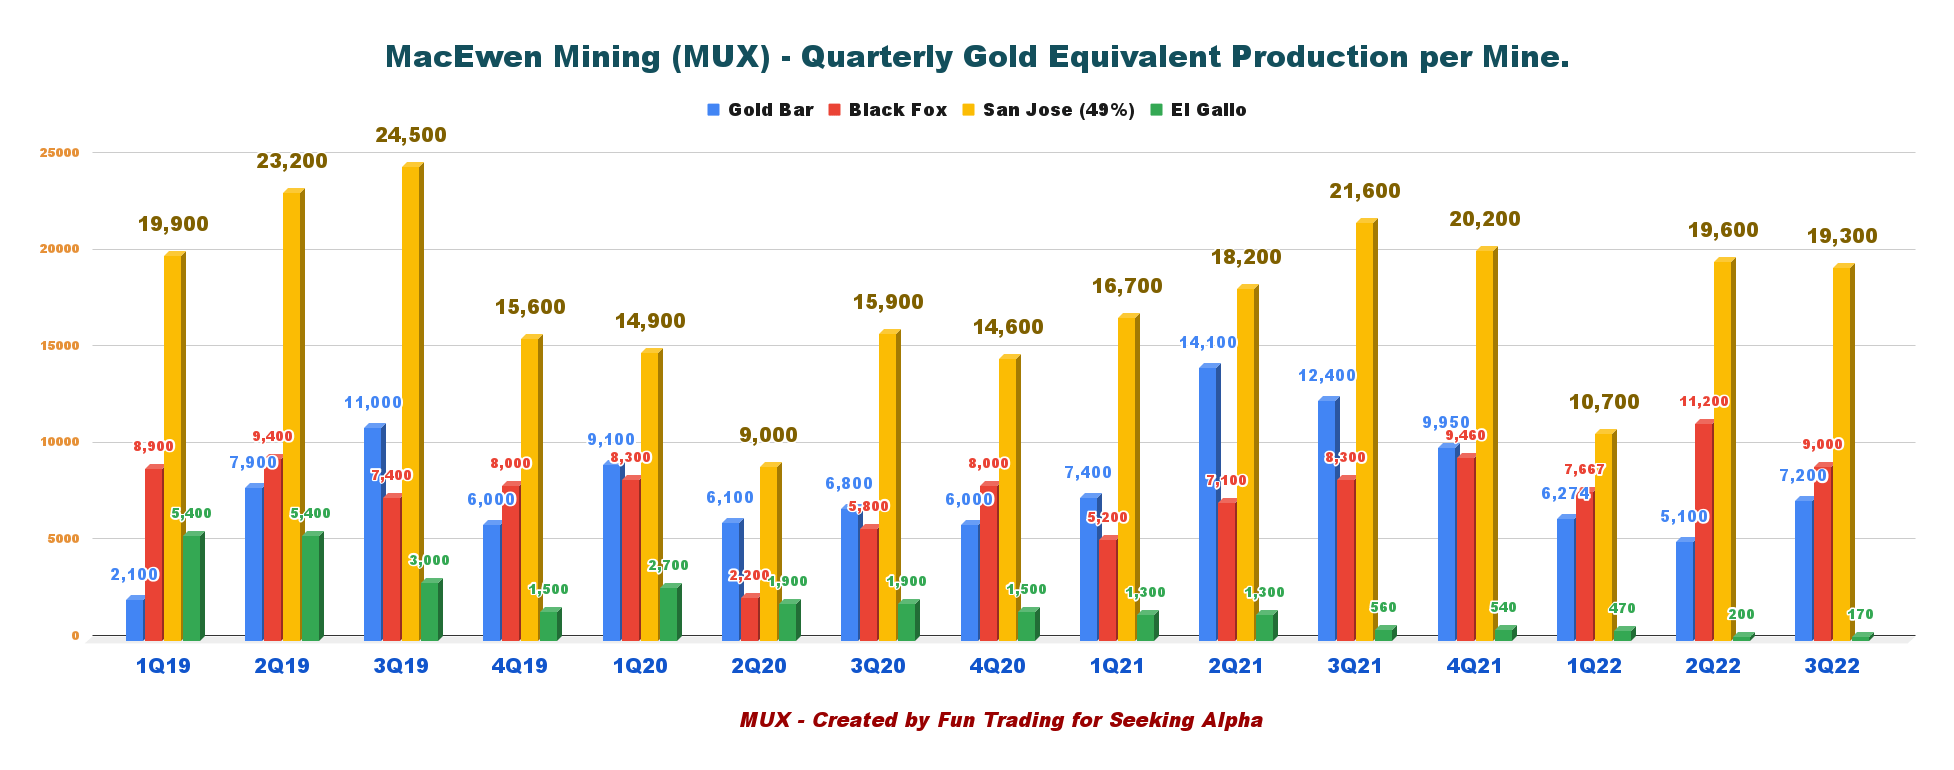
4.3 – All-in Sustaining costs – AISC and gold price received for 3Q22
MUX San Jose and AISC (Fun Trading) AISC at the San Jose mine was $1,562 per ounce in 3Q22.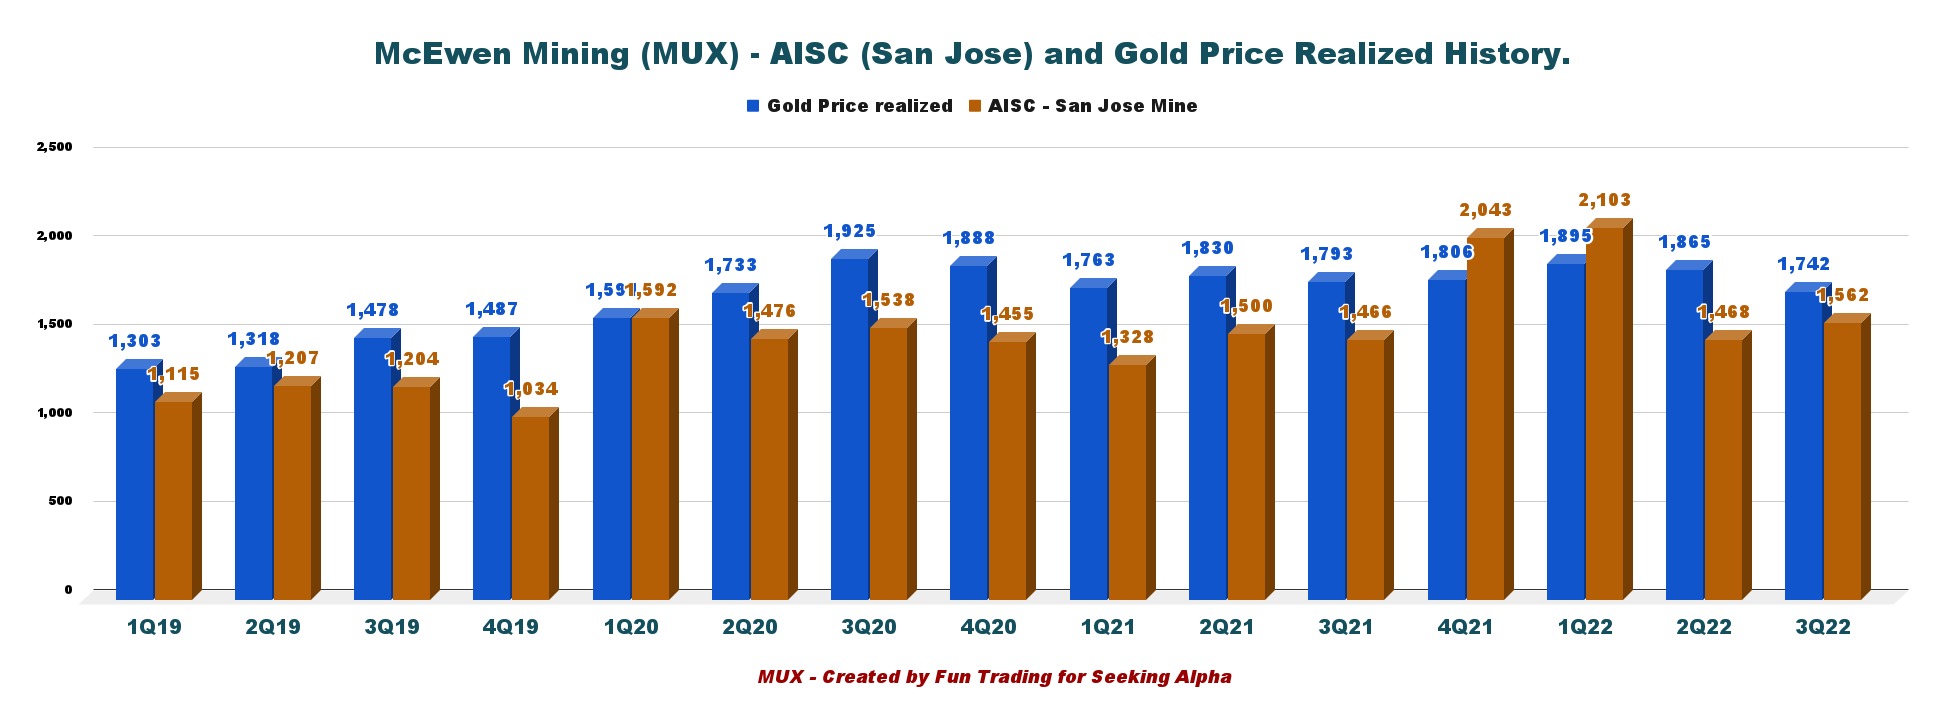
5 – 2022 Guidance (revised down this quarter)
The company expects production of 134.6K to 141.8K GEOs (forecast of 135.7K GEOs in December), down from the preceding 153K to 172K GEOs in 2022.
However, on December 21, 2022, the company indicated that operations are performing better in 4Q22 and added 2023 guidance of 150K-170K GEOs.
MUX 2022-2023 guidance (MUX Press release)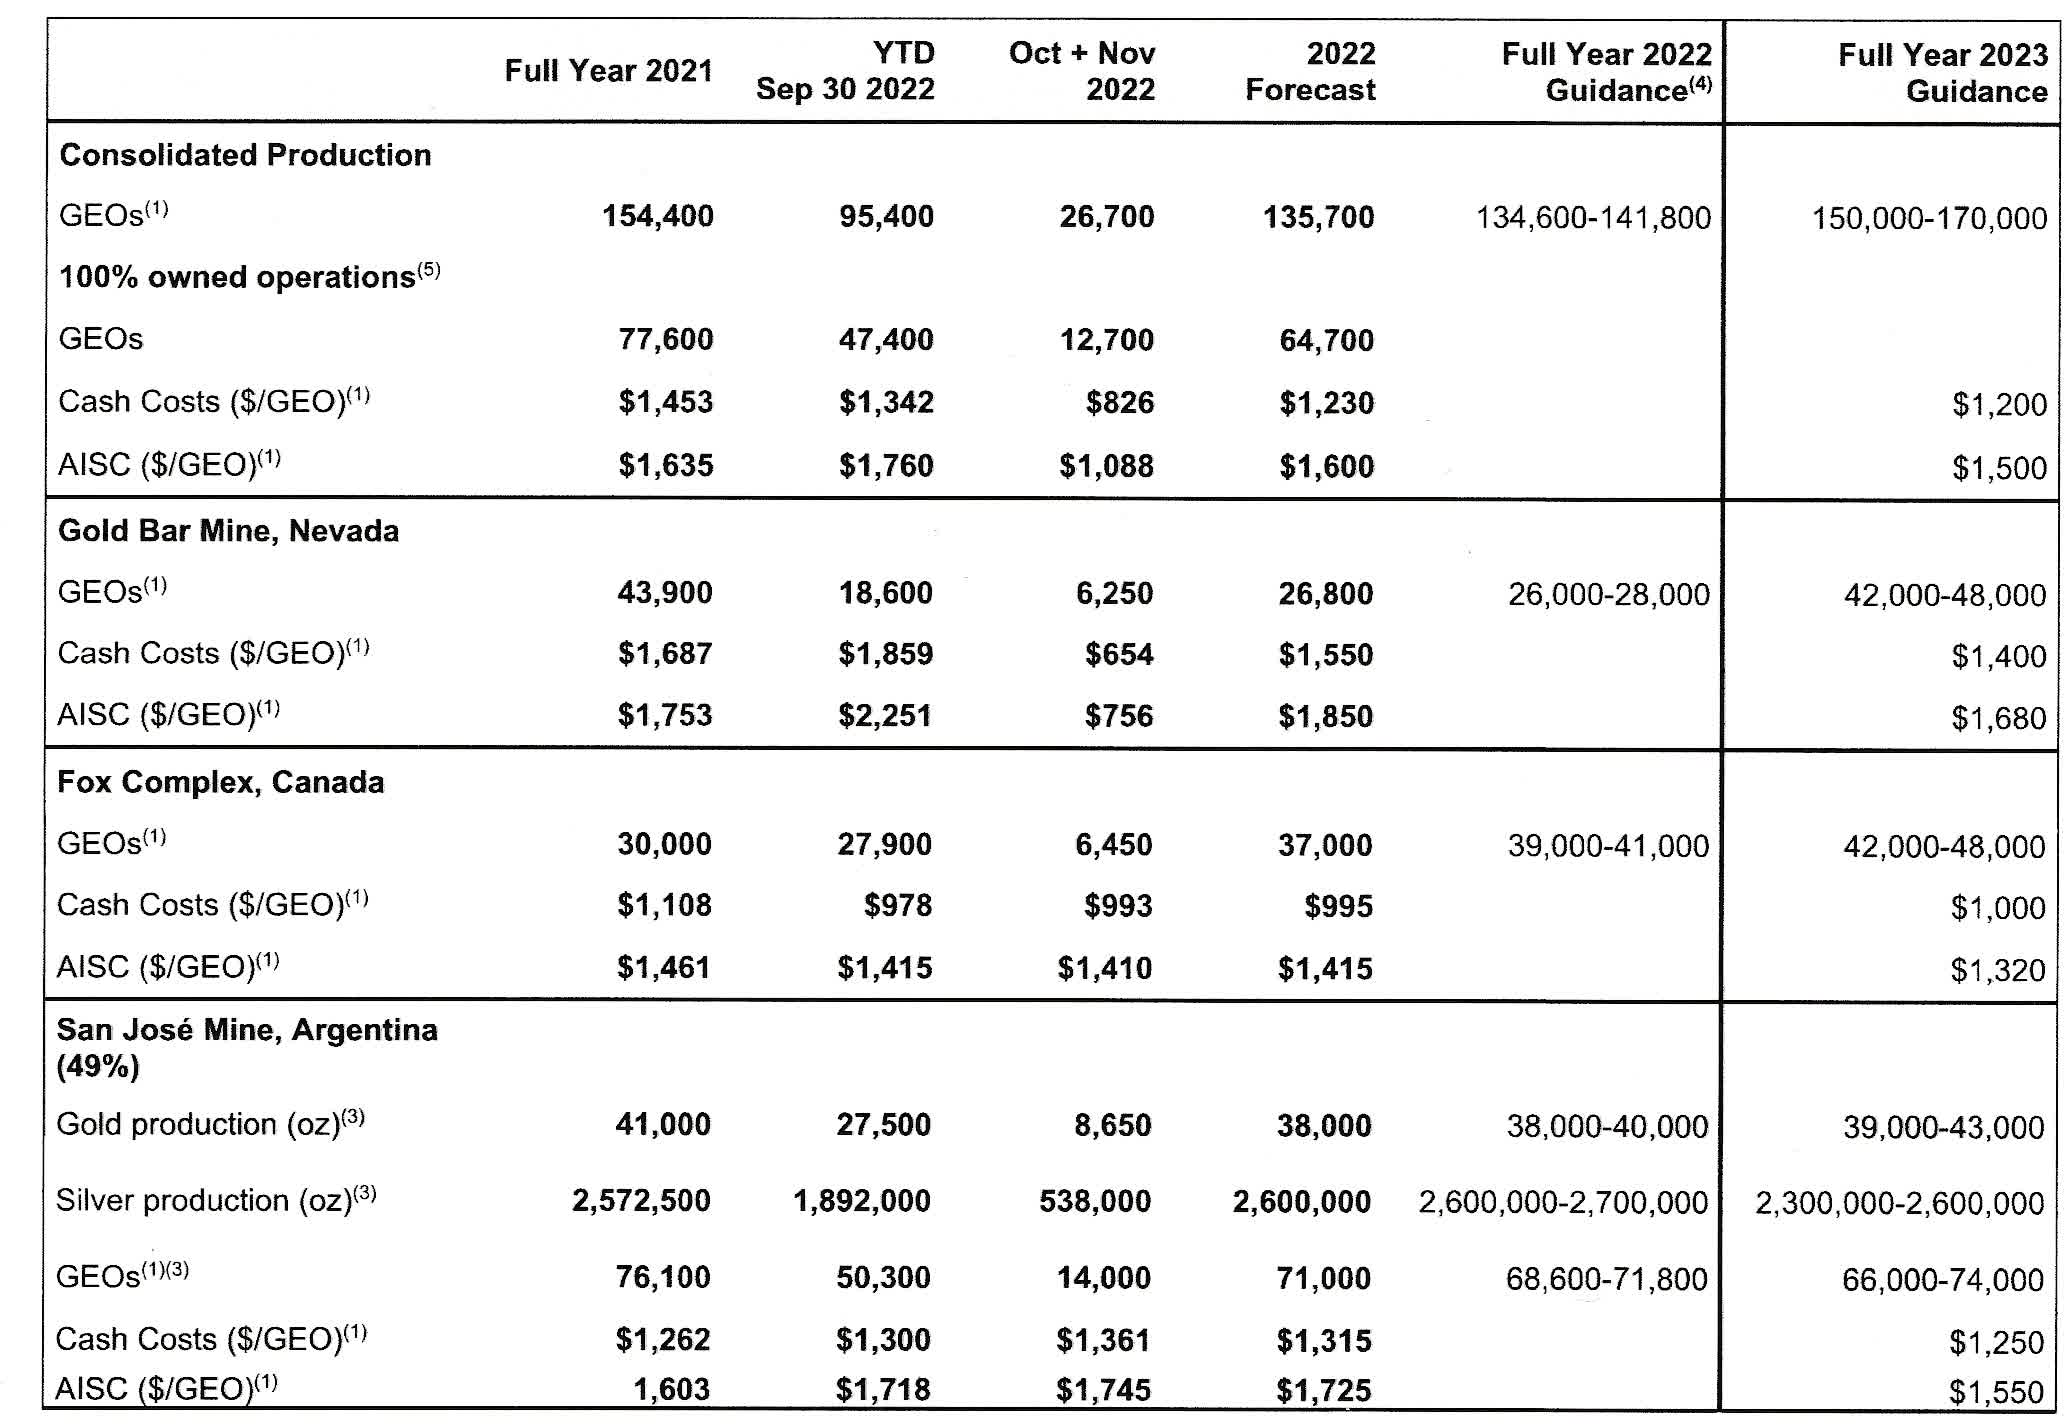
Technical Analysis (short term) and Commentary
MUX TA Chart short-term (Fun Trading StockCharts)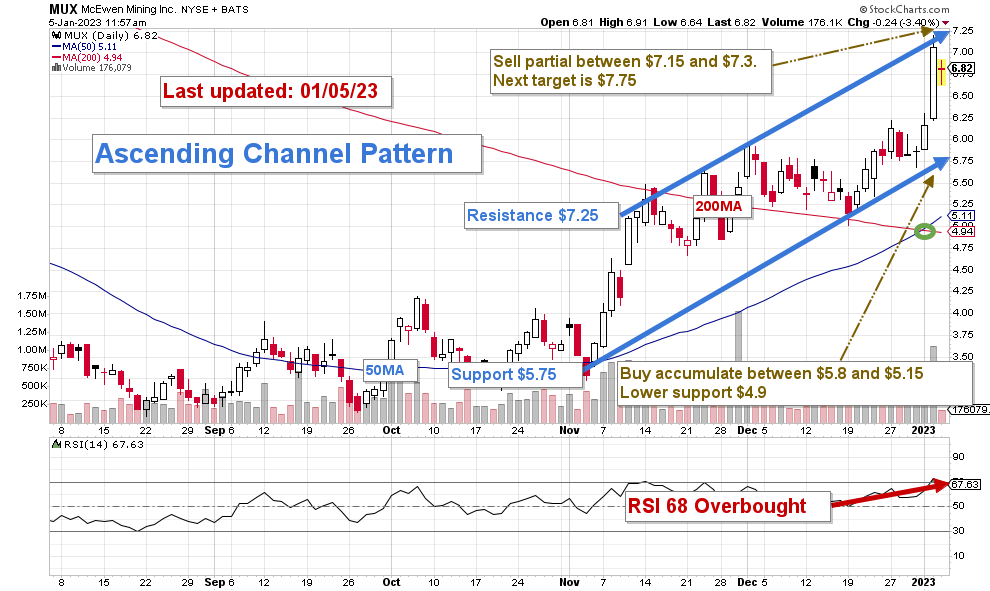
MUX forms an ascending wedge pattern with resistance at $7.25 and ascending support at $5.75. The stock has jumped significantly since the company announced a reverse split to stay compliant with its NYSE listing.
Ascending channel patterns or rising channels are short-term bullish in that a stock moves higher within an ascending channel, but these patterns often form within longer-term downtrends as continuation patterns. The ascending channel pattern is often followed by lower prices.
I suggest selling LIFO about 75% of your position between $7.15 and $7.3 with higher resistance at $7.75 and accumulating on any weakness between $5.8 and $5.15 with possible lower support at $4.90. The RSI is now 68 and signals an overbought situation which confirms the potential selling level.
The strategy buy-sell-rinse-repeat is the best path for this stock.
Warning: The TA chart must be updated frequently to be relevant. It is what I am doing in my stock tracker. The chart above has a possible validity of about a week. Remember, the TA chart is a tool only to help you adopt the right strategy. It is not a way to foresee the future. No one and nothing can.
Author’s note: If you find value in this article and would like to encourage such continued efforts, please click the “Like” button below to vote for support. Thanks.
Be the first to comment