

Justin Sullivan/Getty Images News
In this analysis of McDonald’s Corp. (NYSE:MCD), we examined its company-operated store growth as it plans to expand its store count this year. We compared it with its franchise stores in terms of revenue and margins. Then, we projected its company store sales based on its planned expansion and historical revenue per store growth.
Moreover, we looked into McDonald’s franchise business in terms of its revenue contribution and franchise store growth. We analyzed the advantage of opening a McDonald’s franchise to a franchisee in terms of the average profit per store and compared it against competitors to support our growth forecast of its franchisee business based on its historical store and revenue.
Lastly, we examined the company’s position in the global fast-food market in terms of its market share. We compared it with its competitors in terms of its branding measured by its store locations and followers. Then, we projected their store growth and revenue per store growth to project the market share of the company and its competitors.
The Shift from Company-Operated Stores
Based on its annual report, McDonald’s operated 40,031 total stores worldwide. Its stores are segmented into franchise stores and company-operated stores. In the past 10 years, its company-operated stores had been in decline while its franchise stores grew. In total, McDonald’s stores over the period had flattish growth. However, its company-operated stores had positive growth in 2020 and 2021.
|
McDonald’s Store Count |
2013 |
2014 |
2015 |
2016 |
2017 |
2018 |
2019 |
2020 |
2021 |
Average |
|
Franchise Stores |
28,691 |
29,544 |
30,081 |
31,230 |
34,108 |
35,085 |
36,059 |
36,521 |
37,295 |
|
|
Growth % |
2.9% |
3.0% |
1.8% |
3.8% |
9.2% |
2.9% |
2.8% |
1.3% |
2.1% |
3.3% |
|
Company Operated |
6738 |
6714 |
6444 |
5669 |
3133 |
2770 |
2636 |
2677 |
2736 |
|
|
Growth % |
2.1% |
-0.4% |
-4.0% |
-12.0% |
-44.7% |
-11.6% |
-4.8% |
1.6% |
2.2% |
-6.9% |
|
Total Stores |
35,429 |
36,258 |
36,525 |
36,899 |
37,241 |
37,855 |
38,695 |
39,198 |
40,031 |
|
|
Growth % |
2.8% |
2.3% |
0.7% |
1.0% |
0.9% |
1.6% |
2.2% |
1.3% |
2.1% |
1.7% |
Source: McDonald’s
The company’s management had also previously announced plans to close more stores in future years, such as over 100 stores in Walmart (WMT) locations with low volume as the company focuses on online delivery and drive-thru. To forecast its company-operated segment, we first forecasted its store count based on a 10-year growth rate. Then, we factored in its revenue per store which we assumed to grow at its 10-year growth rate to derive our total company-operated sales forecast.
|
Company Operated Stores Segment Forecast |
2019 |
2020 |
2021 |
2022F |
2023F |
2024F |
2025F |
2026F |
|
Company Operated Store Count |
2636 |
2677 |
2,736 |
2,547 |
2,371 |
2,207 |
2,054 |
1,912 |
|
Growth % |
-4.8% |
1.6% |
2.2% |
-6.9% |
-6.9% |
-6.9% |
-6.9% |
-6.9% |
|
Company-operated Revenue per store |
3,573,596 |
3,040,717 |
3,577,266 |
3,706,599 |
3,840,608 |
3,979,461 |
4,123,335 |
4,272,411 |
|
Growth % |
-1.1% |
-14.9% |
17.6% |
3.6% |
3.6% |
3.6% |
3.6% |
3.6% |
|
Company-operated Revenue ($ bln) |
9.42 |
8.14 |
9.79 |
9.44 |
9.10 |
8.78 |
8.47 |
8.17 |
|
Growth % |
-5.9% |
-13.6% |
20.2% |
-3.5% |
-3.5% |
-3.5% |
-3.5% |
-3.5% |
Source: McDonald’s, Khaveen Investments
Based on McDonald’s annual reports, we calculated several metrics based on store growth, revenue, and margins to compare the difference between its franchise stores and company-operated stores.
|
Store Comparison |
Franchise Stores |
Company Operated |
|
Store Count |
37,295 |
2,736 |
|
Average 10-year Store Growth |
3.3% |
-6.9% |
|
Revenue Per Store |
$350,851 |
$3,577,266 |
|
Gross Profit Per Store |
$288,242 |
$635,965 |
|
Average 10-year Revenue Per Store Growth |
3.7% |
-2.3% |
|
Average 10-year Revenue Growth |
7.2% |
-5.1% |
|
Gross Margins |
82.2% |
17.8% |
Source: McDonald’s, Khaveen Investments
From the table above, we see that while McDonald’s franchise stores have a higher store count, its company-operated stores bring in more revenues to the company per store at nearly 10 times greater than franchise stores as the company collected franchising fees from its franchisees. Although its company-operated store count had declined on average, its revenue per store increased over the period more than its franchise stores. Despite that, its revenue growth in the past 10 years from company-operated stores contracted which contrasts with its franchise store total revenue growth. In terms of profitability, franchise stores earn the company a significantly higher margin than company-operated stores.
Based on its annual report, besides delivering great customer experiences, the company also believes franchising is important in driving its profitability. This is evident as the company’s margins had been increasing as it closed down its less profitable company-operated stores and expanded its franchise business.
McDonald’s, Khaveen Investments
Overall, as the company expanded its more profitable franchising business and closed down its company-operated stores with lower margins, the increase of its profitability over the past 10 years demonstrates the company’s success in improving its profitability. We expect its margins to continue rising as it expands its franchising business faster than its company-operated stores.
Franchise Business Expansion
McDonald’s depends on its franchising business as 93% of its stores worldwide are franchised businesses according to its annual report. To identify the attractiveness of McDonald’s franchises, we compared the company’s franchise against competitors in terms of average revenue, cost, profit, initial fees and average 5-year franchise store count growth.
|
Franchise Comparison |
Average Franchise Store Revenue ($ mln) |
Average Franchise Cost ($ mln) |
Average Franchise Profit per store ($ mln) |
Margin % |
Average Franchise Fee ($ mln) |
Franchise Store Growth % (5-year) |
|
McDonald’s |
2.70 |
2.55 |
0.15 |
5.6% |
1.39 |
3.3% |
|
KFC |
0.98 |
0.86 |
0.12 |
12.2% |
2.11 |
6.4% |
|
Burger King |
1.35 |
1.18 |
0.18 |
13.0% |
1.87 |
3.6% |
|
Subway* |
0.42 |
0.39 |
0.03 |
7.3% |
0.32 |
-3.4% |
|
Domino’s (DPZ) |
0.98 |
0.84 |
0.14 |
14.3% |
0.38 |
6.3% |
|
Pizza Hut |
0.71 |
0.61 |
0.10 |
14.0% |
1.22 |
2.5% |
|
Papa Johns (PZZA) |
0.78 |
0.71 |
0.07 |
8.6% |
0.39 |
3.2% |
|
Taco Bell |
1.50 |
1.34 |
0.16 |
10.7% |
1.97 |
4.4% |
|
Wendy’s (WEN) |
1.20 |
1.13 |
0.07 |
5.5% |
2.79 |
1.0% |
|
Average |
1.16 |
1.04 |
0.12 |
10.6% |
1.38 |
3.0% |
*3-year average
Source: Franchise Direct, Business Insider, Vetted Biz, ICSID, Khaveen Investments
Based on the table above, McDonald’s franchisees have the highest average revenue among competitors which highlights their strong ability to generate sales. However, operations of the franchise have high costs compared to competitors as it has the lowest margins. On the other hand, franchises such as Wendy’s have the highest margins despite being below average in terms of sales. This is followed by Pizza Hut (Yum Brands) (YUM) and Burger King (Restaurant Brands International) (QSR). However, according to Franchise Direct, in terms of initial fees, several competitors such as KFC, Burger King, Taco Bell and Wendy’s have higher fees than McDonald’s which we believe highlights a potential barrier for franchise owners and potentially benefitting the company to build up stores. That said, other companies also have lower initial fees and higher margins than McDonald’s which are Subway, Domino’s, Pizza Hut and Papa John’s. In terms of past 5-year store growth, KFC had the highest growth followed by Domino’s, whereas McDonald’s had higher than average growth.
We projected the growth of its franchise business also based on store count growth and revenue per store growth at a 10-year historical growth rate to obtain our total franchised restaurants revenue growth forecast.
|
McDonald’s Franchise Business |
2019 |
2020 |
2021 |
2022F |
2023F |
2024F |
2025F |
2026F |
|
Franchise Stores |
36,059 |
36,521 |
37,295 |
38,516 |
39,778 |
41,080 |
42,426 |
43,815 |
|
Growth % |
2.8% |
1.3% |
2.1% |
3.3% |
3.3% |
3.3% |
3.3% |
3.3% |
|
Franchised restaurants revenue per store |
323,359 |
293,804 |
350,851 |
354,779 |
358,752 |
362,768 |
366,830 |
370,937 |
|
Growth % |
3.0% |
-9.1% |
19.4% |
1.1% |
1.1% |
1.1% |
1.1% |
1.1% |
|
Franchised restaurants revenue ($ bln) |
11.66 |
10.73 |
13.085 |
13.66 |
14.27 |
14.90 |
15.56 |
16.25 |
|
Growth % |
5.9% |
-8.0% |
21.9% |
4.4% |
4.4% |
4.4% |
4.4% |
4.4% |
Source: McDonald’s, Khaveen Investments
All in all, franchise stores are crucial for the company’s business as it accounts for 93% of its total stores. When comparing it to other franchises, although it has the highest average revenue per store, its margins are compressed due to high operating costs which could hinder its competitiveness. However, its initial fees are lower than several competitors which reduces the barrier for franchise owners to open a McDonald’s store. That said, we see competition being tough as several competitors including Subway, Domino’s, Pizza Hut and Papa John’s not only have lower initial fees but also higher margins.
Stagnant Market Share as Competition Heats Up
Company Data, Khaveen Investments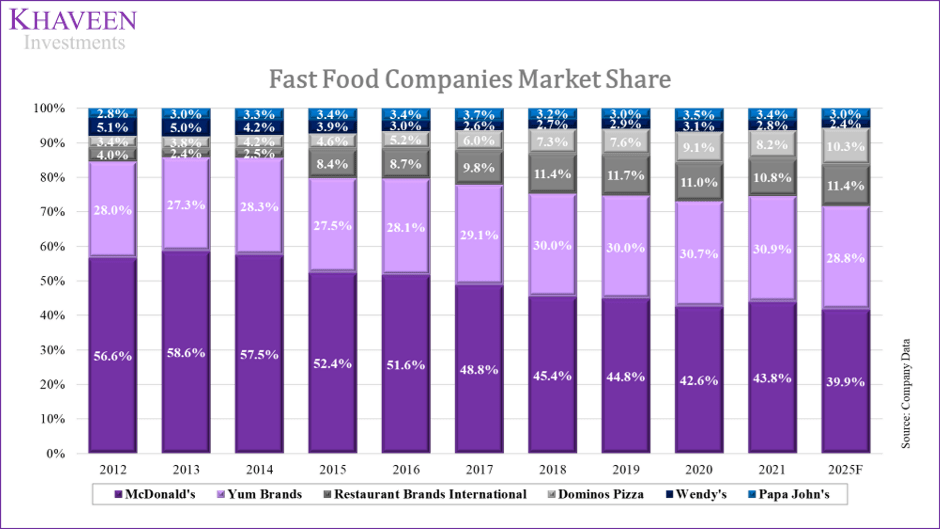
|
Companies |
Market Share (2021) |
Past 10-year Revenue Growth % |
|
McDonald’s |
43.8% |
-1.5% |
|
Yum Brands (Including Yum China) |
30.9% |
2.2% |
|
Restaurant Brands International |
10.8% |
26.6% |
|
Domino’s Pizza |
8.2% |
11.3% |
|
Wendy’s |
2.8% |
-4.9% |
|
Papa John’s |
3.4% |
3.7% |
|
Total |
1.1% |
Source: Company Data, Khaveen Investments
In the past 10 years, we see that McDonald’s market share had been eroded by rising competition from its competitors including Yum Brands, Restaurant Brands International and Domino’s Pizza. Notwithstanding, McDonald’s remained as market leader trailed by Yum Brands. Among its closest competitors operating burger fast-food chains, Restaurant Brands International which owns Burger King had been gaining share, but Wendy’s share growth was stagnant. Between the pizza chains, Domino’s fared better than Papa John’s as it gained more share and maintained its lead over the company.
To analyze its branding, we looked into each company’s stores and followers on Facebook (FB). Then, we projected each company’s growth based on their historical store growth and revenue growth to project the market share.
|
Companies |
Stores |
Past 10-year Store Growth |
Revenue Per Store ($ mln) |
Past 10-year Store Growth |
Facebook Followers (‘mln’) |
|
McDonald’s |
40,031 |
1.7% |
0.57 |
-3.1% |
81,569,489 |
|
Yum Brands (Including Yum China) |
65,427 |
4.1% |
0.31 |
0.1% |
100,255,665 |
|
Restaurant Brands International |
41,939 |
7.6% |
0.19 |
-0.3% |
12,725,382 |
|
Domino’s Pizza |
23,304 |
5.4% |
0.33 |
6.4% |
21,501,356 |
|
Wendy’s |
7,289 |
1.1% |
0.22 |
0.3% |
7,987,579 |
|
Papa John’s |
6,266 |
2.1% |
0.33 |
0.4% |
6,670,808 |
Source: Company Data, Facebook, Khaveen Investments
Based on the table, although McDonald’s is the market leader in terms of its size, its competitors Yum Brands and Restaurant Brand International have a higher store count than McDonald’s as these include several fast-food chains such as KFC, Pizza Hut and Taco Bell (Yum Brands) and Tim Hortons, Burger King and Popeyes (Restaurant Brand International). In terms of Facebook followers, McDonald’s has the second-highest number of followers trailing behind Yum Brands but ahead of the rest of its competitors.
Company Data, Khaveen Investments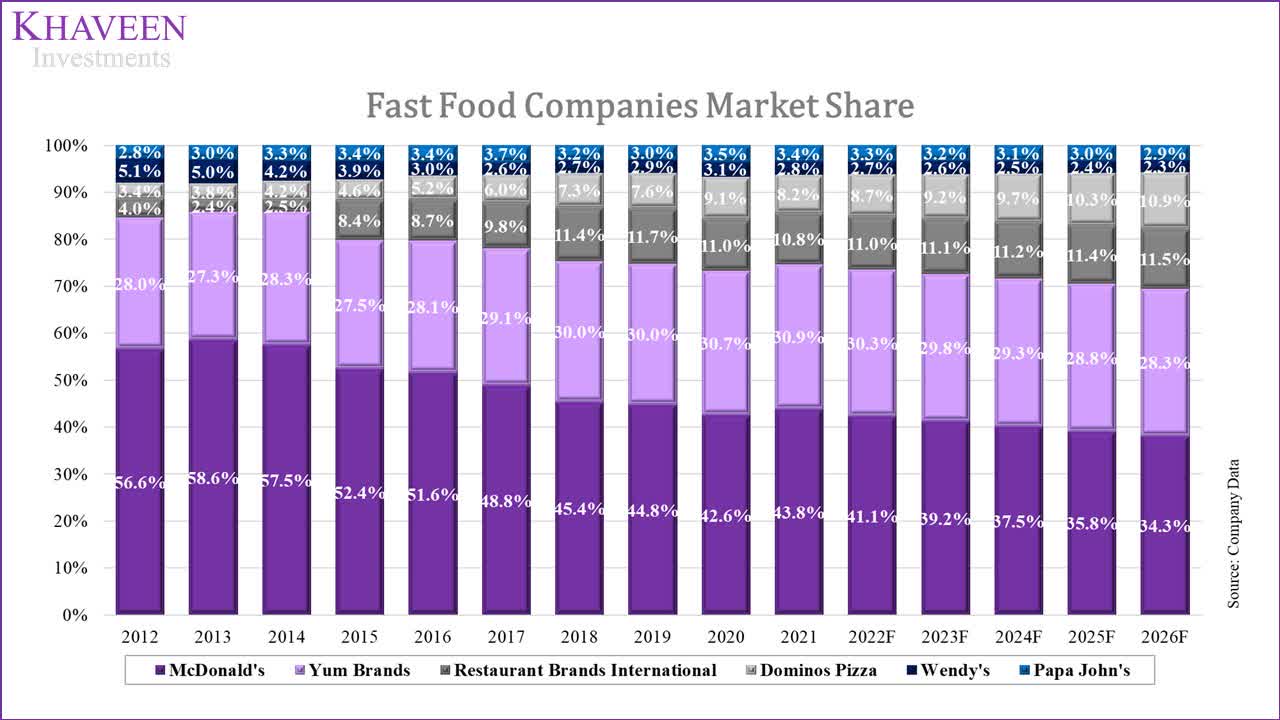
|
Companies |
Market Share (2021) |
Past 10-year Revenue Growth % |
Forward 5-year Growth |
|
McDonald’s |
43.8% |
-1.5% |
1.32% |
|
Yum Brands (Including Yum China) |
30.9% |
2.2% |
4.2% |
|
Restaurant Brands International |
10.8% |
26.6% |
7.3% |
|
Domino’s Pizza |
8.2% |
11.3% |
12.2% |
|
Wendy’s |
2.8% |
-4.9% |
1.4% |
|
Papa John’s |
3.4% |
3.7% |
2.5% |
Source: Company Data, Khaveen Investments
All in all, McDonald’s market leadership has been eroded by strong competition from other fast-food chains but maintained its place as the number one fast-food company in 2021. We expect the company to continue facing tough competition as we projected its market share to decline steadily through 2026 while Restaurant Brands International and Dominos gain share with higher store and revenue growth.
Risks: Rising Costs
According to the company, it was affected in 2021 due to rising food and labor costs. It expects food and paper products costs which rose by 4% in the US and 3% internationally to double this year as inflation rises. Additionally, the company plans to increase its wages for employees by 10% to $13/hour and further rise to $15/hour by 2024. From its latest earnings call, the company’s management explained its impact on its operating income in the near term.
In 2022, we anticipate our operating margin percent will continue to be in the low to mid-40s range as strong top line momentum and minimal other operating income will be hampered by significant commodity and labor inflation in the near term. – Kevin Ozan, Corporate EVP & CFO
Valuation
We summarized our revenue projections for the company based on its franchised and company-operated store segments as discussed in the points above.
|
McDonald’s Revenue ($ bln) |
2019 |
2020 |
2021 |
2022F |
2023F |
2024F |
2025F |
2026F |
|
Franchised restaurants |
11.66 |
10.73 |
13.085 |
13.66 |
14.27 |
14.90 |
15.56 |
16.25 |
|
Growth % |
5.9% |
-8.0% |
21.9% |
4.4% |
4.4% |
4.4% |
4.4% |
4.4% |
|
Company-operated restaurants |
9.42 |
8.14 |
9.79 |
9.44 |
9.10 |
8.78 |
8.47 |
8.17 |
|
Growth % |
-5.9% |
-13.6% |
20.2% |
-3.5% |
-3.5% |
-3.5% |
-3.5% |
-3.5% |
|
Total Revenue |
21.08 |
18.87 |
22.87 |
23.10 |
23.38 |
23.68 |
24.03 |
24.42 |
|
Growth % |
0.3% |
-10.5% |
21.2% |
1.0% |
1.2% |
1.3% |
1.5% |
1.6% |
Source: McDonald’s, Khaveen Investments
To value the company, we used a DCF analysis as we see its cash flow generation abilities continuing to remain strong. We based the terminal value on the industry average of selected competitors at an EV/EBITDA average of 19.28x.
Seeking Alpha, Khaveen Investments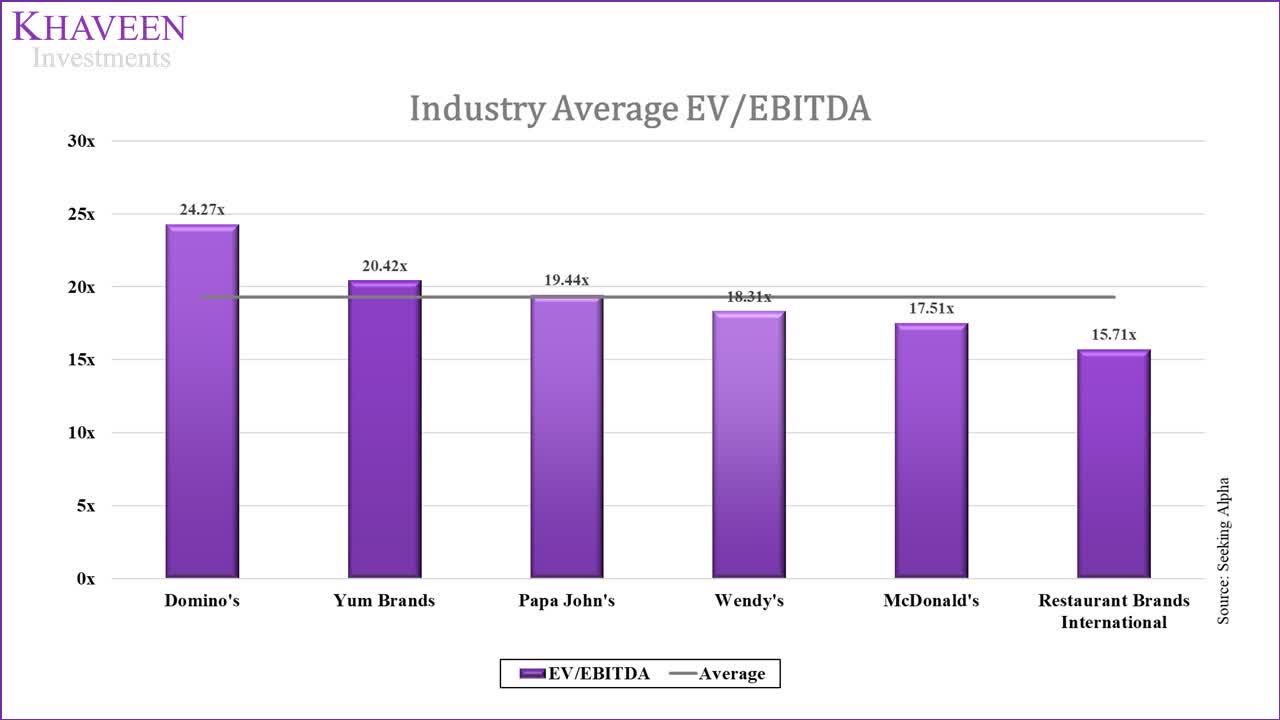
Based on a discount rate of 5.4%, our model shows its shares are fairly valued.
Khaveen Investments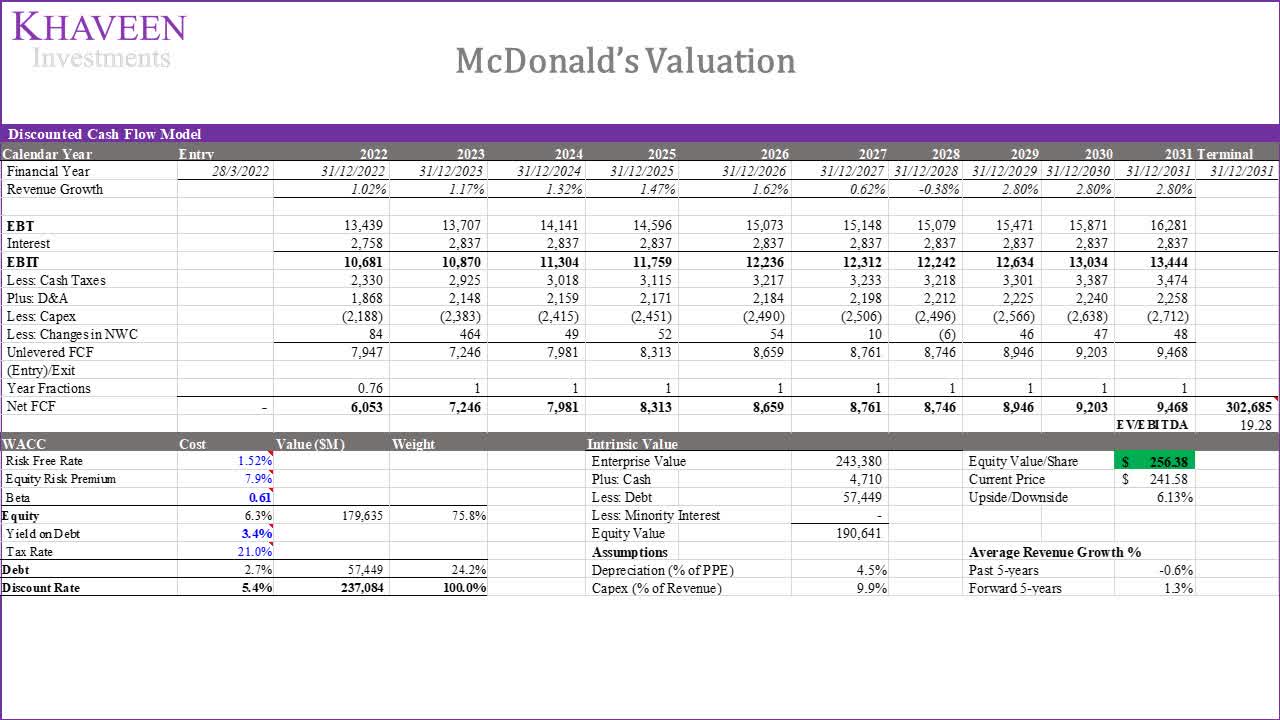
Verdict
To conclude, we determined McDonald’s shift from company-operated stores towards its franchising business which had grown by 3.3% compared to a 6.9% average past 10-year store count decline. As it shifts from the lower margin company-operated stores (18%) to higher-margin franchise business (82%), we expect the company’s margins to rise to 60.8% by 2026 with the growth of its franchise business at a forecasted rate of 4.4%. Moreover, we compared and analyzed the different franchises where its competitors such as Subway, Domino’s, Pizza Hut and Papa John’s have higher average margin per store and lower initial fees than the company but still had higher than average store count growth in the past 5 years. Lastly, we expect the company to face increasing competition from Yum Brands, Restaurant Brands International and Domino’s Pizza and eroding its market share with a forecast of 34.3% for the company in 2026 but still retain its position as the market leader. Overall, we rate the company as a Hold with a target price of $256.38.
Be the first to comment