

Mykola Sosiukin
This article was published on Dividend Kings on Tuesday, Jan. 24, 2023.
You might imagine that millionaires might feel better about their prospects, but not really.
CNBC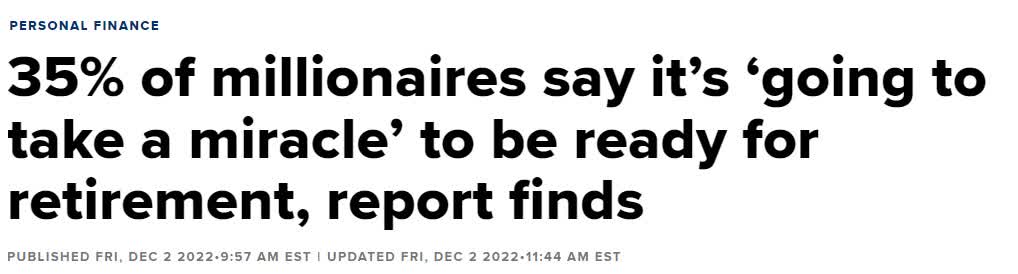
With investors losing almost $30 trillion in stocks and bonds last year, inflation still high, and now recession likely coming soon, it’s understandable why so many people are pessimistic about their retirement plans.
But I have wonderful news for you.
Almost Anyone Can Possibly Retire A Millionaire With Dividend Blue Chips
| Monthly Savings | Inflation-Adjusted Portfolio After 20 Years | Inflation-Adjusted Portfolio After 30 Years | Inflation-Adjusted Portfolio After 40 Years | Inflation-Adjusted Portfolio After 50 Years |
| $100 | $77,936 | $235,923 | $672,169 | $1,876,759 |
| $250 | $194,840 | $589,809 | $1,680,423 | $4,691,899 |
| $500 | $389,682 | $1,179,620 | $3,360,849 | $9,383,804 |
| $1,000 | $779,363 | $2,359,239 | $6,721,695 | $18,767,598 |
| $2,000 | $1,558,727 | $4,718,477 | $13,443,387 | $37,535,189 |
| $3,000 | $2,338,091 | $7,077,716 | $20,165,083 | $56,302,791 |
(Source: FactSet, Dave Ramsey)
Dividend blue chips historically deliver about 10% inflation-adjusted returns. That’s what they’ve done for 50 years, and you can still build high-yield income portfolios that are expected to deliver such returns.
That means that almost anyone with enough time or savings can retire an inflation-adjusted millionaire.
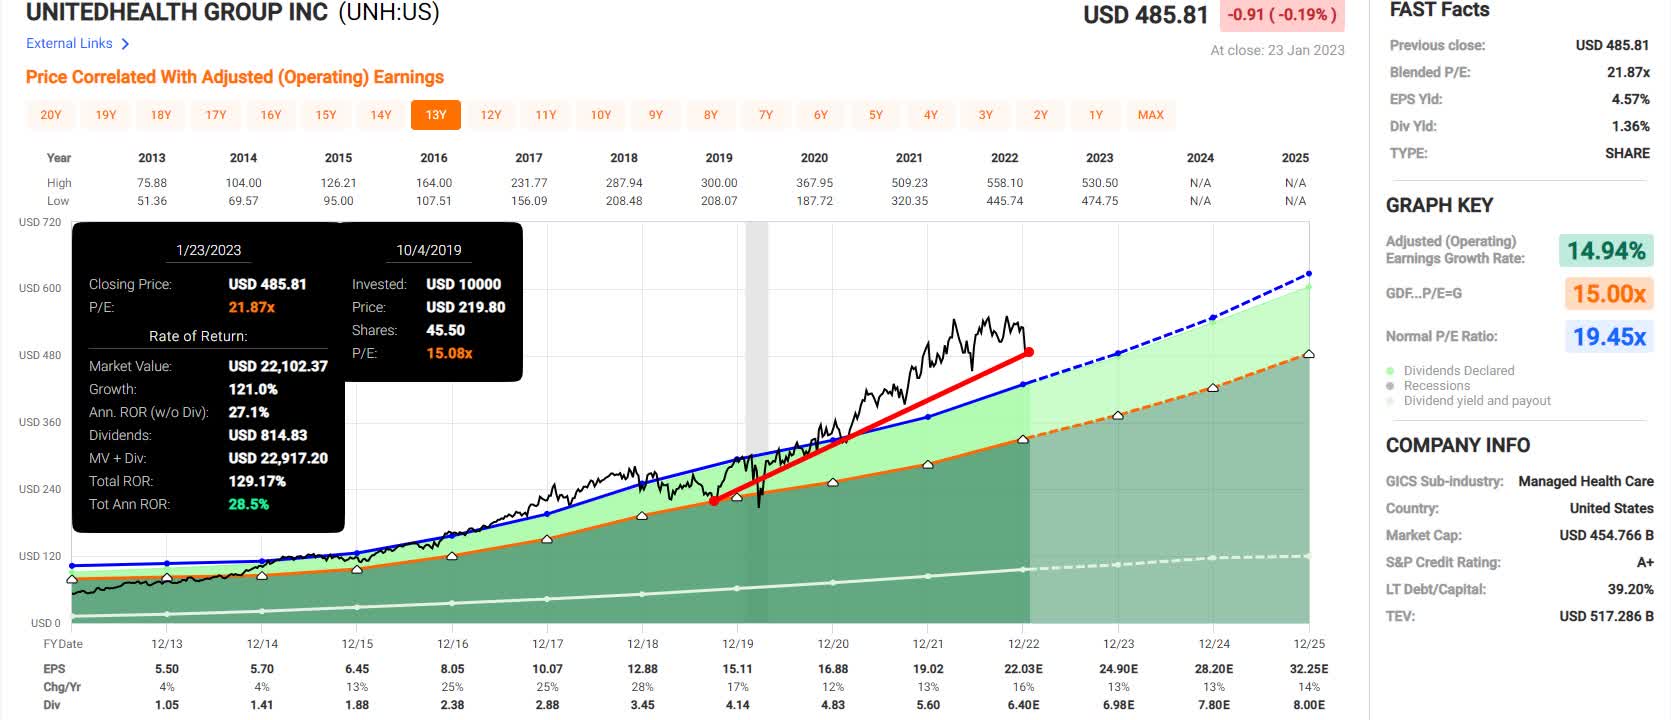
But can you really earn 10% inflation-adjusted returns? Yes, you can. In fact, in the medium term you can earn Buffett-like returns on many blue-chip bargains hiding in plain sight.
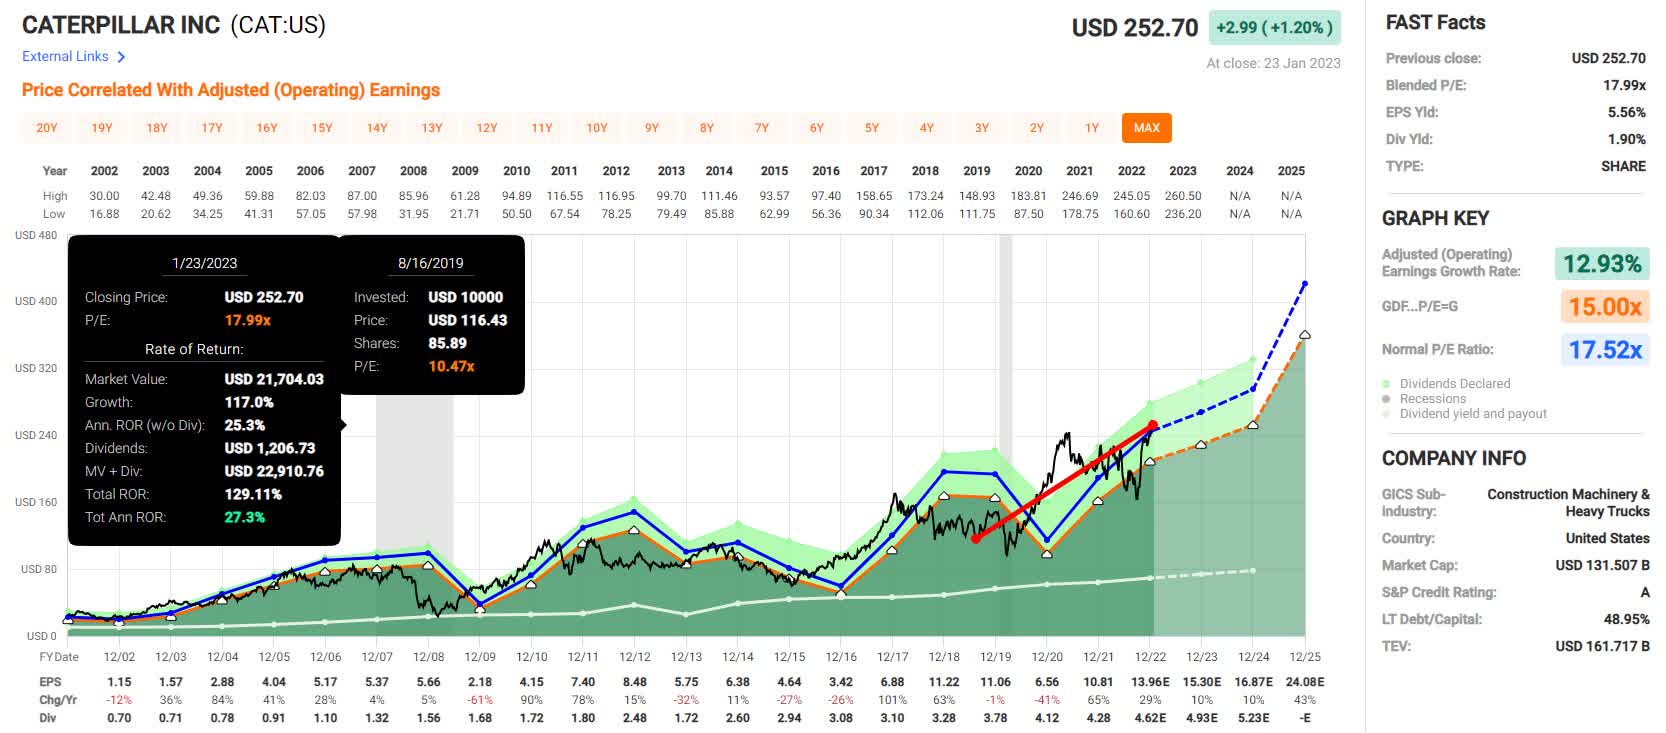
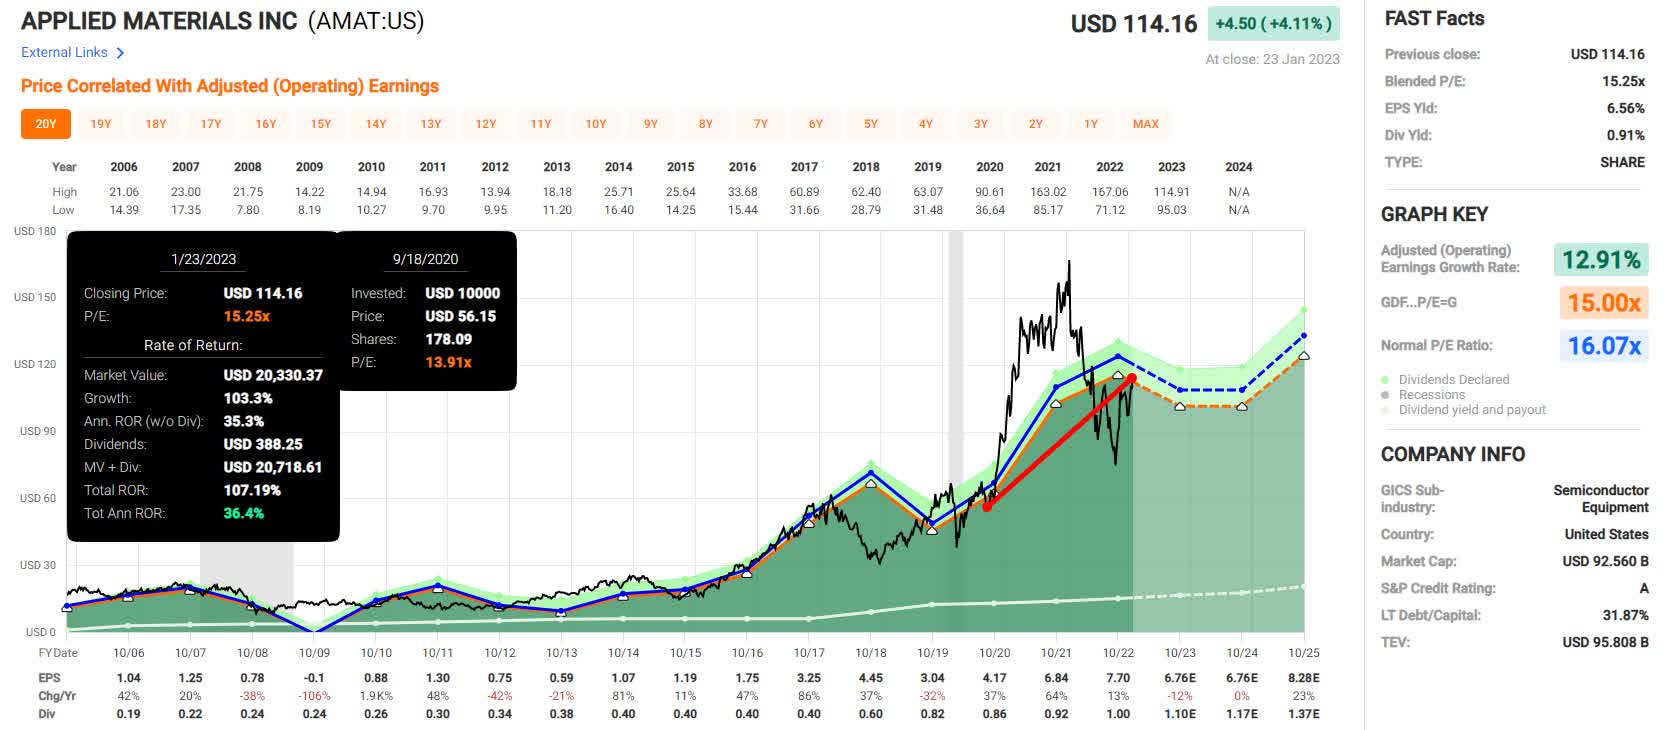
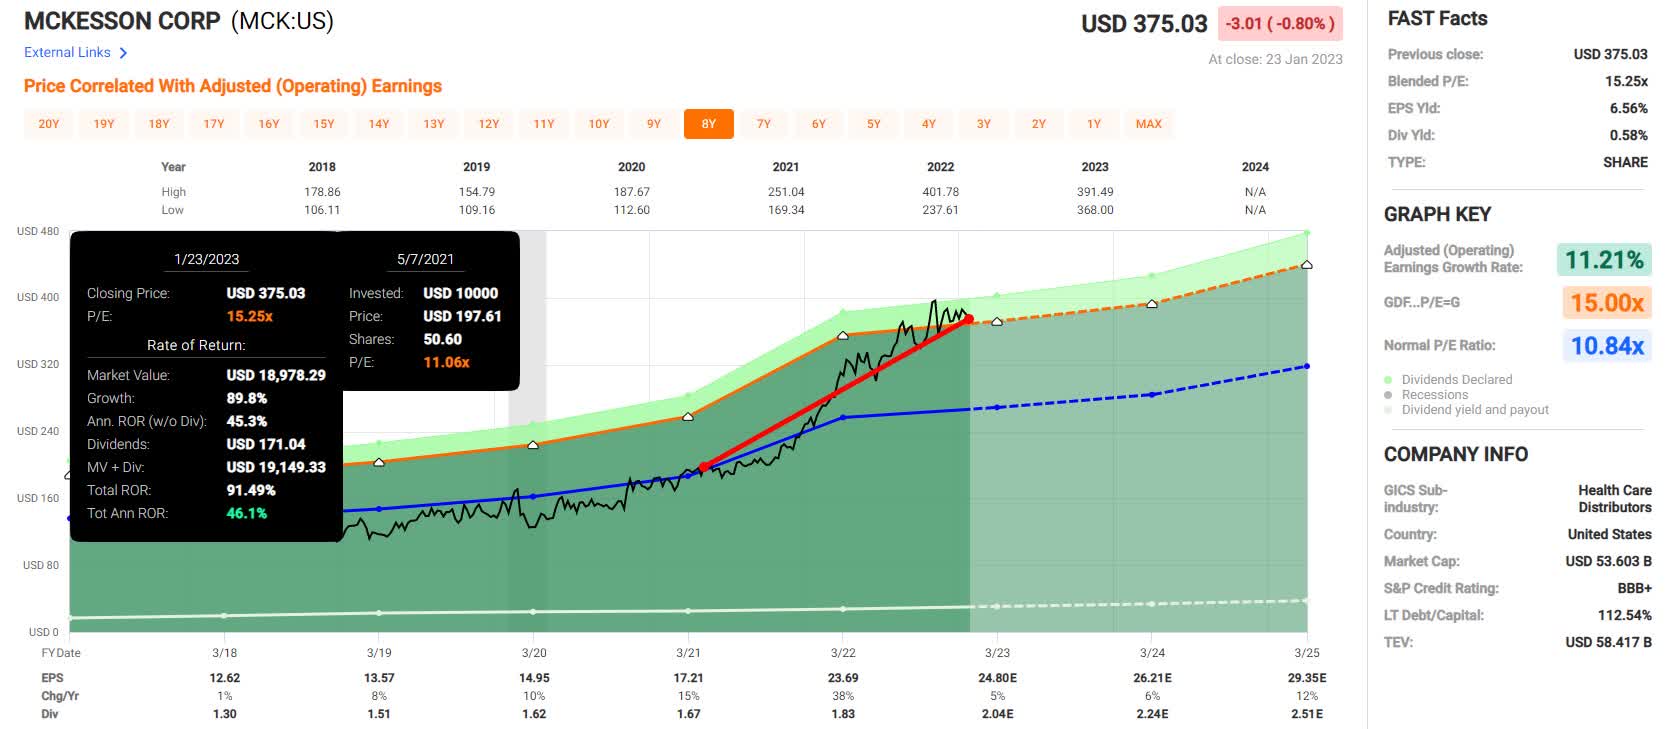
Don’t believe me? Here are some of my blue-chip recommendations that have done just that.
FAST Graphs, FactSet FAST Graphs, FactSet FAST Graphs, FactSet FAST Graphs, FactSet FAST Graphs, FactSet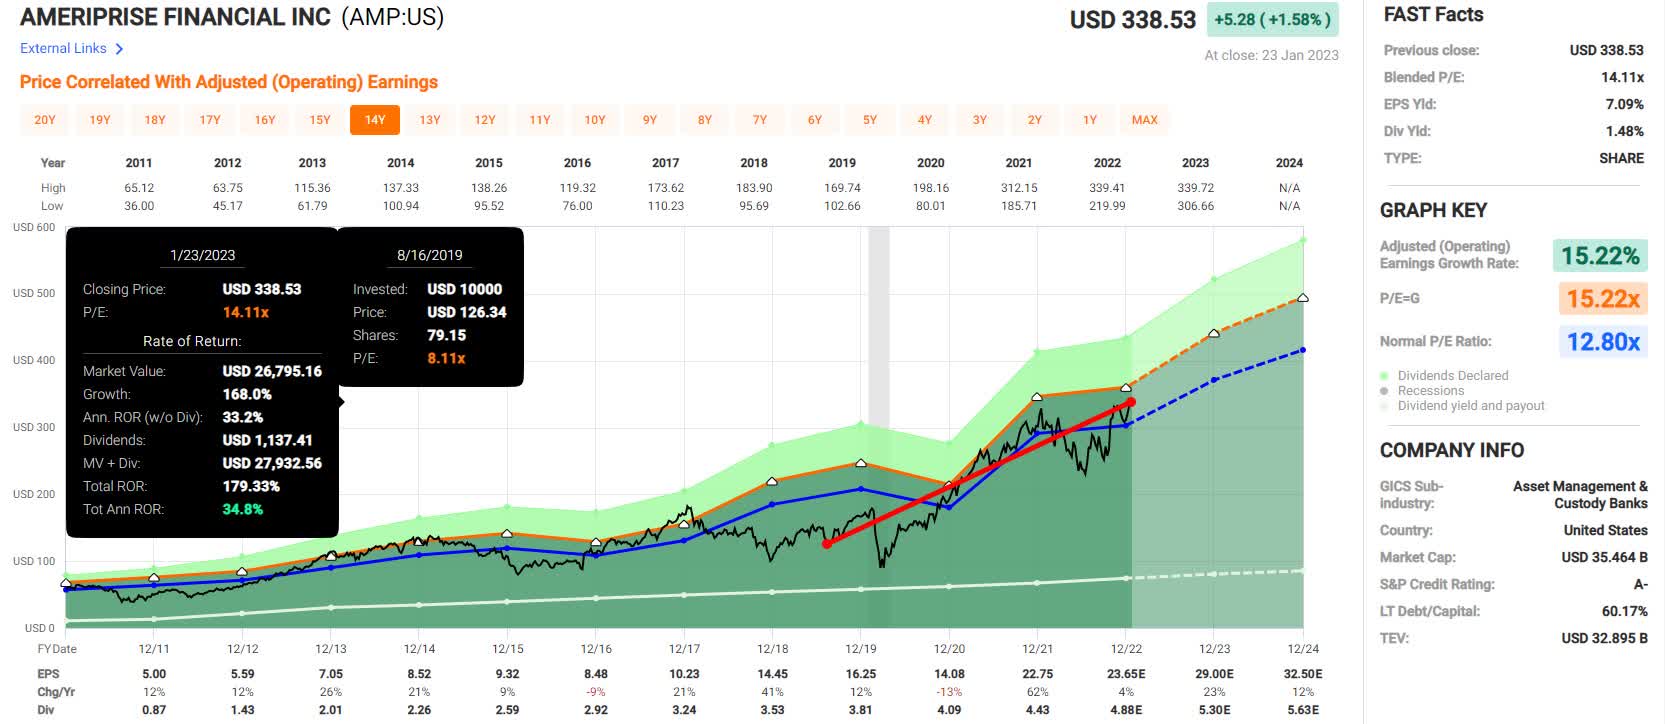
But if you want to earn Buffett-like returns over the long term, or at least returns on par with the greatest investors in history, you need hyper-growth world-beater blue chips like Visa (NYSE:V) and Mastercard (NYSE:MA).
Let me show you why both of these wide-moat growth legends are still potentially excellent additions to a diversified dividend portfolio. But one is the better buy today, while the other is the slightly better long-term buy.
Both could possibly make you rich, but one could possibly make you richer, faster.
Why Visa And Mastercard Are World-Beater Blue Chips You Want To Own
While all companies have risk profiles (which we’ll address in a moment), Visa is one of the world’s best companies. Why?
We think a wide moat surrounds the business and that Visa’s position in the global electronic payment infrastructure is essentially unassailable…
Despite the evolution in the payment space, we think a wide moat surrounds the business and view Mastercard’s position in the current global electronic payment infrastructure as essentially unassailable.” – Morningstar
Morningstar considers Visa’s and Mastercard’s moats to be essentially bullet proof, and it’s not hard to see why.
Mastercard operates in 210 countries in 150 currencies, and Visa operates in 210 countries in 160 currencies.
Last year Mastercard processed $8.25 trillion across its network, and Visa over $14 trillion. That means approximately 21% of the entire global economy is flowing over these processing networks. In 2022 Visa processed 254 billion transactions, 32 for every human on earth.
Business News Daily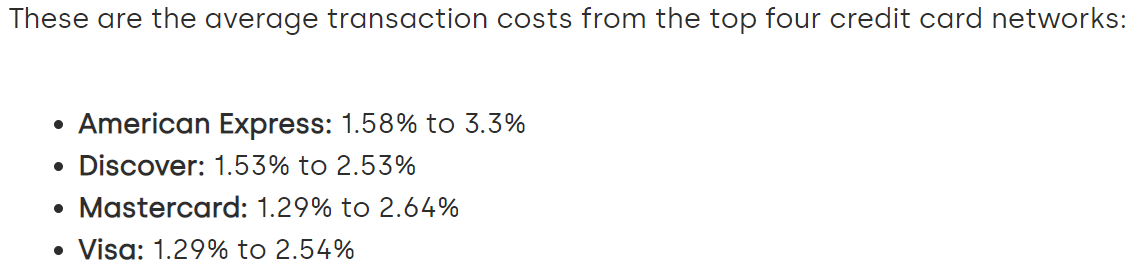
Each time they process a transaction, they take a cut of the proceeds. They’re toll-booth businesses and, unlike Amex (AXP) and Discover (DFS), take no credit risk.
Mastercard can process 5,000 transactions per second, and Visa 65,000. The supposed disruptors to these companies, such as blockchain titan Ether? 15 transactions per second. Granted, sharding is supposed to get that up to “up to” 100,000 per second, but for now, Visa and Mastercard are the only payment processors who can operate at 70,000 transactions per second.
It’s arguably the greatest business model on earth because trust, convenience, and network effects are key to their moats.
New research from the Pew Research Center… found that 41% of Americans say none of their purchases in a typical week are paid for in cash. That’s up from 29% in 2018 and 24% in 2015.” – CNBC
Electronic payments have been growing quickly, and the pandemic has accelerated a cashless economy. Yet even in the US and other developed economies, most people still use cash.
Cash was used for 59% of point-of-sale transactions in 2022, down from 72% in 2019.” – ECB
This means that the convenience that Mastercard and Visa offer give both a long-growth runway.
Visa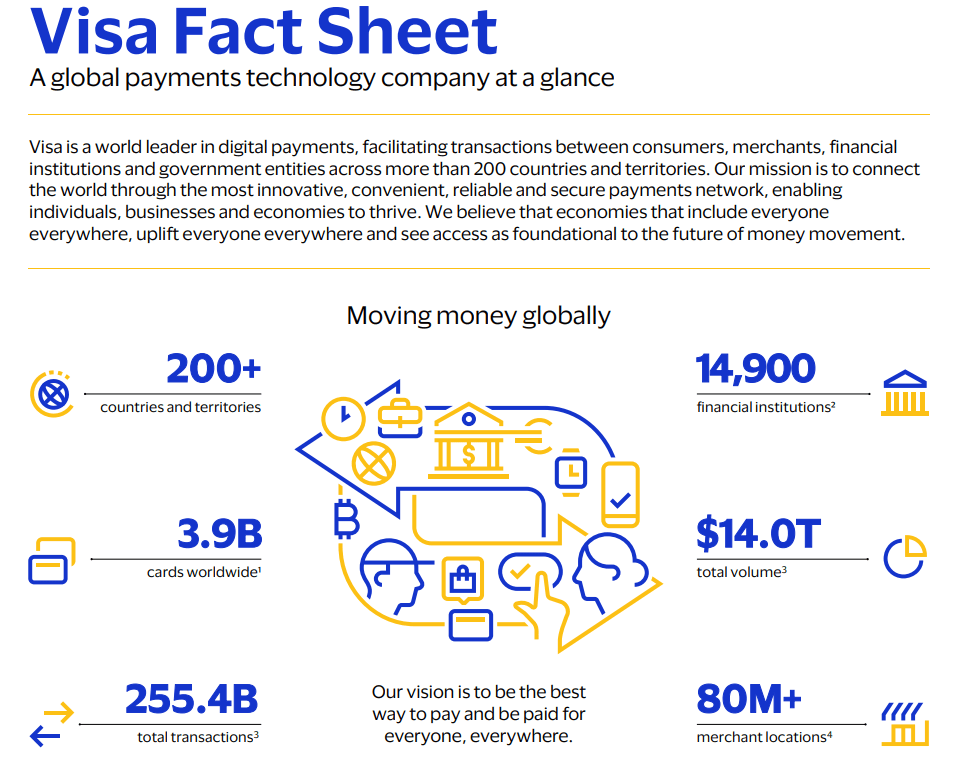
Consider Visa, which is accepted at over 80 million merchant locations worldwide. Almost 15,000 financial institutions use this network. Why? Because Visa and Mastercard are the most trusted names in payment processing.
The 2022 crypto winter showed that blockchain isn’t close to being ready to handle people’s money. In contrast, businesses are more than willing to trust Mastercard and Visa because that’s what their customers use.
The more people use Visa and Mastercard credit and debit cards, the more institutions will sign up to accept them. Is a 1.3% to 2.6% fee something businesses would prefer not to pay? Sure. But guess what? Most businesses end up offering far bigger discounts to drive sales.
Ever heard of a loyalty program? Walgreens has one, and so does PayPal, Dairy Queen, and even Golden Corral.
Do you know what that offer? Cash back in the form of free purchases. Do you know what those loyalty programs run? Between 1% to 10% cash back equivalent for repeat shopping.
- Walgreens rewards program: 1% cash back
- PayPal Mastercard: 3% cash back for PayPal transactions
- Walgreens Mastercard: 5% cash back for purchases at Walgreens
- Dairy Queen rewards: 10% cash back
- Golden Corral rewards: 10% cash back
Do you think a business with a never-ending 5% to 10% sale cares about 1.3% to 2.6% transactions? Not if all their customers have those cards and are willing to spend more.
I said these were the best businesses on earth, and here’s the proof.
Ycharts
The margins on this low-capex business are insane. 50% net profits and 45% to 61% free cash flow margins.
Why is Visa more profitable than Mastercard? Simply because it’s bigger and has better economies of scale. But as Mastercard grows larger, its margins should rise to match Visa’s.
These companies take no credit risk, run 20% of the global economy through their networks, and take obscenely profitable cuts.
FactSet Research Terminal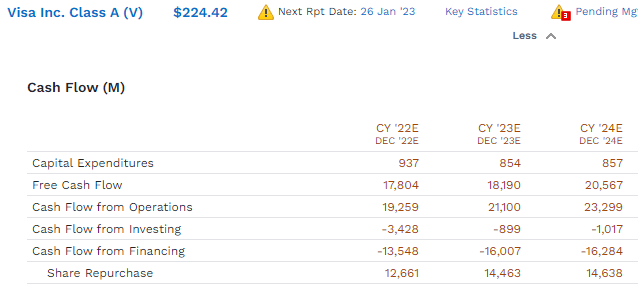
It costs Visa less than $900 million annually to keep its network operating, which is why it mints free cash flow to the tune of $18 billion annually. That’s why it buys back so much stock and pays rapidly growing, very safe dividends.
- Visa’s dividend has grown at 20% annually for the last 10 years
- it has an 18% free cash flow payout ratio
Mastercard? It’s grown its dividend at 41% annually for the last decade and has a 19% free cash flow payout ratio.
60% FCF payout ratios are considered safe for this industry, and that, plus a mountain of cash, and more arriving every day, is why these are such safe companies.
- Visa is rated AA- by S&P = 0.55% 30-year bankruptcy risk
- Mastercard is rated A+ stable = 0.6% 30-year bankruptcy risk
Do you know how much cash Visa has right now?
Visa Balance Sheet
FactSet Research Terminal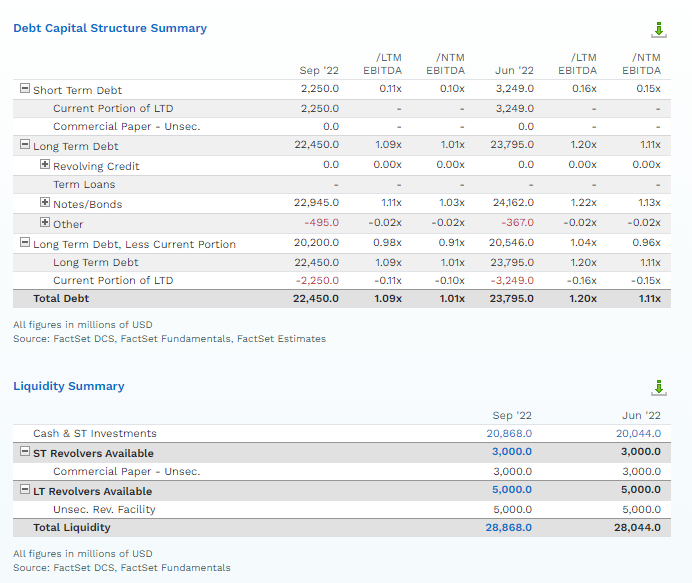
$21 billion, almost enough to pay off all of its debt instantly, if it wanted to.
And its annual free cash flow is also almost enough to repay its debt. But with an average borrowing cost of 2.75% (0.5% after long-term inflation), why would it?
Every dollar Visa invests in its business generates a cash return on invested capital of 48%. And its borrowing costs are 0.5% after inflation.
What about Mastercard?
Mastercard Balance Sheet
FactSet Research Terminal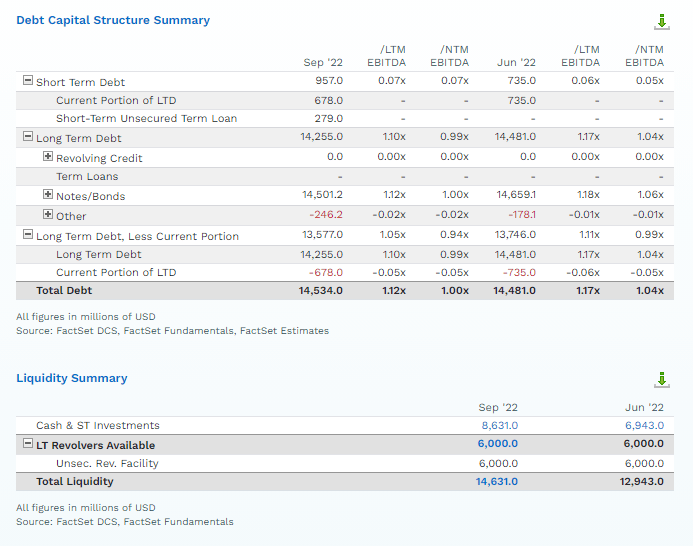
It has more net debt than Visa, but its net debt/EBITDA ratio is 0.5. Rating agencies consider 3.0X or less net leverage safe.
Or, to put it another way, Mastercard’s safe debt limit, according to S&P, Fitch, and Moody’s is $49 billion. It could borrow $35 billion without losing its investment-grade credit rating.
FactSet Research Terminal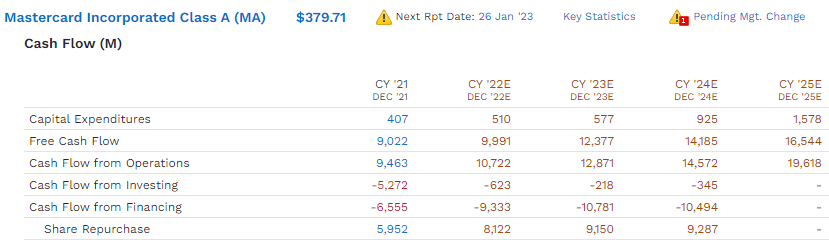
MA’s growth spending is growing more rapidly than Visa’s. It’s expected to triple in the next three years. That’s because Mastercard has 1/13th the network capacity of Visa, running roughly half the transaction volume.
Or, to put it another way, Visa started out building out a lot more capacity than it needed. It can now simply maintain its network and let the world’s demand for payment processing catch up to its capacity.
Yet even with Mastercard expected to spend 2X as much for growth in 2026, MA is still expected to generate incredible free cash flow, which means generous buybacks, and fast-growing dividends.
Ok, these companies sound amazing, but doesn’t sky-high profitability come with its own risks?
Your margin is my opportunity.” – Jeff Bezos
Indeed it does, so let’s address their risk profile.
Risk Profiles: Why Mastercard And Visa Aren’t For Everyone (But As Close To “Must Own” Blue-Chips As Exist)
There are no risk-free companies, and no company is right for everyone. You have to be comfortable with the fundamental risk profile.
Visa and Mastercard’s Risk Summary
- economic cyclicality risk: bond market expects a recession in 2024 (it might slow growth but probably won’t turn it negative)
- regulatory risk (domestic and international anti-trust lawsuits)
- M&A risk: including regulatory approvals
- margin compression risk: EU is working on its own network, Russia is now using China’s Unipay, and all businesses hate V and MA, though they have to use their networks
- disruption risk from blockchain and Defi: MA and V are both investing in blockchain
- labor retention risk (tightest job market in over 50 years, and tech is a high-paying industry) – rising wage pressures
- currency risk (growing over time due to faster growth overseas)
- cybersecurity risk: ransomware, hackers, Russian hacker attacks
A lot can go wrong with such dominant and insanely profitable businesses. The biggest are regulations and disruption for competing technologies, though both Visa and Mastercard are investing millions into fintech startups to avoid being blindsided.
Be short these companies and anybody that lives off of this 2 or 3% (transaction) tax, and be long well-thought-out, Web3 crypto projects that are rebuilding payments infrastructure in a completely decentralized way.” – Chamath Palihapitiya (king of SPACs)
That’s what the king of SPACs said on January 3rd, 2022, the day the market peaked. He said to short Visa and Mastercard with impunity, saying they will be the big losers of 2022.
To say that prediction didn’t age well would be an understatement.
Here are how all of Chamath’s SPACs did in 2022.
YCharts
And here’s how they are doing since the spec tech bubble peaked in February 2021.
Ycharts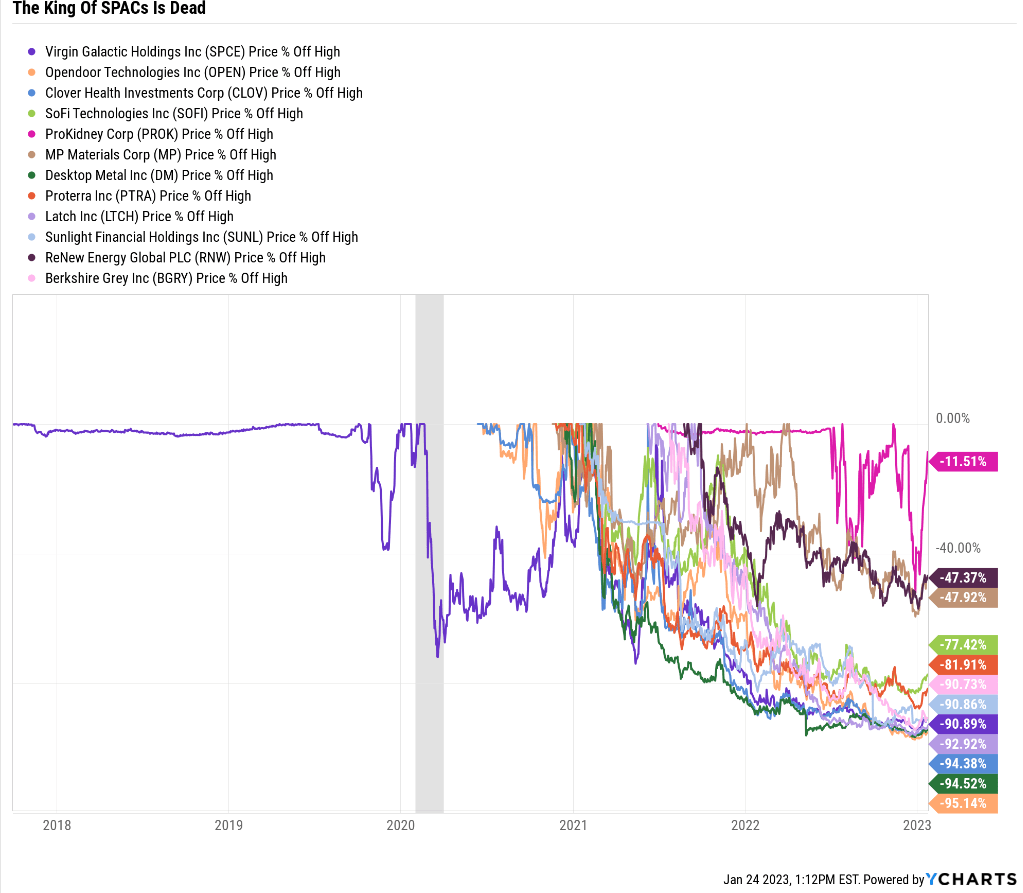
Literally, no investor who bought into Chamath’s SPACs made any money unless they cashed out at the top (as he did).
And here’s how Mastercard and Visa did in 2022.
Ycharts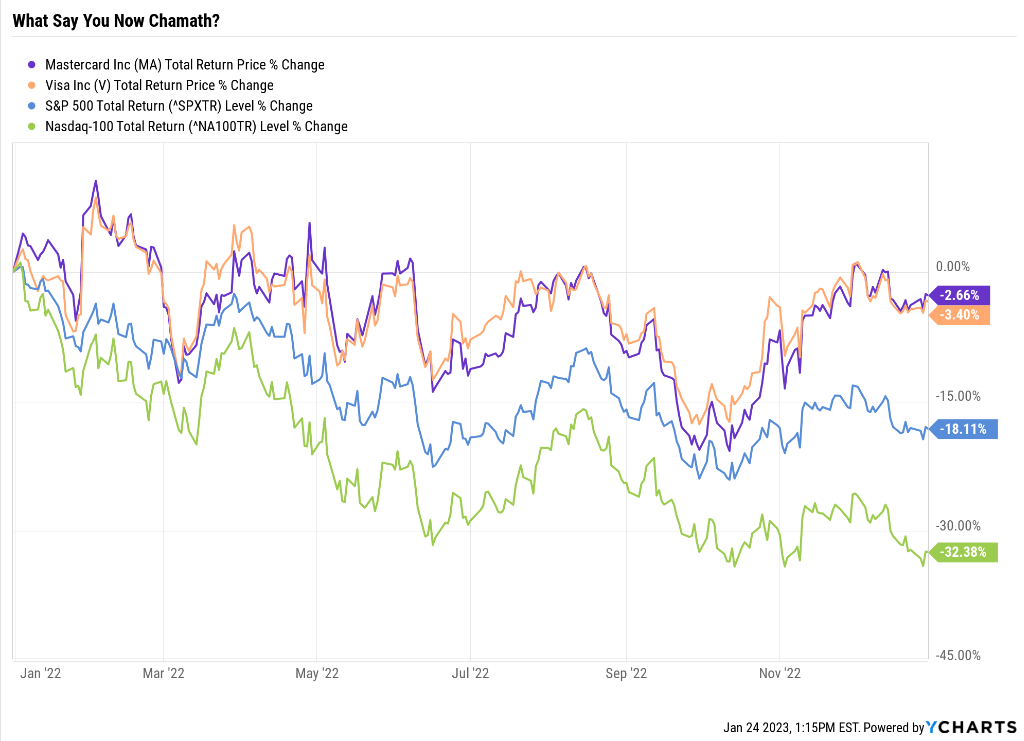
Investors who shorted MA and V in 2022 broke even after the cost of carrying the short, much better than investors in Chamath’s SPACs.
In 2021, some said Chamath might be “the next Warren Buffett.”
- Some also hailed Sam Bankman Fried as “the next Warren Buffett.”
- that ended even worse than Chamath
Charlie Bilello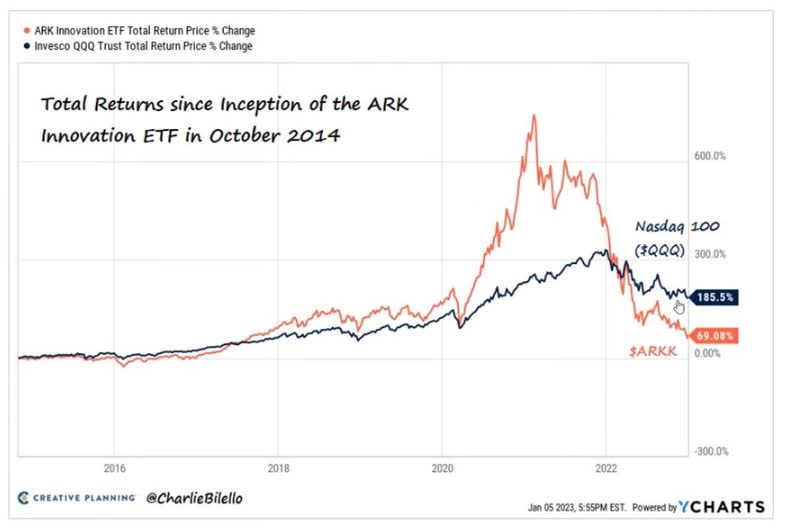
And we can’t forget Cathie Wood’s predictions about 45% annualized returns long into the future.
It’s amusing to poke fun at a discredited carnival barker money managers who got lucky during the Pandemic, speculative mania. But there are indeed lots of companies out to eat Mastercard’s and Visa’s lunch.
So how do we quantify, monitor, and track such a complex risk profile? By doing what big institutions do.
Long-Term Risk Management Analysis: How Large Institutions Measure Total Risk Management
DK uses S&P Global’s global long-term risk-management ratings for our risk rating.
- S&P has spent over 20 years perfecting their risk model
- which is based on over 30 major risk categories, over 130 subcategories, and 1,000 individual metrics
- 50% of metrics are industry specific
- this risk rating has been included in every credit rating for decades
The DK risk rating is based on the global percentile of how a company’s risk management compares to 8,000 S&P-rated companies covering 90% of the world’s market cap.
Mastercard scores 82nd Percentile On Global Long-Term Risk Management And Visa Scores 84th
S&P’s risk management scores factor in things like:
- supply chain management
- crisis management
- cyber-security
- privacy protection
- efficiency
- R&D efficiency
- innovation management
- labor relations
- talent retention
- worker training/skills improvement
- occupational health & safety
- customer relationship management
- business ethics
- climate strategy adaptation
- sustainable agricultural practices
- corporate governance
- brand management
ENB’s Long-Term Risk Management Is The 33rd Best In The Master List 93rd Percentile In The Master List)
| Classification | S&P LT Risk-Management Global Percentile |
Risk-Management Interpretation |
Risk-Management Rating |
| BTI, ILMN, SIEGY, SPGI, WM, CI, CSCO, WMB, SAP, CL | 100 | Exceptional (Top 80 companies in the world) | Very Low Risk |
| Strong ESG Stocks | 86 |
Very Good |
Very Low Risk |
| Visa | 84 |
Very Good |
Very Low Risk |
| Mastercard | 82 |
Very Good |
Very Low Risk |
| Foreign Dividend Stocks | 77 |
Good, Bordering On Very Good |
Low Risk |
| Ultra SWANs | 74 | Good | Low Risk |
| Dividend Aristocrats | 67 | Above-Average (Bordering On Good) | Low Risk |
| Low Volatility Stocks | 65 | Above-Average | Low Risk |
| Master List average | 61 | Above-Average | Low Risk |
| Dividend Kings | 60 | Above-Average | Low Risk |
| Hyper-Growth stocks | 59 | Average, Bordering On Above-Average | Medium Risk |
| Dividend Champions | 55 | Average | Medium Risk |
| Monthly Dividend Stocks | 41 | Average | Medium Risk |
(Source: DK Research Terminal)
The MA and V risk-management consensus is in the top 23% of the world’s best blue chips and is similar to:
- Walmart (WMT): Ultra SWAN dividend aristocrat
- Texas Instruments (TXN): Ultra SWAN
- Novo Nordisk (NVO): Ultra SWAN global aristocrat
- Philip Morris International (PM): Ultra SWAN dividend king
- Nestle (OTCPK:NSRGY): Ultra SWAN global aristocrat
The bottom line is that all companies have risks, and V and MA are very good, at managing theirs, according to S&P.
How We Monitor MA and V’s Risk Profile
- 79 analysts
- two credit rating agencies
- 81 experts who collectively know this business better than anyone other than management
When the facts change, I change my mind. What do you do, sir?” – John Maynard Keynes
There are no sacred cows at iREIT or Dividend Kings. Wherever the fundamentals lead, we always follow. That’s the essence of disciplined financial science, the math behind retiring rich and staying rich in retirement.
Why Mastercard Is The Better Long-Term Buy
Visa has a slightly higher credit rating and slightly better risk management, and is more profitable. So that makes it the clearly better buy right?
What about valuations?
Mastercard
- current price: $379.77
- fair value: $409.61
- Discount: 7.28%
- DK quality rating: 100% 13/13 very low-risk Ultra SWAN
- DK rating: potentially good buy
Visa
- current price: $224.78
- fair value: $273.53
- Discount: 17.82%
- DK quality rating: 99% 13/13 very low-risk Ultra SWAN
- DK rating: potentially very strong buy
Is Visa more undervalued? By about 10%. So that tears it; it’s the better buy, right?
Mastercard 2025 Consensus Total Return Potential
FAST Graphs, FactSet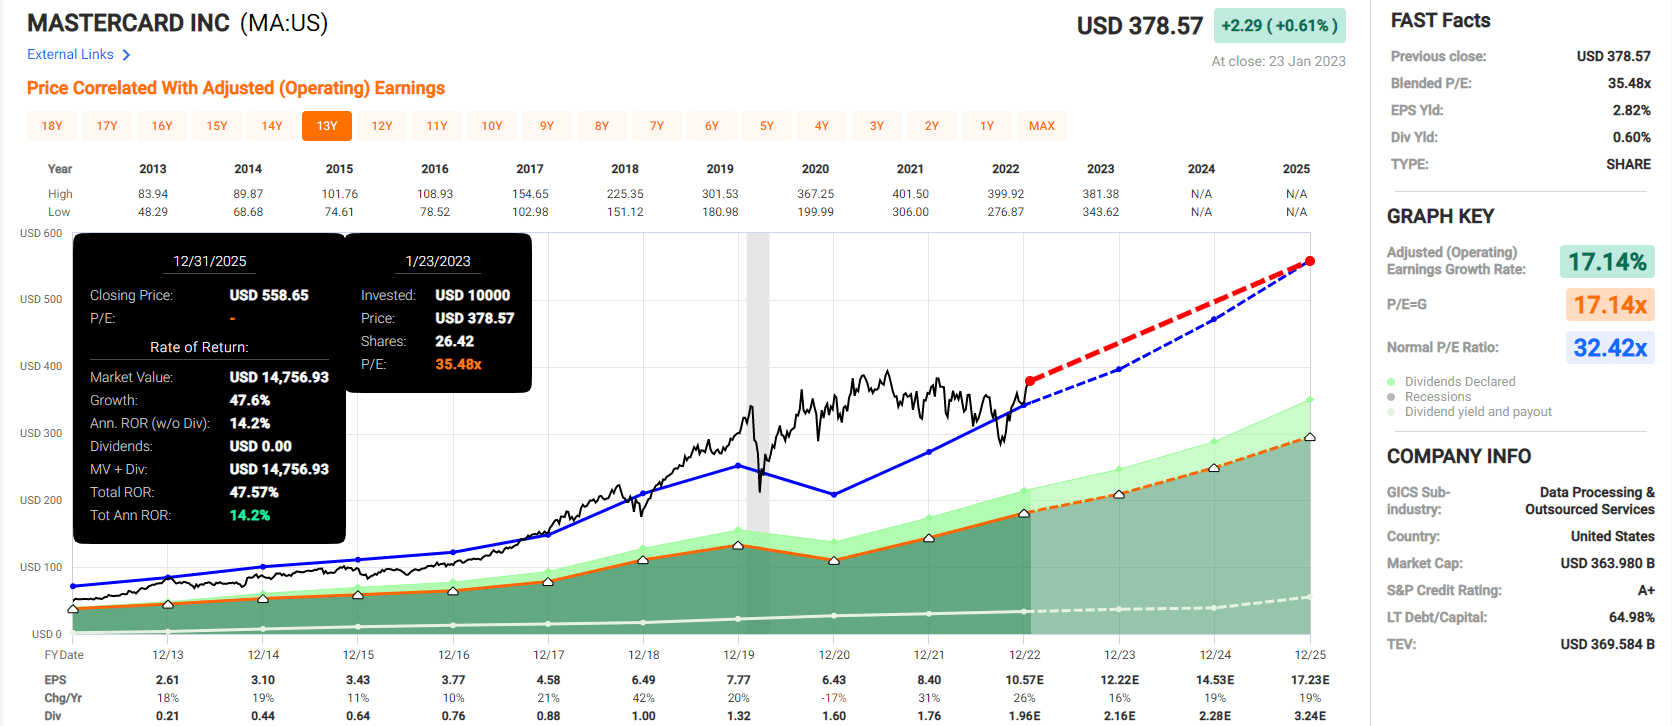
Mastercard 2028 Consensus Total Return Potential
FAST Graphs, FactSet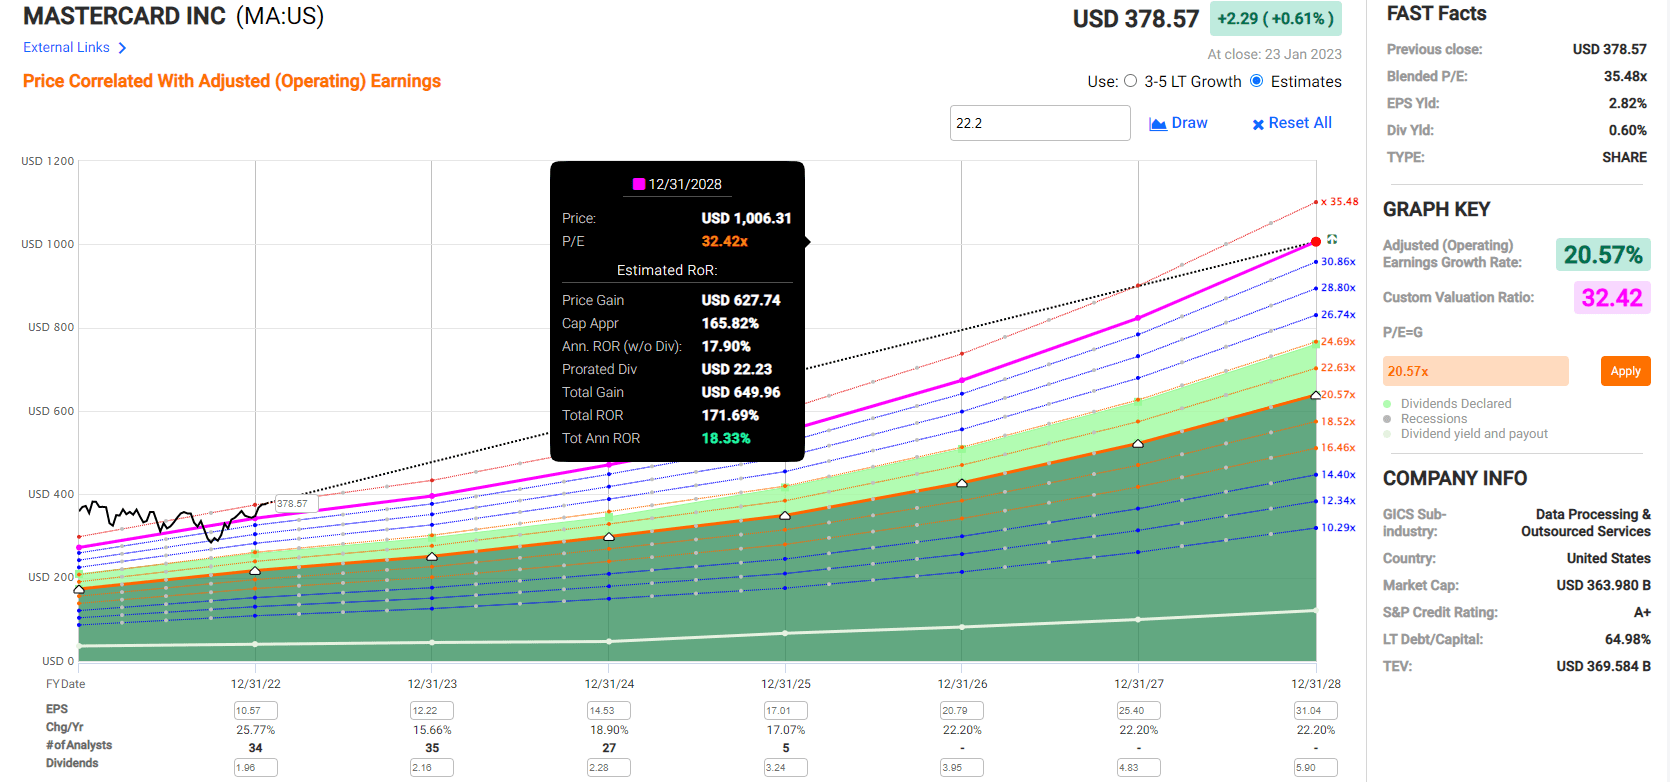
Visa 2025 Consensus Total Return Potential
FAST Graphs, FactSet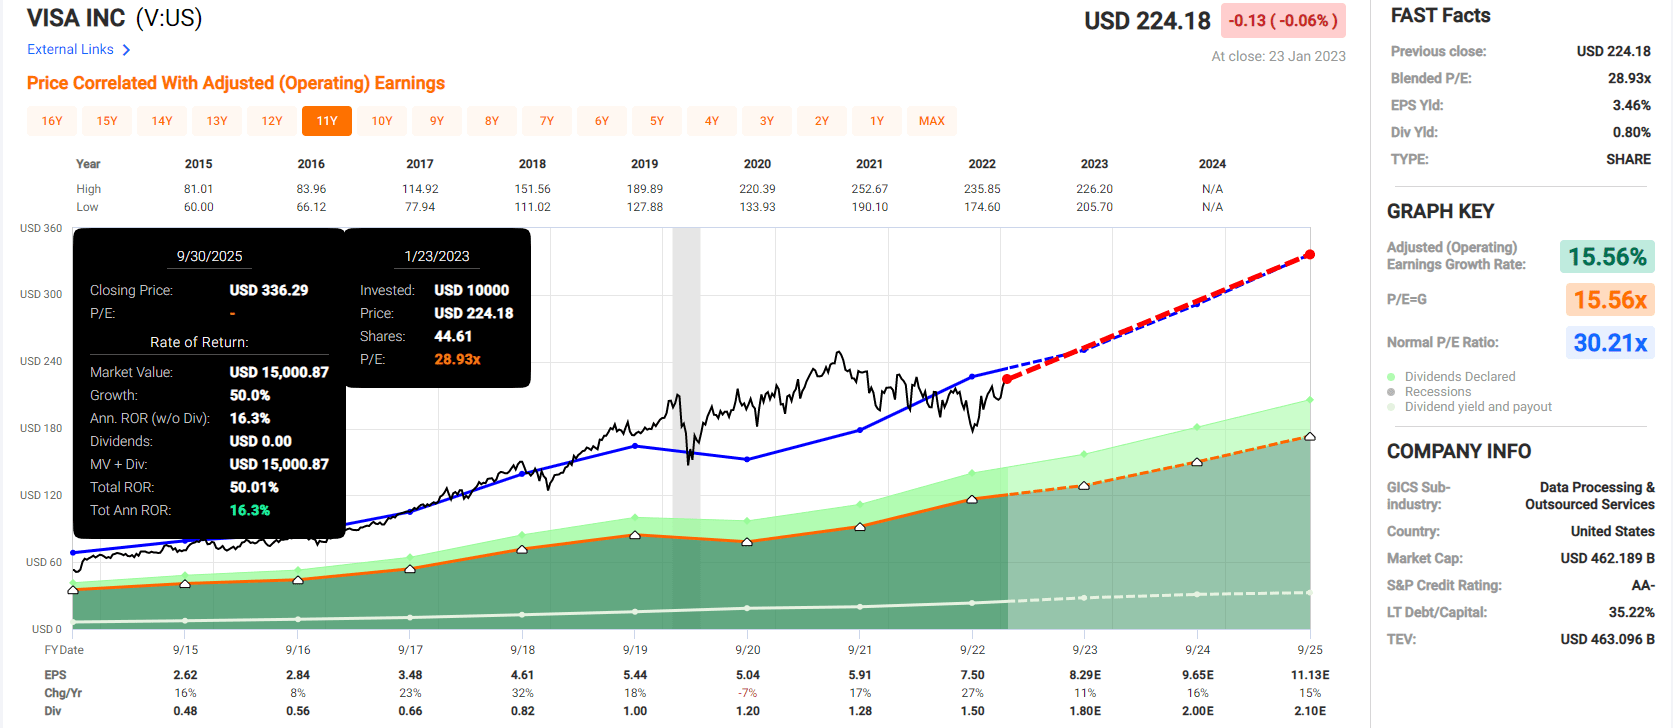
Visa 2028 Consensus Total Return Potential
FAST Graphs, FactSet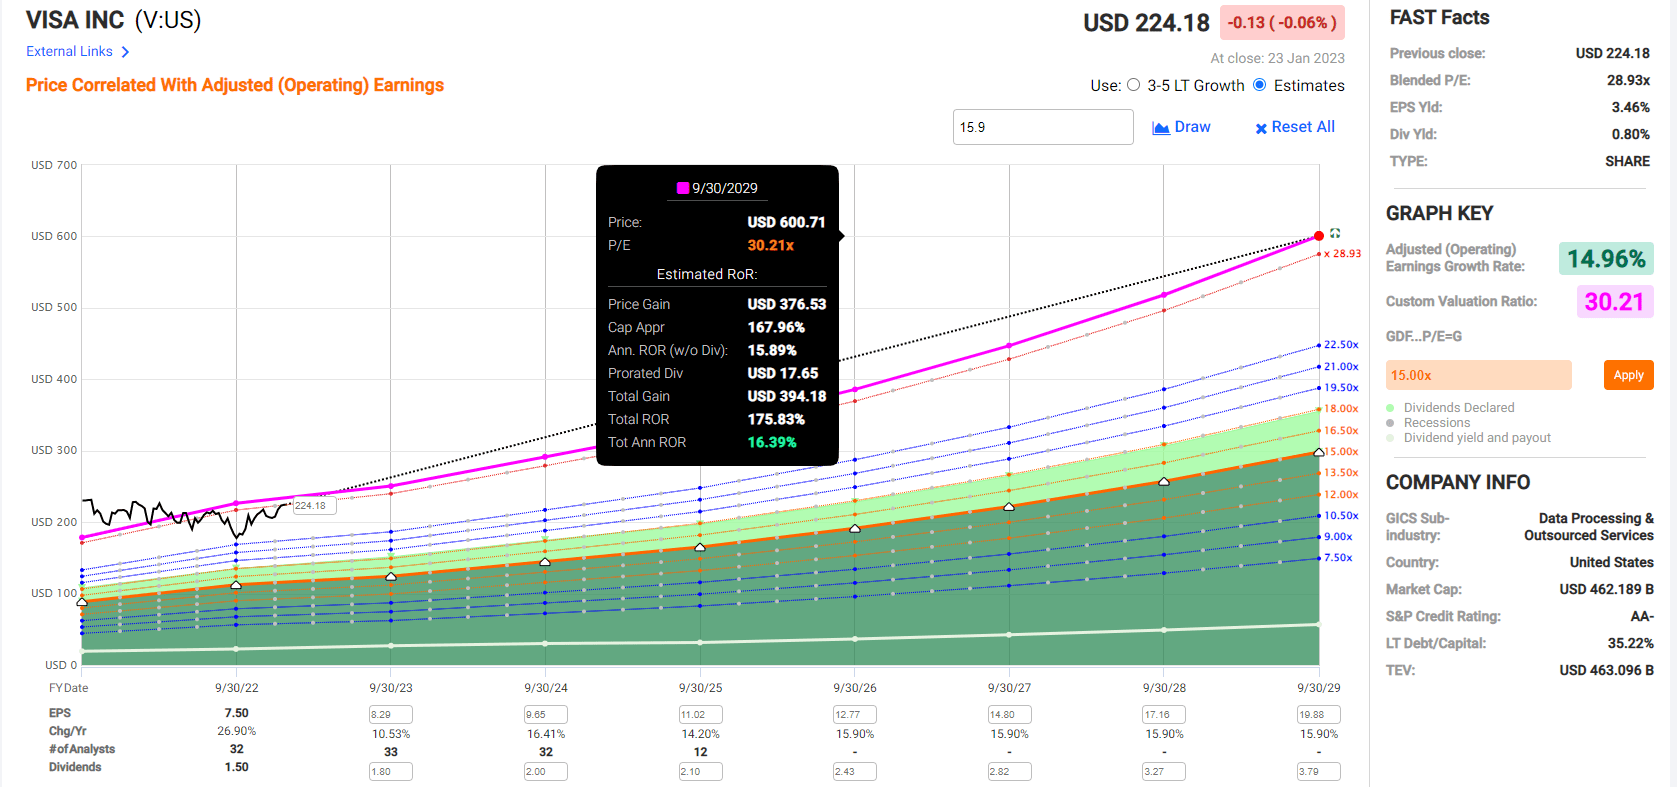
Is Visa historically more undervalued? Yes. Does that technically make it a better buy? Yes. But in terms of return potential, Visa is slightly better than Mastercard for the next few years, but within five years, Mastercard could surpass it.
There is only one kind of investor buys Visa or Mastercard, a dividend growth investor.
| Investment Strategy | Yield | LT Consensus Growth | LT Consensus Total Return Potential | Long-Term Risk-Adjusted Expected Return |
| Mastercard | 0.6% | 22.2% | 22.8% | 16.0% |
| Visa | 0.8% | 15.9% | 16.7% | 11.7% |
| ZEUS Income Growth | 4.1% | 8.5% | 12.6% | 8.8% |
| Schwab US Dividend Equity ETF | 3.4% | 8.6% | 12.0% | 8.4% |
| Vanguard Dividend Appreciation ETF | 1.9% | 10.0% | 11.9% | 8.3% |
| Nasdaq | 0.8% | 10.9% | 11.7% | 8.2% |
| Dividend Aristocrats | 1.9% | 8.5% | 10.4% | 7.3% |
| S&P 500 | 1.7% | 8.5% | 10.2% | 7.1% |
| REITs | 3.9% | 6.1% | 10.0% | 7.0% |
| 60/40 Retirement Portfolio | 2.1% | 5.1% | 7.2% | 5.0% |
(Source: DK Research Terminal, FactSet, Morningstar)
Both Visa and Mastercard are expected to run circles around almost any investment strategy on Wall Street, including the S&P, dividend aristocrats, and the Nasdaq.
Inflation-Adjusted Consensus Forecast: $1,000 Initial Investment
| Time Frame (Years) | 7.9% CAGR Inflation-Adjusted S&P 500 Consensus | 14.4% Inflation-Adjusted V Consensus | 20.5% CAGR Inflation-Adjusted MA Consensus | Difference Between Inflation-Adjusted MA Consensus And S&P Consensus |
| 5 | $1,465.25 | $1,962.86 | $2,544.81 | $1,079.56 |
| 10 | $2,146.96 | $3,852.82 | $6,476.08 | $4,329.11 |
| 15 | $3,145.84 | $7,562.54 | $16,480.40 | $13,334.57 |
| 20 | $4,609.44 | $14,844.21 | $41,939.55 | $37,330.11 |
(Source: DK Research Terminal, FactSet)
If both companies grow as expected for the next 20 years, V could 15X your money, adjusted for inflation, while MA could be a 42X return.
| Time Frame (Years) | Ratio Inflation-Adjusted MA Consensus/VA Consensus | Ratio Inflation-Adjusted MA Consensus vs. S&P consensus |
| 5 | 1.30 | 1.74 |
| 10 | 1.68 | 3.02 |
| 15 | 2.18 | 5.24 |
| 20 | 2.83 | 9.10 |
(Source: DK Research Terminal, FactSet)
MA offers the potential for 3X the long-term returns of V and 9X that of the S&P 500.
Bottom Line: Mastercard And Visa Are Both As Close To Must-Own World-Beaters As Exist, But Mastercard Is The Better Buy Today
Let me be clear: I’m NOT calling the bottom in MA or V (I’m not a market-timer).
Ultra SWAN quality does NOT mean “can’t fall hard and fast in a bear market.”
Fundamentals are all that determine safety and quality, and my recommendations.
- over 30+ years, 97% of stock returns are a function of pure fundamentals, not luck
- in the short term; luck is 25X as powerful as fundamentals
- in the long term, fundamentals are 33X as powerful as luck
While I can’t predict the market in the short term, here’s what I can tell you about MA and V.
These are arguably the best businesses in the world. They are toll-booth operators for international commerce, with 21% of global GDP running through their networks.
Decades of brand-building and trust among both consumers and financial institutions create moats so wide that Morningstar calls them “unassailable.”
While no moat is truly impervious, these A and AA-rated fintech titans have 82nd and 84th-percentile risk management and mountains of cash to deal with any challenges that might come up.
They generate rivers of free cash flow which they use to cement their moats and shower investors with buybacks and very safe, hyper-growth dividends.
Owning both is as close to a “no-brainer” decision as you can make in a diversified dividend growth portfolio.
Today Visa is about 17% undervalued, and Mastercard is about 7% undervalued. Visa is technically the better buy.
- Mastercard is a potentially good buy
- Visa is a potentially strong buy
But if I had to buy just one, and indeed I only own one of them in my family hedge fund, it would be Mastercard.
Mastercard is smaller, growing 6% faster, and as its economies of scale ramp up, its margins should approach those of Visa.
That’s because Mastercard’s superior growth should result in its returns surpassing those of Visa within five years, and long-term, it has 3X the return potential of its larger competitor.
In other words, Mastercard is like Lowe’s (LOW), and Visa is like Home Depot (HD). Both are amazing industry titans worth owning, but I recommend Mastercard when it comes to very low-risk Ultra SWAN hyper-growth.
Be the first to comment