

alexsl/iStock via Getty Images
Introduction
Despite TotalEnergies (NYSE:TTE) taking losses as the western world turned away from Russia following their invasion of Ukraine, thankfully they already recouped their Russia losses following the first quarter of 2022, as my previous article explained. Unsurprisingly, the subsequent months saw a cash windfall as the world struggles to plug energy shortages and much to my delight, their new capital allocation strategy includes special dividends, which boosts their moderate yield of 5.20%, depending upon exchange rates. This means that when it comes to shareholder returns, they are showing BP (BP) and Shell (SHEL) how it is done, as discussed within this follow-up analysis.
Executive Summary & Ratings
Since many readers are likely short on time, the table below provides a very brief executive summary and ratings for the primary criteria that were assessed. This Google Document provides a list of all my equivalent ratings as well as more information regarding my rating system. The following section provides a detailed analysis for those readers who are wishing to dig deeper into their situation.
Author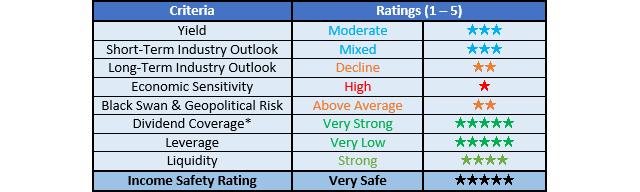
*Instead of simply assessing dividend coverage through earnings per share cash flow, I prefer to utilize free cash flow since it provides the toughest criteria and also best captures the true impact upon their financial position.
Detailed Analysis
Author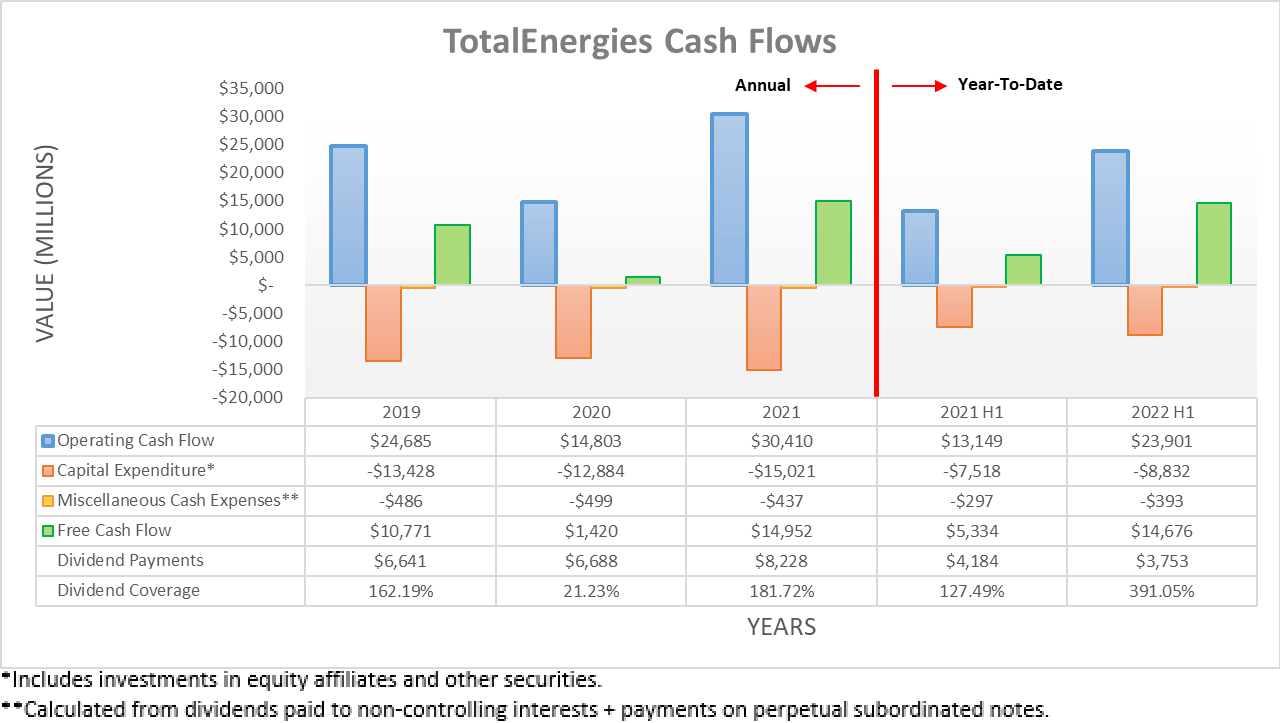
The booming oil and gas prices during the second quarter of 2022 provided the strongest backdrop in many years and thankfully, their cash flow performance did not disappoint with their operating cash flow powering ahead to $23.901b during the first half. Apart from being more than $10b higher year-on-year, this also leaves a record-setting result of $16.284b during the second quarter that is more than twice their previous result of $7.617b during the first quarter, which was already strong at the time and thus dwarfs anything in their past.
This record-setting performance also generated massive free cash flow of $14.676b during the first half of 2022 with $10.763b sitting within the second quarter alone, thereby providing a never-before-seen cash windfall. Whilst their upcoming results for the third quarter will likely soften versus the second quarter due to the modestly lower oil and gas prices, they should still produce ample free cash flow broadly matching their strong results during the first quarter, if not possibly higher. Even though there are growing economic risks on the horizon that create a mixed short-term outlook, at least in the medium to long-term, their shareholders can look forward to their new capital allocation strategy that is balanced and shareholder-friendly, as the slide included below displays.
TotalEnergies 2022 Strategy & Outlook Presentation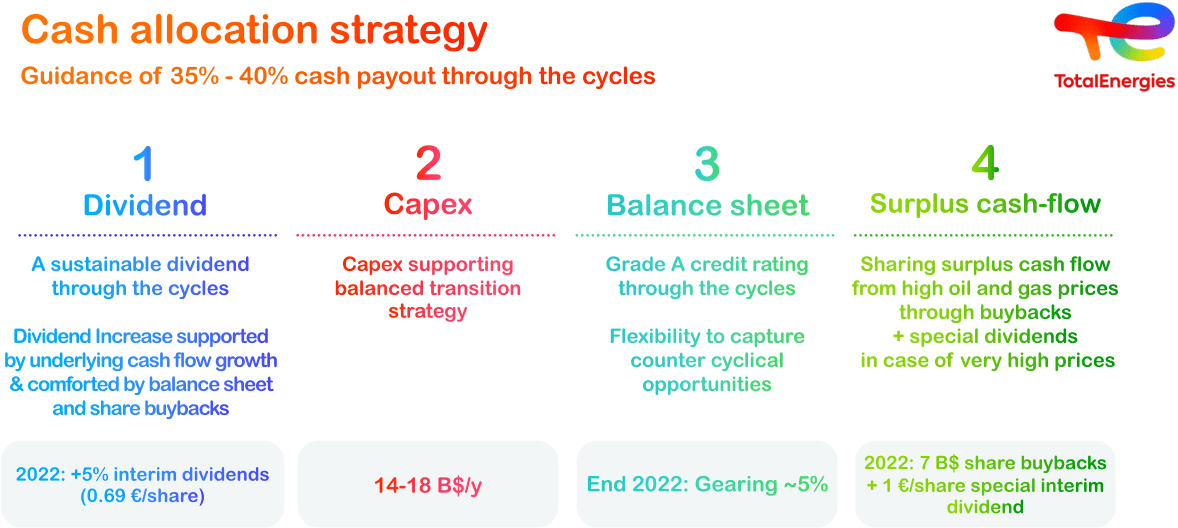
Thankfully, their capital allocation strategy is simple to interpret with clear priorities and most importantly, is shareholder-friendly because apart from their usual reliable base dividend, they plan to utilize their cash windfall from very high oil and gas prices for special dividends, not just more share buybacks. Whilst the cash flow performance of their closest peers, BP and Shell were equally as impressive, I was nevertheless disappointed by their sole focus upon share buybacks over special dividends, especially since they both cut their dividends during the severe downturn of 2020 and thus see shareholders taking home less cash than 2019, despite these far stronger operating conditions.
Each investor is entitled to their own views, although it firmly remains my view that special dividends provide a superior way to reward shareholders with the cash windfall from very high oil prices. Apart from being more tangible and quantifiable, their cash windfall is obviously going to coincide with the strongest of operating conditions and thus in theory, the highest of share prices, which makes it difficult to see these creating value for shareholders given the inherently volatile nature of their industry. Since they are not taking the same sole focus on share buybacks as BP and Shell, this should minimize the amount of share buybacks conducted at these inopportune prices, thereby creating a better outlook for their shareholders in the medium to long-term.
Author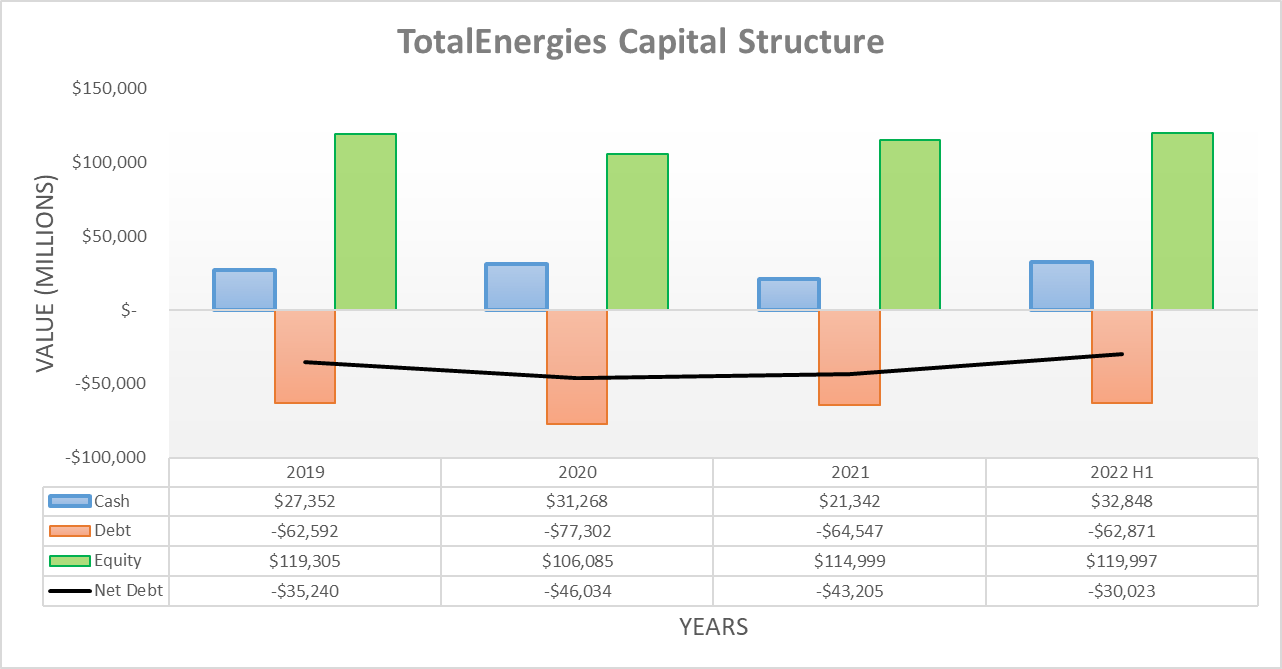
Quite unsurprisingly, their net debt saw further decreases during the second quarter of 2022 versus where it was following the first quarter, when conducting the previous analysis. This now sees their net debt down to $30.023b versus its previous level of $33.522b across these two points in time and whilst a $3.499b decrease is positive, it may seem small given their massive free cash flow, there are several variables skewing this comparison.
Apart from the usual foreign currency impacts that vary results quarter-to-quarter, during the second quarter of 2022 they conducted $1.988b of share buybacks, repaid $1.958b of perpetual subordinated notes and also saw a $731m increase to their current financial assets and liabilities that relate to investments with maturities greater than three months. If these are aggregated together, their net debt would have otherwise decreased another $4.677b and thus more than double its surface-level decrease, which bodes well for further deleveraging.
When looking ahead, the second half of 2022 should see their net debt decrease even further, as their capital allocation strategy sees the year ending with a gearing ratio of circa 5%. In theory, this should entail lower net debt because its result was 9.80% at the end of the second quarter, when calculated in accordance with their particular approach to calculating net debt, as per page nineteen of their second quarter of 2022 results announcement.
Author
When considering their existing leverage, it seems rather odd that management still intends to push their gearing ratio and thus net debt lower, as their net debt-to-EBITDA and net debt-to-operating cash flow are only 0.48 and 0.57 respectively following the second quarter of 2022. Similar to their results of 0.53 and 0.67 when conducting the previous analysis following the first quarter, these are well below the threshold of 1.00 for the very low territory. Even looking back at the severe downturn of 2020, these two results were still manageable at 2.81 and 3.11 respectively, despite their net debt sitting at $46.034b and thus slightly more than 50% higher than its current level of $30.023b. Whilst their goal to deleverage further during the second half of 2022 hinders their shareholder returns, on the flip side, it sees latent capacity to return even more of their free cash flow to shareholders during 2023 and beyond.
Author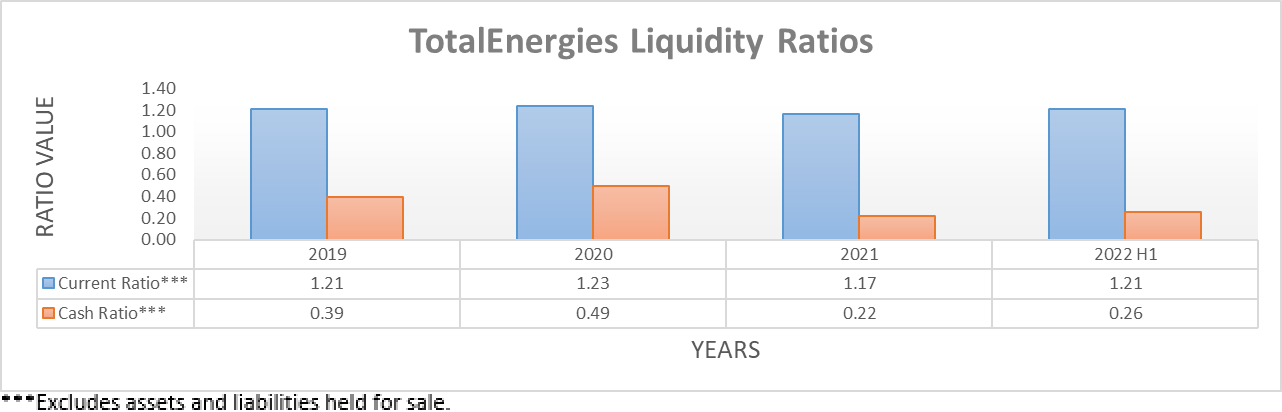
It was no surprise to see their liquidity remaining strong during the second quarter of 2022 with their respective current and cash ratios of 1.21 and 0.26 effectively equal to their respective results of 1.19 and 0.26 when conducting the previous analysis following the first quarter. Whilst not necessarily required right now with these very strong oil and gas prices, this nevertheless helps guarantee they can endure any turbulence possibly laying ahead if the growing economic risks hinder their free cash flow. Plus, due to their very large operational size, they should continue being able to source liquidity as required to refinance debt maturities or pursue other general purposes, even if central banks further tighten monetary policy.
Conclusion
Whilst I was disappointed that BP and Shell decided to focus their cash windfall solely towards share buybacks, thankfully it seems their lesser-thought-of peer TotalEnergies is showing them how it is done by including special dividends into the mix. Naturally, these will continue varying along with oil and gas prices but given their latent capacity to return even more free cash flow to shareholders during 2023 and beyond, it helps ease downside risks. Following this analysis, I believe that upgrading rating to a strong buy is now appropriate, thereby in line with my ratings for BP and Shell, despite the growing economic risks.
Notes: Unless specified otherwise, all figures in this article were taken from TotalEnergies’ Quarterly Reports, all calculated figures were performed by the author.
Be the first to comment