

Justin Sullivan
Thesis and Background
My last article on Meta Platforms (NASDAQ:META) is co-produced with Envision Research. That article focused on the timeline of META’s key initiatives. And the key thesis is that even though the metaverse future faces a long timeline, its existing business can provide enough cash to bridge the transition. In this article, I wanted to shift the focus to the specific shareholder return drivers in the next 5 years. The main goal is to understand the causes of its underperformance in that few years, and to provide an outlook for based on such an understanding.
META investors have been handsomely rewarded in the past decade. The stock delivered more than 565% total return over the past 10 years, more than double that of the SP500 (208.5%). However, the past 5 years is a complete disappointment. It not only lagged behind the overall market but also suffered a total loss of almost 20%. It is no secret that the company faces considerable headwinds ahead due to slowing user growth as well as greater public scrutiny of its practices. Daily active users and monthly active users rose only 4% and 3% in the past quarter, respectively. At the same time, costs were considerably higher due to both macroeconomic conditions and also competition.
All told, I am anticipating these headwinds to persist in the near future. And I also share the consensus sentiment as shown below for the next few quarters and expect mixed results. As seen, out of 47 analysts who provided estimates for META, only 1 provided an up revision in the last 3 months.
When the overall sentiment is so one-sided, it is always beneficial to take a step back and examine the basics. And it is the goal of this piece to examine its fundamental performance drivers in the past, based on which we can form a rational outlook for the future. And the key thesis is that the disappointing return drivers in the past 5 years are very likely to reverse gear for the next 5 years. I am projecting the stock to outperform the broader market in the coming years with a total return of ~16% per annum thanks to a combination of PE expansion, growth, and buybacks.
Source: Seeking Alpha data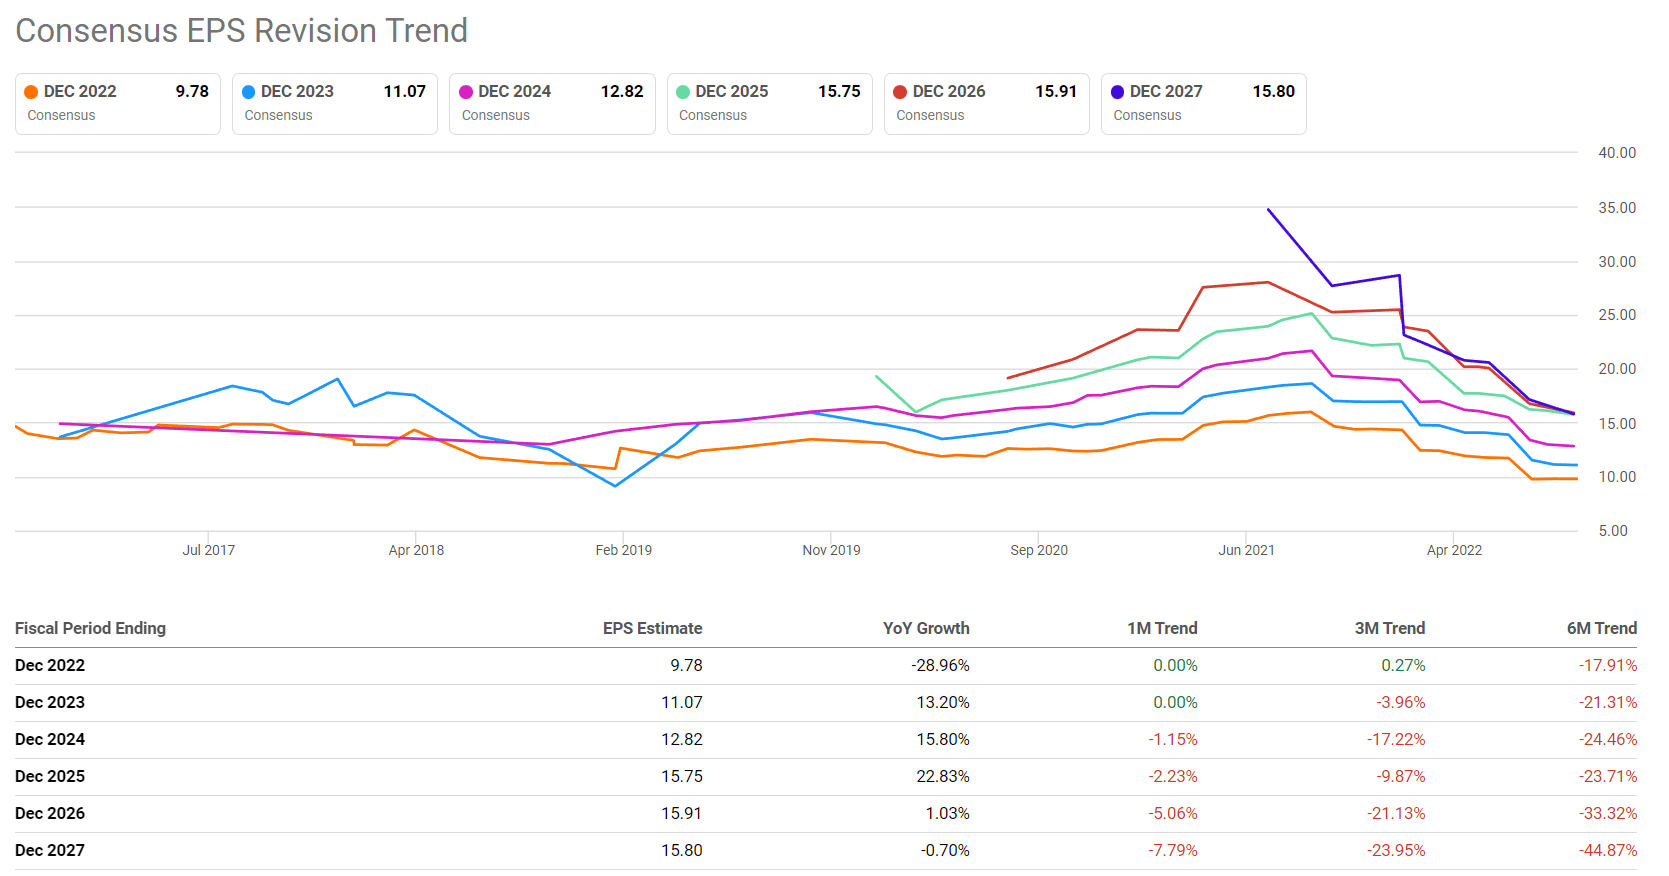
A historical perspective
As aforementioned, the past 5 years erased much of the lead that META had accumulated over the broader market. It suffered a total loss of almost 20% in the past 5 years, translating into an annualized loss of about 4.24% CAGR. In contrast, the overall market gained a total of 60%, translating into an annualized gain of 9.86% CAGR.
Source: Seeking Alpha data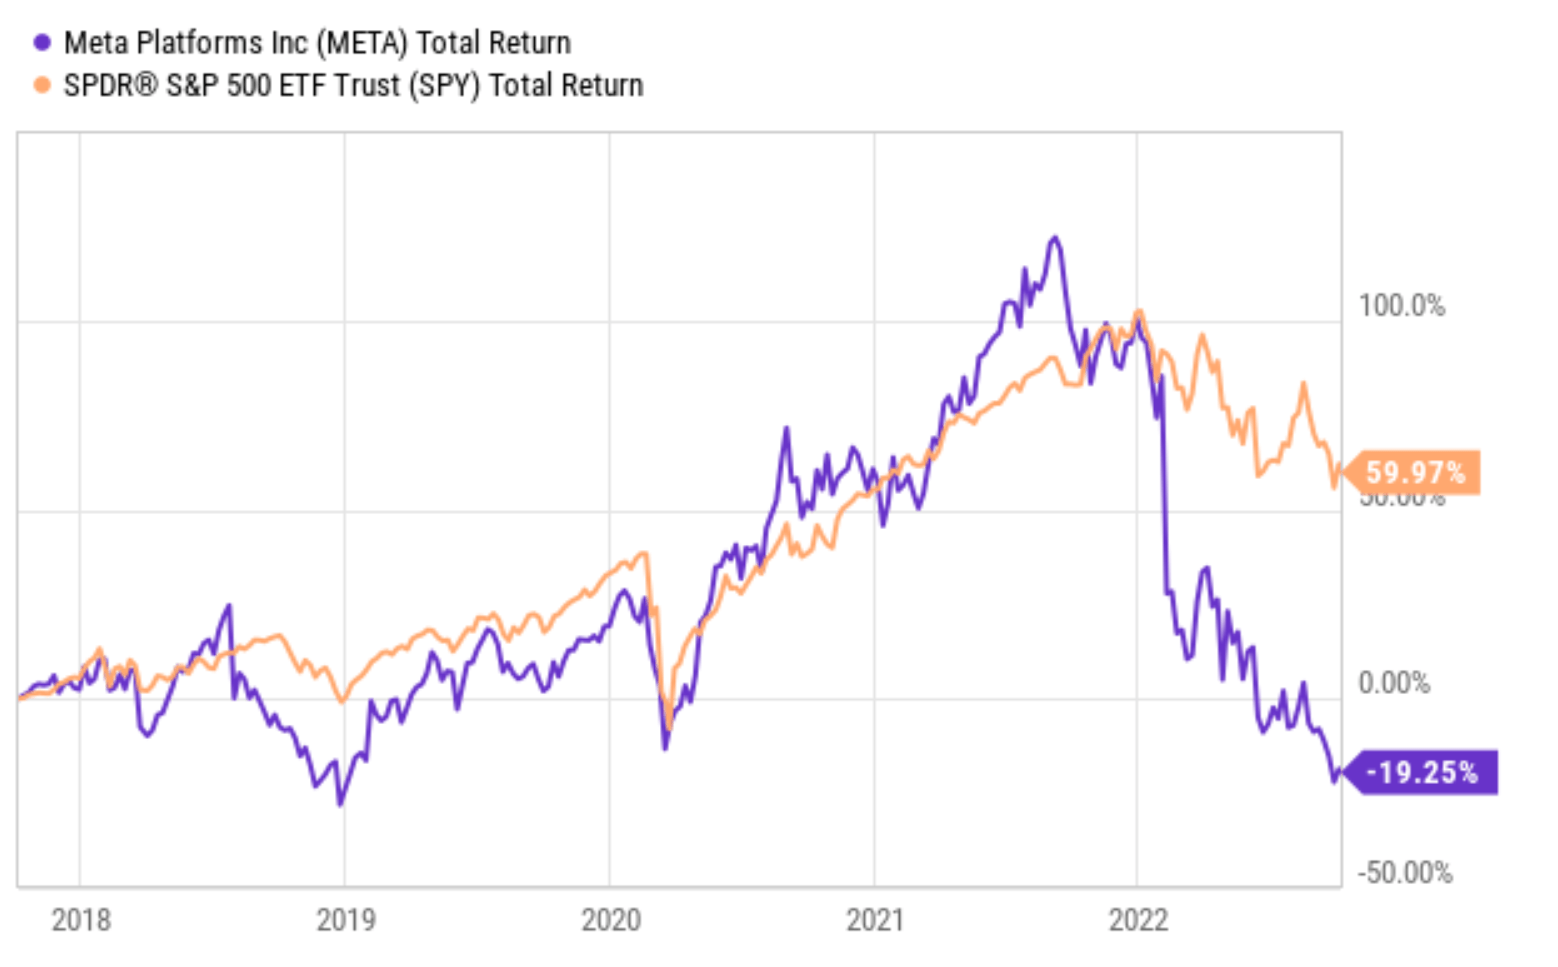
Digging a bit deeper, the root causes for the disappointments are twofold:
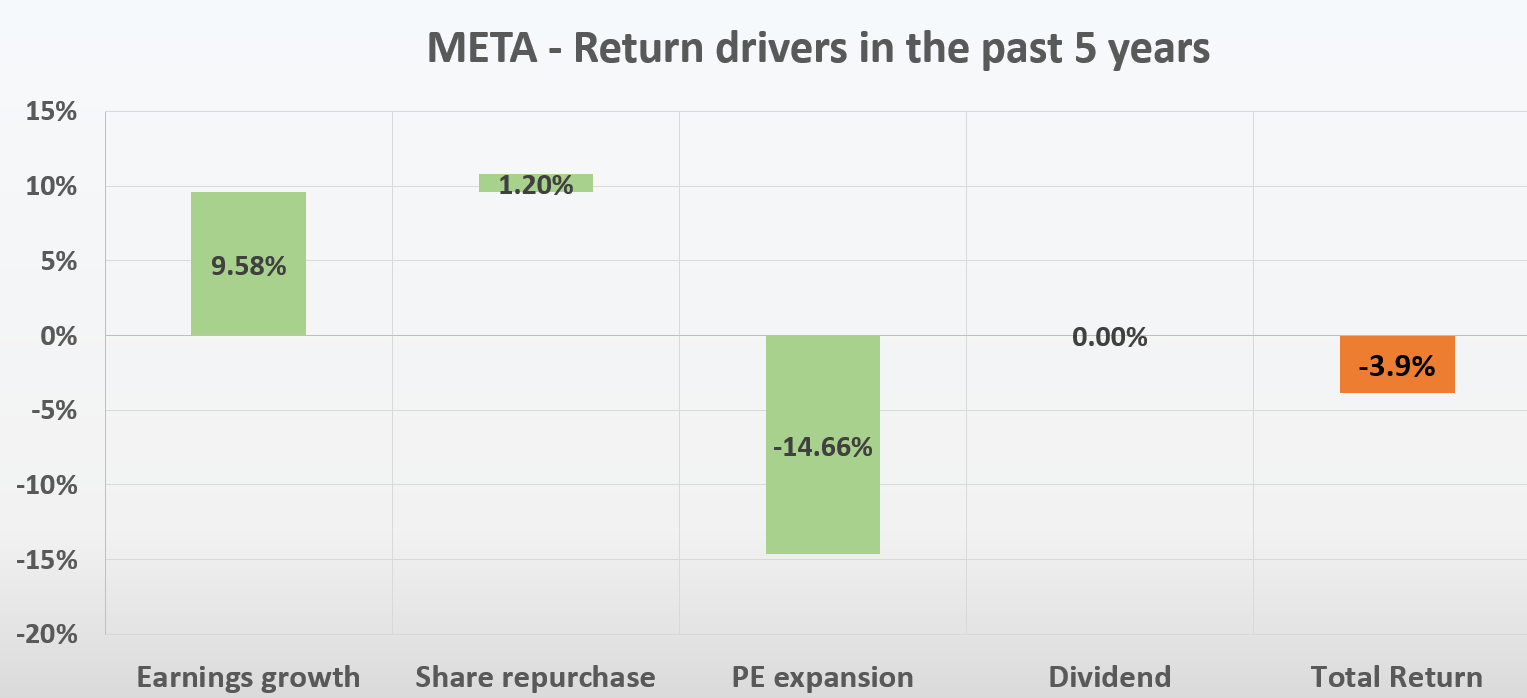
- First, growth slowed down. As illustrated in the next chart, over the past decade, META was able to grow its EPS at a rate of 51% CAGR – remarkable but also unsustainable at the same time. Indeed, in the past five years, the growth in EPS slowed down to about 10.78% CAGR. The EPS growth can be further broken down into the contribution from total earnings growth (9.58%) and also share repurchases (about 1.2%) as seen in the second chart below.
- Second, valuation contracted – dramatically. As to be detailed in the next section, its PE contracted from 15x five years ago to only 11.5x now, causing a negative 16.66% CAGR to the total return. The contraction was enough to cancel off all the earnings growth and lead to a 3.9% annual loss (the small discrepancy compared to the 4.24% loss quoted above is due to rounding off errors and the calculation of the PE using averaged prices).
Now looking forward, the natural questions are: would these return drivers remain the same in the next five years and deliver another disappointment? Or would they change?
And my answer is that they would change, as elaborated on immediately below.
Source: Author based on Seeking Alpha data Source: Author based on Seeking Alpha data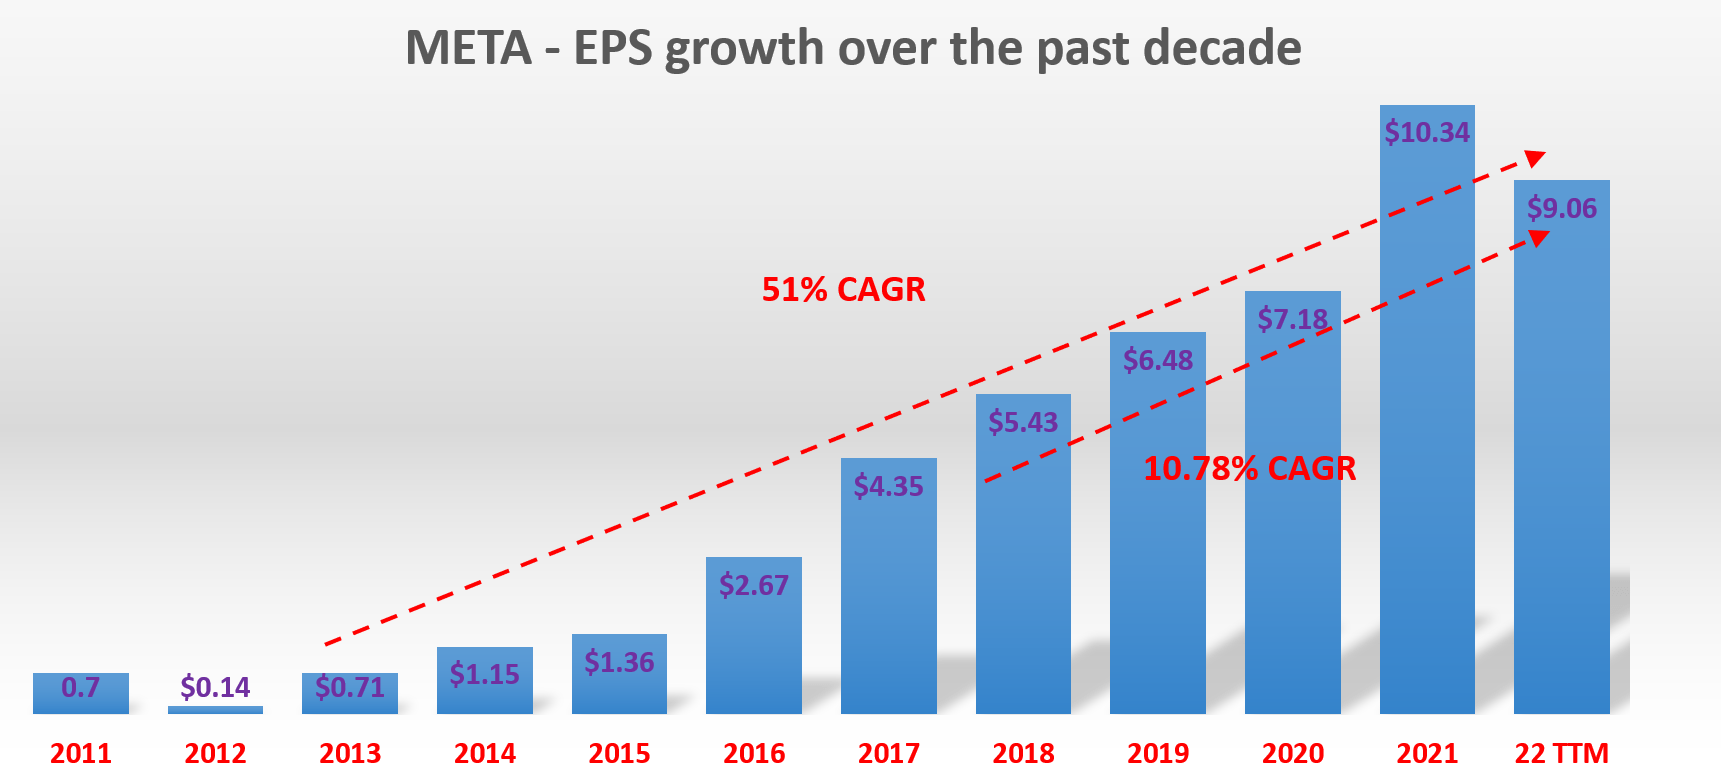
How would the PE change?
In short, I anticipate the PE contraction seen in the past 5 years to reverse. The following graph displays the stock’s yearly average PE over the last ten years. As can be seen, the average is 23.7x (excluding data points before 2016) and the standard deviation is 6.8. The current PE is only 11.5x. It is not only far below the historical average of 23.7x (it is less than half of the average), but has also fallen out of the minus-1-sigma range. Actually, it is close to the minus-2-sigma range, an indication of how negative the current market sentiment has swung.
Looking forward, I do not see its PE remaining compressed at 11.5x. I expect better results from 2023 and onward (and the consensus estimates seem to share the same view). The company remains well-positioned in the social media space. I expect active users to continue to rise, slowly but steadily. Furthermore, I see mobile advertising to provide another key driver for its performance and profitability. Finally, its investments in new technologies such as virtual reality ought to begin to pay off. These drivers should lead to healthy growth in the upper single digits (say 8% to 10%, more on this later) and trigger a valuation expansion.
Source: Author based on Seeking Alpha data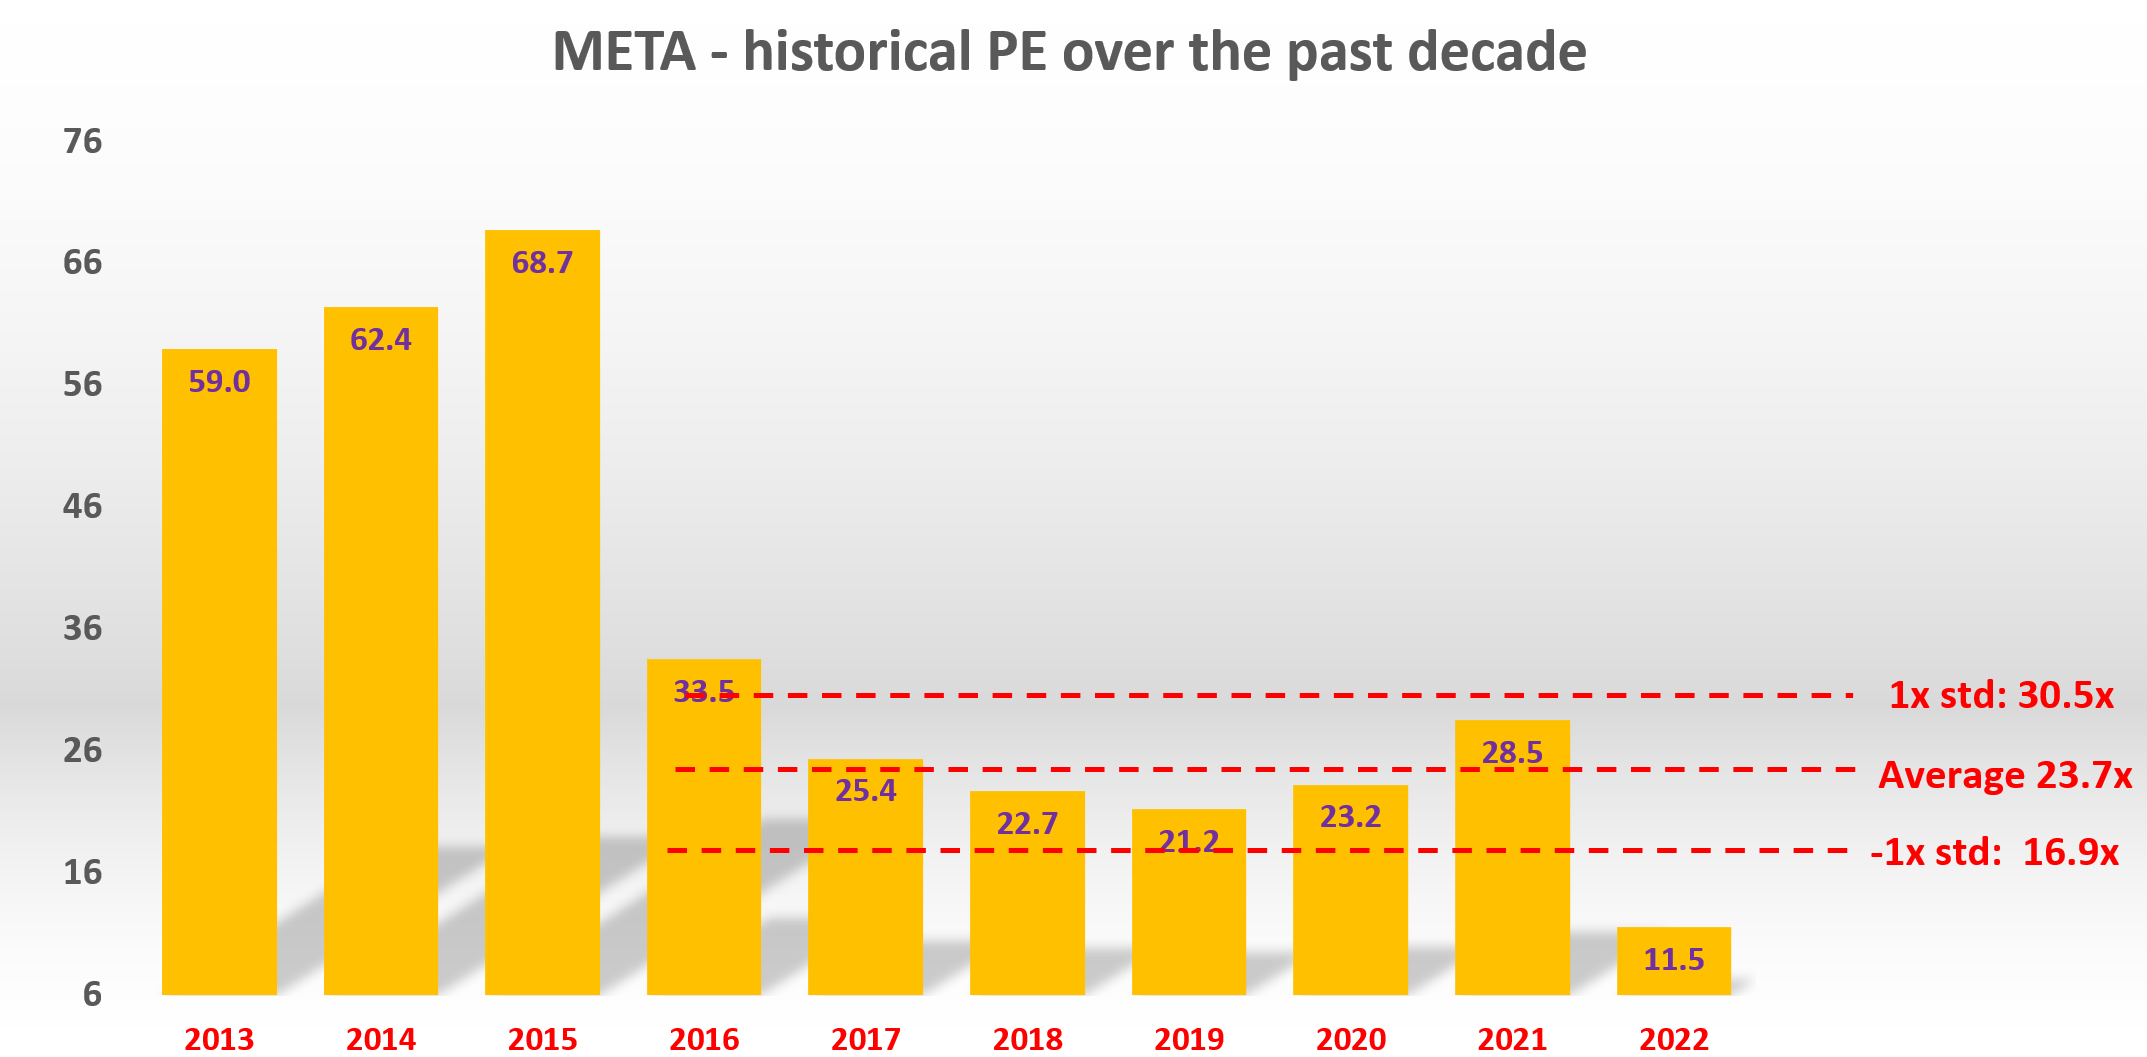
Would the EPS growth continue?
My take on this question is YES. I certainly expect the EPS to grow slower than it did in the 10 years. But at its current valuation, investors do not need spectacular growth to profit anymore. As seen, consensus estimates project a 10% CAGR in the next 5 years, from an EPS of $9.78 in 2022 to $15.8 in 2027. Next, you will see that my estimate, made from a completely independent approach, is quite close to the consensus estimates.
Source: Author based on Seeking Alpha data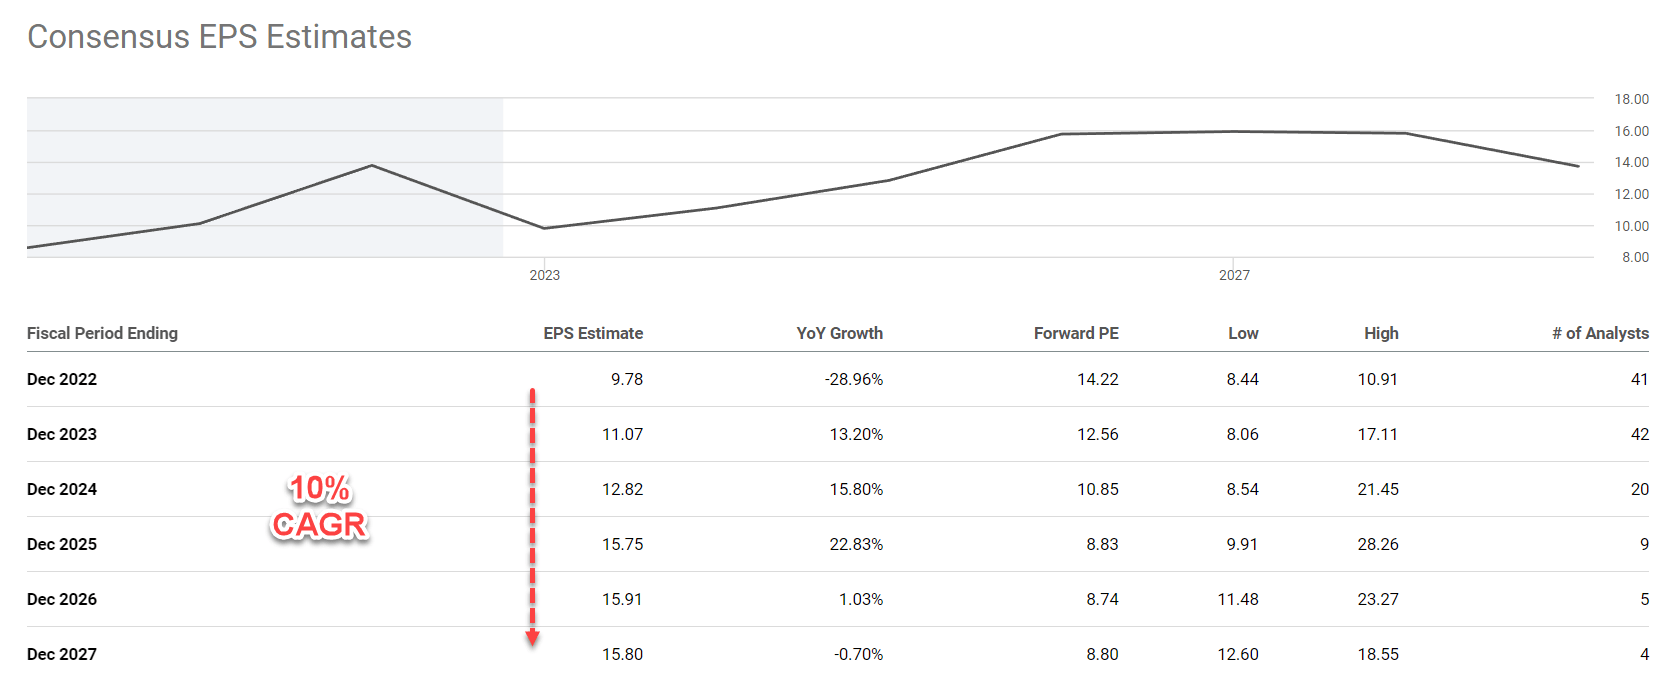
For a time frame sufficient long (like 5 years or above), I use the following framework to estimate the growth rate:
Long-Term Growth Rate = ROCE * Reinvestment Rate
ROCE stands for the return on capital employed. The analysis of ROCE has been detailed in my early article and I will just directly quote the results in the chart below. As seen, META was able to maintain a remarkable ROCE on average of about 66.9% in the past 10 years. And admittedly, the ROCE has been suffering erosion since 2017 due to the headwinds aforementioned, so some valuation contraction was justified. To wit, its ROCE has declined to 49% based on its TTM financials, and the average over the past 3 years has been 61.3%. Its current ROCE around 50% is still very competitive. As a reference point, the average ROCE of the FAANG group is around 50% to 60% in recent years.
Source: Author based on Seeking Alpha data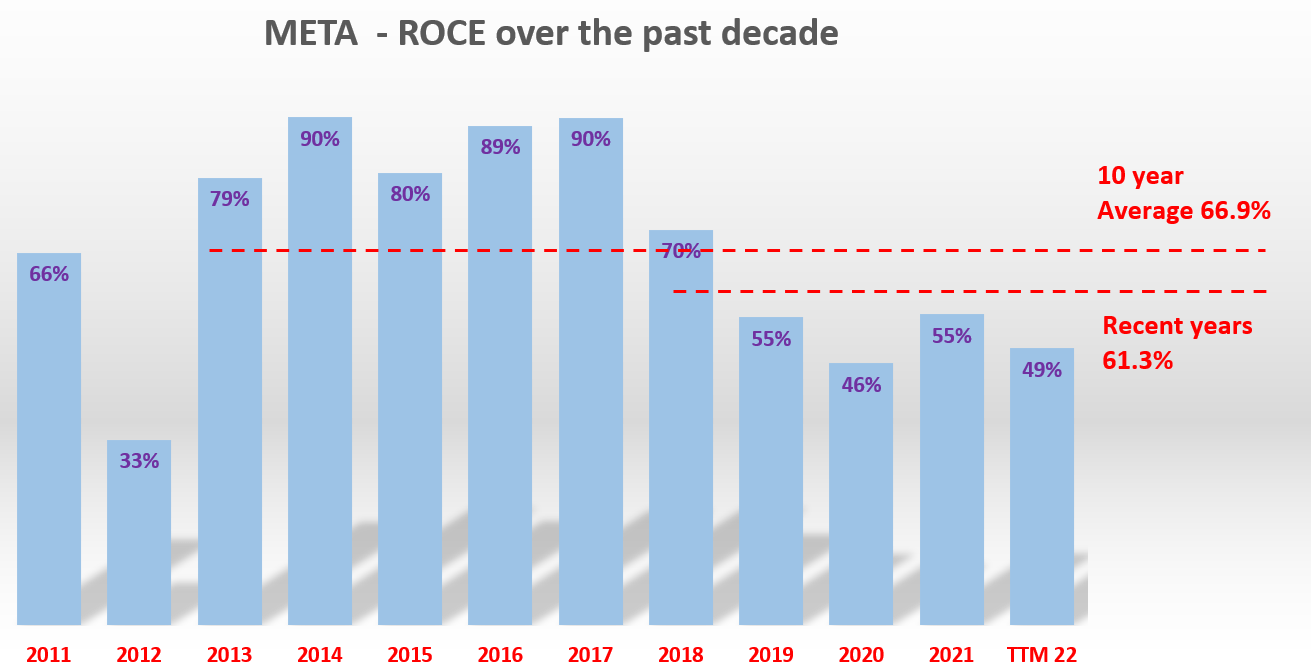
As to the reinvestment rate, the company has been maintaining a reinvestment of about 20% in recent years, largely driven by its aggressive initiative in the metaverse space. A ~20% reinvestment rate seems to me to be unsustainable in the long term. To put things into perspective, the average reinvestment rate in the FAAMG group is currently below 10%.
With this understanding, the next chart shows the long-term growth rate at different combinations of ROCE and reinvestment rates. The numbers highlighted in red are the most likely scenario given its current ROCE and my projected reinvestment rates. As seen, I expect annual growth in the upper single-digit (between 7.5% to about 9.5%). Note that in these estimates, I added a 2% inflation escalation factor.
And next, you will see why my estimates are quite close to the consensus estimates and why such growth can already drive robust shareholder returns.
Source: Author based on Seeking Alpha data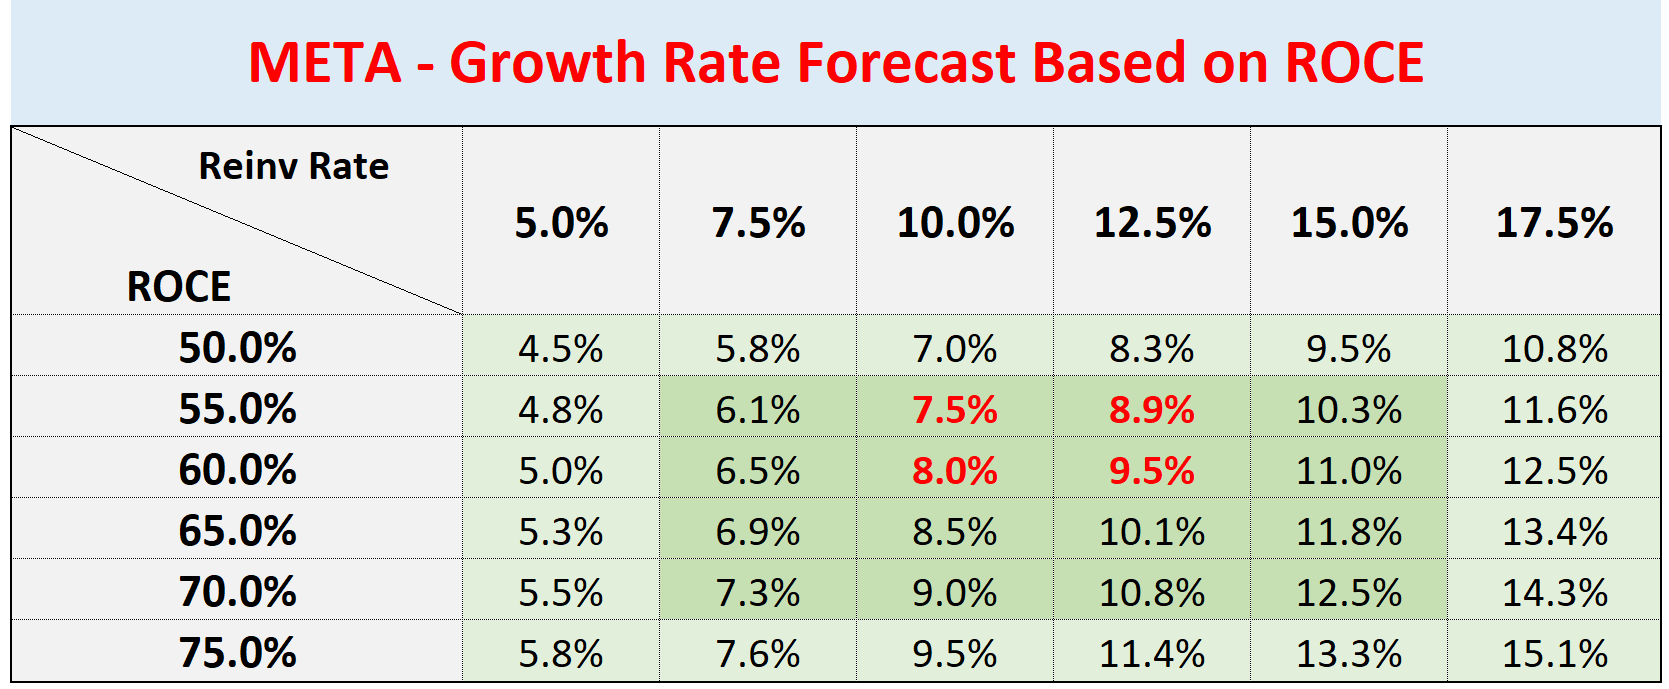
Projected return drivers for the next 5 years
Based on the above analysis of business fundamentals, and growth potential, the chart below summarizes my projection for the return drivers in the next 5 years.
- 10.5% growth in total profit. As mentioned above, I am projection an annual growth between 7.5% to about 9.5%. However, note that my projections are for the TOTAL earnings, not EPS. I am projecting a 2.5% share repurchases per annum based on its recent year level and management guidance. As a result, the growth in EPS (total earnings growth plus share repurchases) would be about 10.5% to 12% based on my approach, close enough to the consensus estimates.
- A valuation expansion to 15x PE. As aforementioned, I do not anticipate its valuation to remain at 11.5x. I anticipate an expansion, and the expansion can be catalyzed by a range of growth drivers including its investments in new technologies, its existing strength in the social media space, and mobile advertising. Assuming a conservative terminal PE of 15x, it will cause about 5.46% of annual ROI in the next 5 years.
Based on the above return drivers, the annual return should be around 16% per year as shown below.
Source: Author based on Seeking Alpha data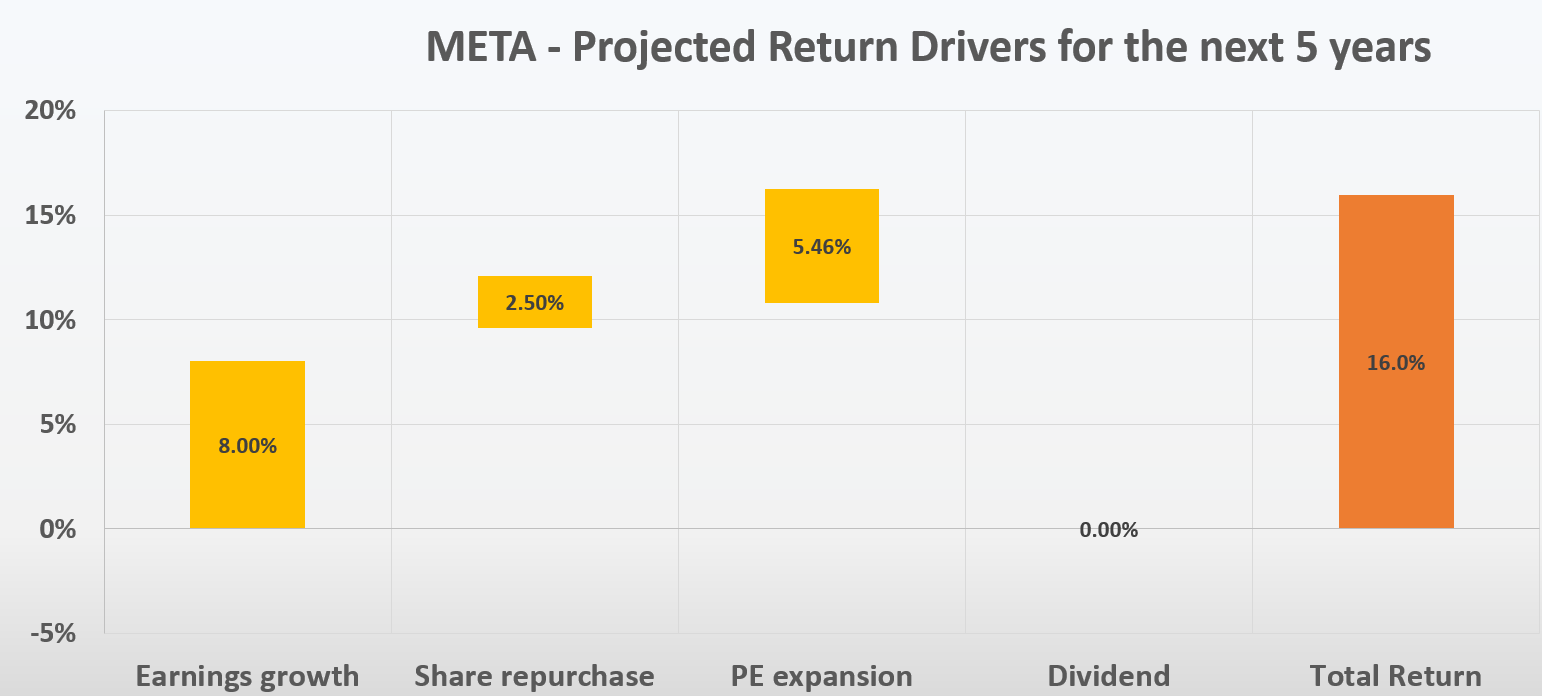
Other risks and final thoughts
To reiterate, META certainly faces considerable headwinds ahead. These headwinds include factors mentioned earlier such as slowing user growth, public scrutiny of its practices, and also cost control issues. Besides these issues, market demand renormalization is another immediate headwind. The COVID breakout unexpectedly accelerated the penetration of e-commerce and benefitted META. But now that acceleration is leveling off. The strengthening of the dollar is also another headwind to consider.
These factors have caused the market sentiment to be exceedingly negative, as reflected in its extremely compressed valuation of 11.5x PE.
But when the overall sentiment is so extreme, it is always a good idea to take a step back, look beyond the immediate issues, and form an outlook for the overall picture. And what I see is a very skewed return profile (~16% annual return) driven by a combination of PE expansion (~5.46%), earnings growth (8%), and share buybacks (2.5%).
Be the first to comment