

Khanchit Khirisutchalual
After coming in higher than expected in May 2022, new home sales dropped in June 2022. Combined with lower sale prices, the change sent the market capitalization of the new home market in the U.S. falling in a gloomy portent for the U.S. economy.
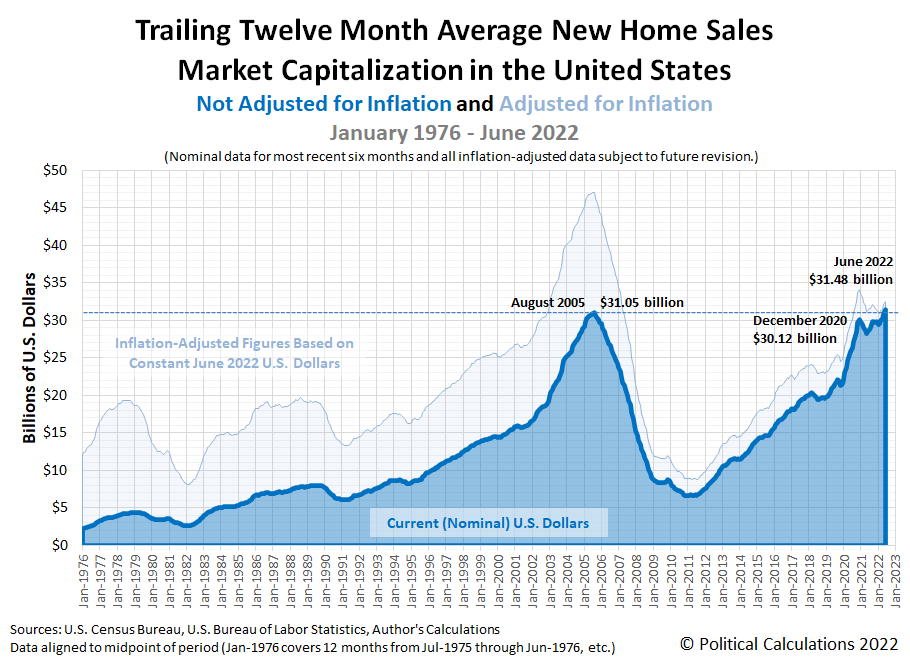
Political Calculations’ initial estimate of the market cap for new homes in the U.S. is $31.48 billion, down 3.8% from our initial May 2022 estimate of $32.73 billion (our revised estimate for May 2022 is $30.91 billion, more on that 5.6% decline in a bit). The latest update of our chart shows the developing trend for the U.S.’ new home market cap’s shifted trailing twelve month average:
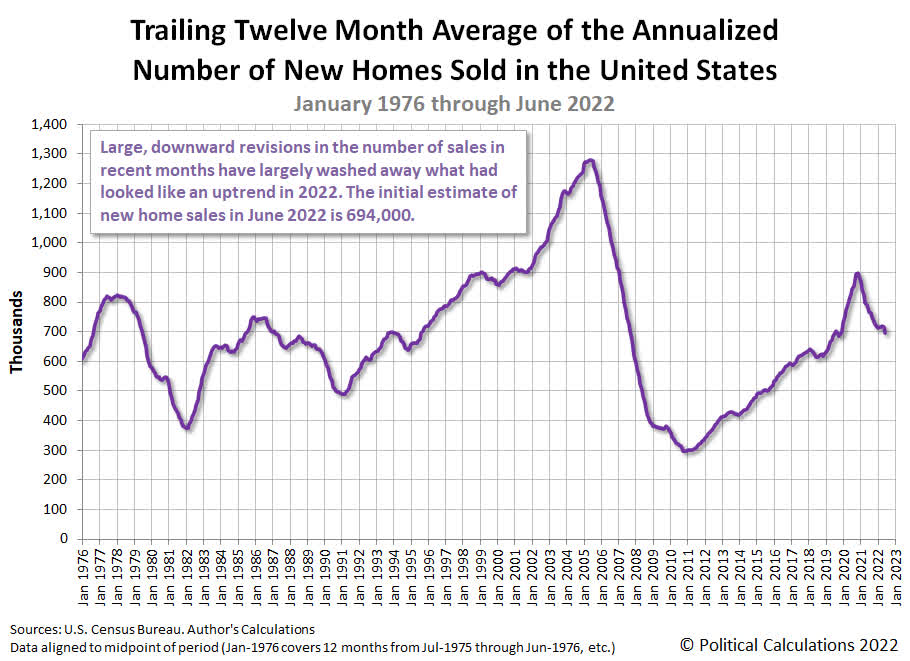
The next two charts show the underlying shifted twelve month averages of sales and price data for the new home market cap:
New home sales dropped significantly:
Average sale prices climbed to $512,552:
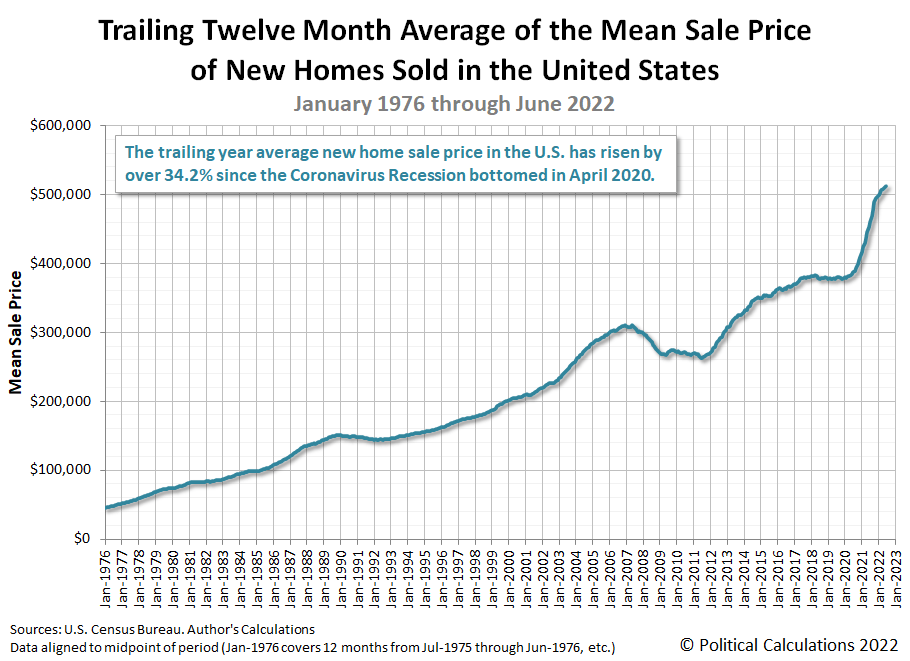
Downward data revisions for new home sales account for nearly all the changes in the market cap for new homes since April 2020. The latest data for new home sales indicates the uptrend established since November 2021 peaked in April 2020 and has since reversed to become a downtrend. A similar pattern is developing for the shifted trailing twelve month average of new home sale prices, which is still showing an uptrend, but one that is decelerating.
The revisions raise the question of whether new home sales, which contribute anywhere from 3% to 5% of the nation’s GDP, will be a plus or minus in 2022-Q2’s upcoming GDP report. The latest data suggests it will provide a flat-to-positive contribution, but that’s based upon the latest data, which will be revised several more times before being finalized. The large downward revisions in previous months’ sales reported in the latest data release suggest the new home market’s contribution to GDP has a strong chance of becoming a negative contribution to the U.S. economy’s growth in 2022-Q2.
Here is Reuters’ coverage of the raw national and regional numbers from the latest new home sales data release:
Sales of new U.S. single-family homes dropped to their lowest level in just over two years in June, the latest sign that rising mortgage rates, combined with higher prices, were dampening demand for housing.
New home sales tumbled 8.1% to a seasonally adjusted annual rate of 590,000 units last month, the lowest level since April 2020, the Commerce Department said on Tuesday. May’s sales pace was revised down to 642,000 units from the previously reported 696,000 units. Sales fell in the Northeast, the West and the densely populated South, but surged in the Midwest.
We’ll examine the relative affordability of the new homes being sold in the U.S. sometime in the first week of August 2022.
References
U.S. Census Bureau. New Residential Sales Historical Data. Houses Sold. [Excel Spreadsheet]. Accessed 26 July 2022.
U.S. Census Bureau. New Residential Sales Historical Data. Median and Average Sale Price of Houses Sold. [Excel Spreadsheet]. Accessed 26 July 2022.
Editor’s Note: The summary bullets for this article were chosen by Seeking Alpha editors.
Be the first to comment