

Edwin Tan /E+ via Getty Images
Marcus & Millichap (NYSE:MMI) shares have fallen 30% year-to-date as commercial property sales volumes deteriorate following the Federal Reserve’s rapid interest rate hikes in 2022. While year-to-date results have been strong, rising rates have caused a disconnect between potential buyers and sellers which is causing a rapid slowdown in commercial property transactions.
While cyclical headwinds are likely to cause declines in revenue and profitability at Marcus & Millichap, the company is well positioned for the long-term given its niche focus, proven management team, and exceptionally strong balance sheet ($14 per share in net cash & investments).
As I discuss below, I see the shares as being slightly undervalued today. However, should the commercial property market continue to soften in response to higher interest rates, I believe there is a decent chance investors will get to purchase more cheaply. I would be a buyer below $27/share which is a 30% discount to my estimate of fair value.
Niche Focus
Founded in 1971 by George Marcus and William Millichap, Marcus & Millichap is a leading broker of commercial properties with 82 offices throughout the US and Canada. The company has a history of success since its 2013 IPO with EBITDA more than quadrupling in the past decade.
MMI is unique amongst commercial property brokers in that it focuses on relatively small properties. MMI derives the bulk of its revenue from transacting $1-$20 million properties, typically on behalf of private clients (wealthy individuals). This is in contrast to commercial property behemoths like CBRE (CBRE) and Jones Lang LaSalle (JLL) which target large properties ($20 million++) transacted on behalf of institutional investors.
Marcus & Millichap Overview (Investor Presentation)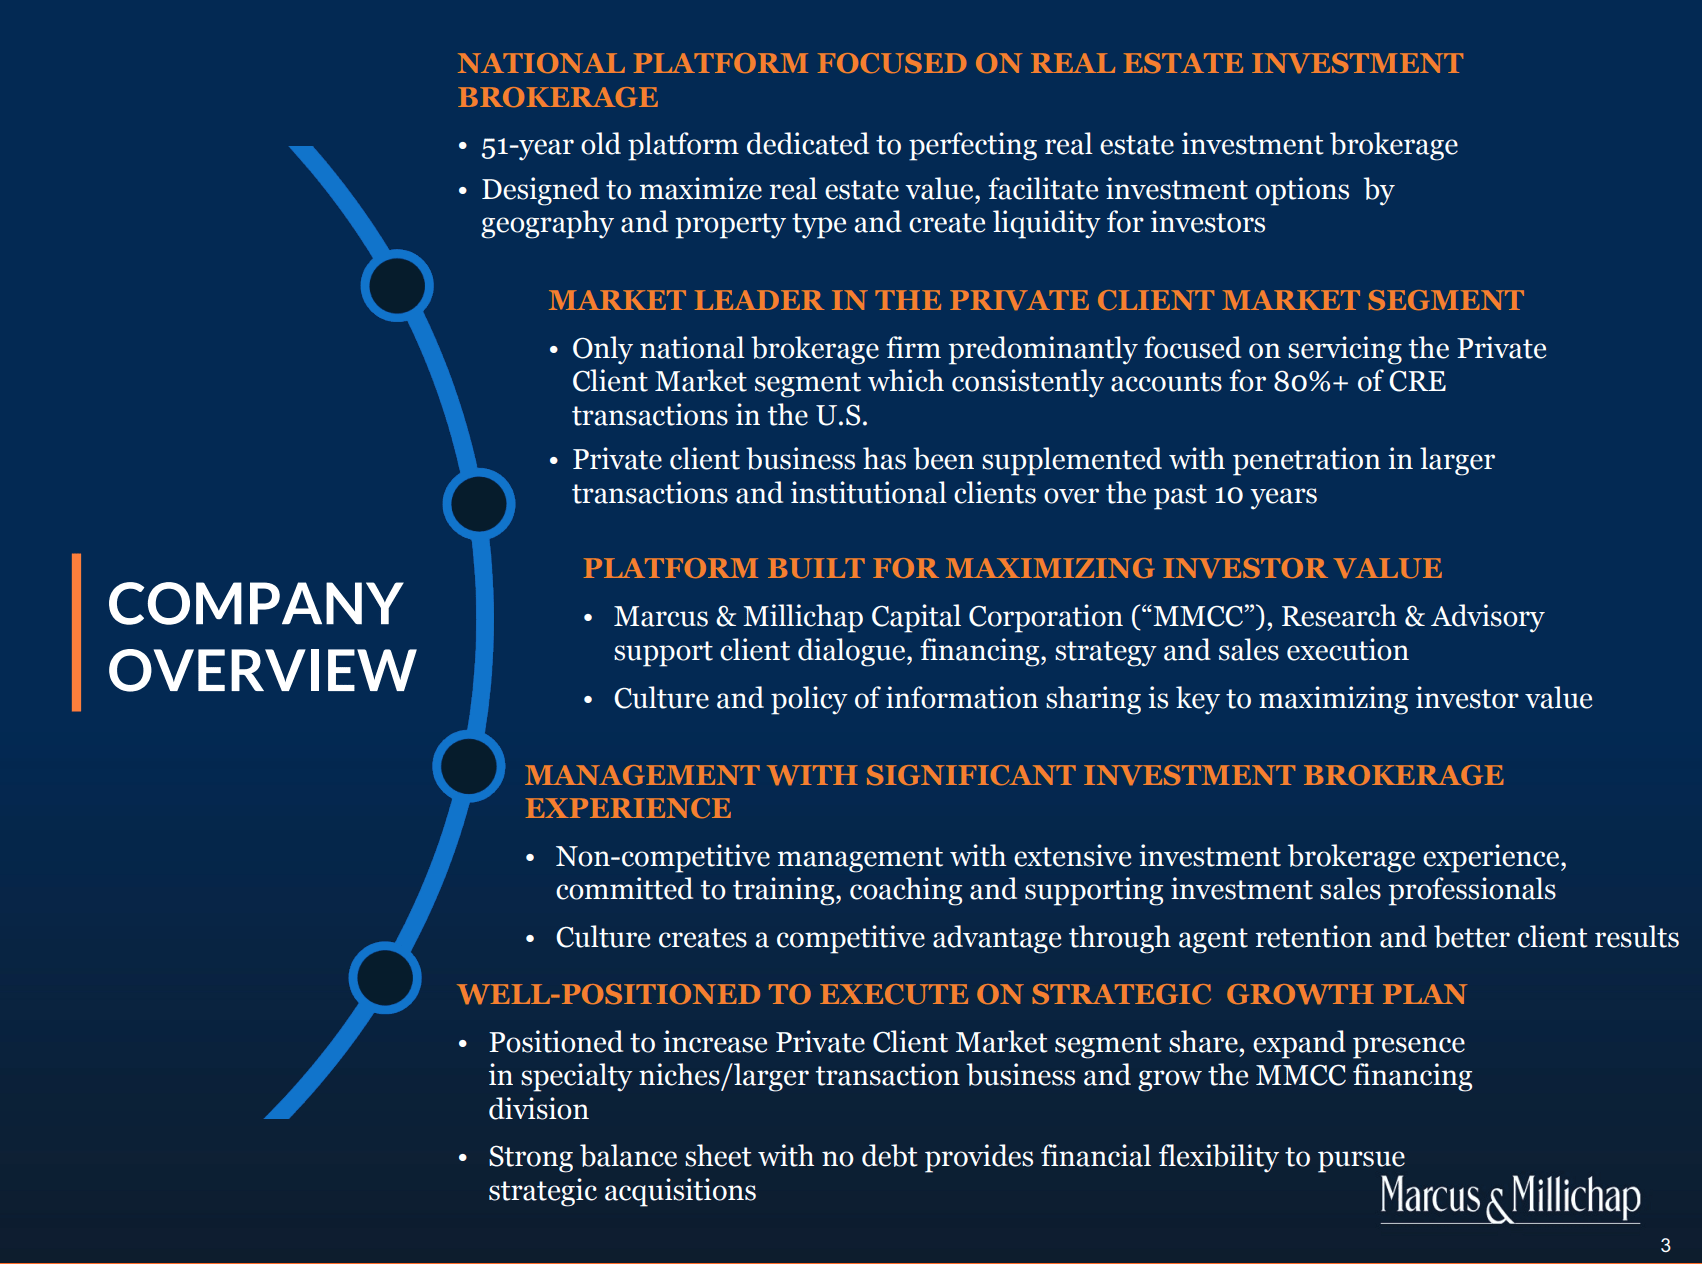
The private client (sub $10 million properties) segment generates much higher commissions as a percentage of transaction value (average of 3.7%; properties in the $10-20 million range generate ~2% commission) than large properties transacted by institutions ($20 million+ generate sub 1% commission levels). There are several reasons for this:
- Larger properties typically see more competition for each listing – sometimes involving a ‘bake-off’ amongst firms
- Firms like JLL and CBRE are willing to earn less on institutional transaction commissions in hopes of getting lucrative financing, property management, and leasing income. While MMI has a financing business which arranges property financing transactions (represents about 10% of total revenue). Unlike CBRE or JLL, MMI does not have a meaningful property services business. I see this as a negative given that the property services business (property management, leasing) is a more stable source of revenue and profitability, particularly in the current environment where property transactions and financings are declining (discussed below).
- While the commission percentages are higher for large deals, the absolute commissions tend to be smaller.
Commission Pool by Property Size (Investor Presentation)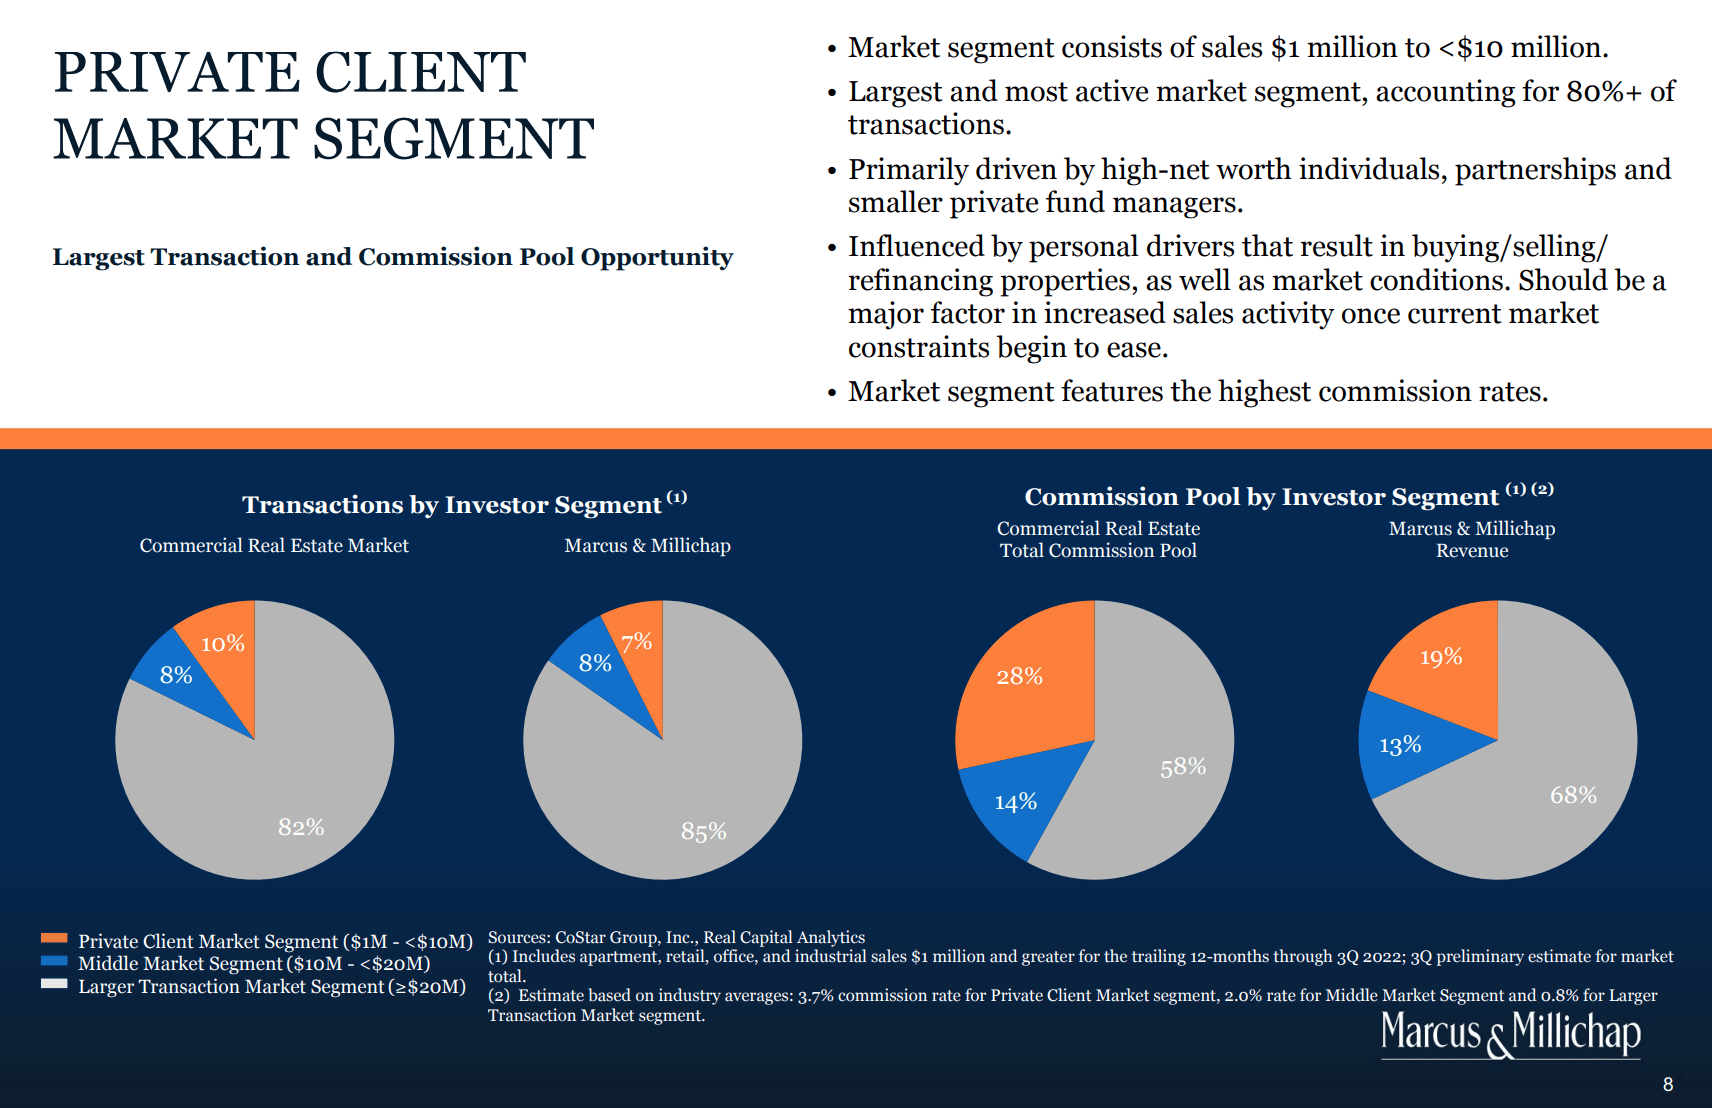
Current Environment
Transaction Volumes over time vs. Interest Rates (Investor Presentation)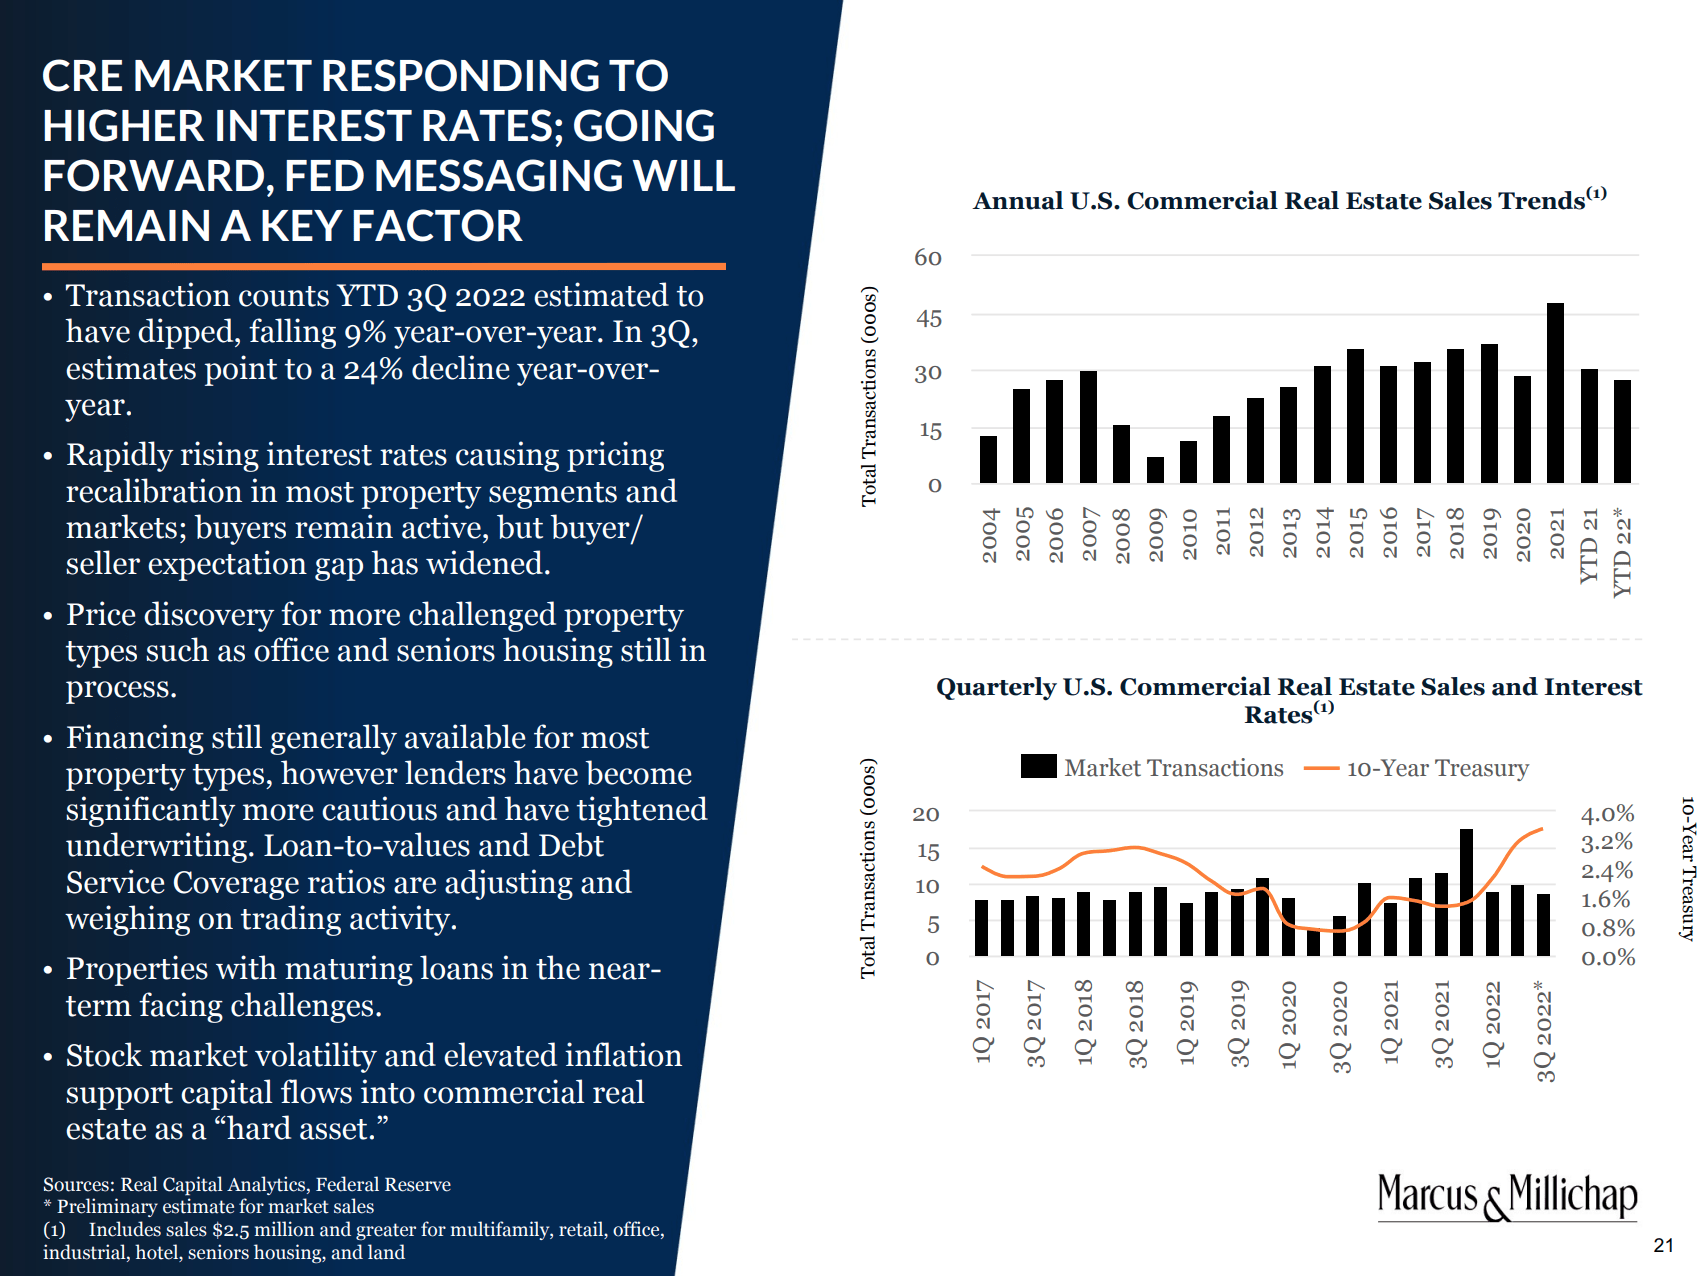
Thus far in 2022 MMI has achieved significant year-over-year growth in revenue and operating income (+21%) though this is a function of a very strong first half (before interest rates soared) which saw record results in transactions, commission, and financing revenue. As shown below, results deteriorated meaningfully in 3Q as interest rate hikes have had a more pronounced impact on property transactions. The chart above (lower right corner) shows that transaction levels are retreating toward longer term averages after having been elevated during 2021 and 1H22.
3Q22 Financial Results (Investor Presentation)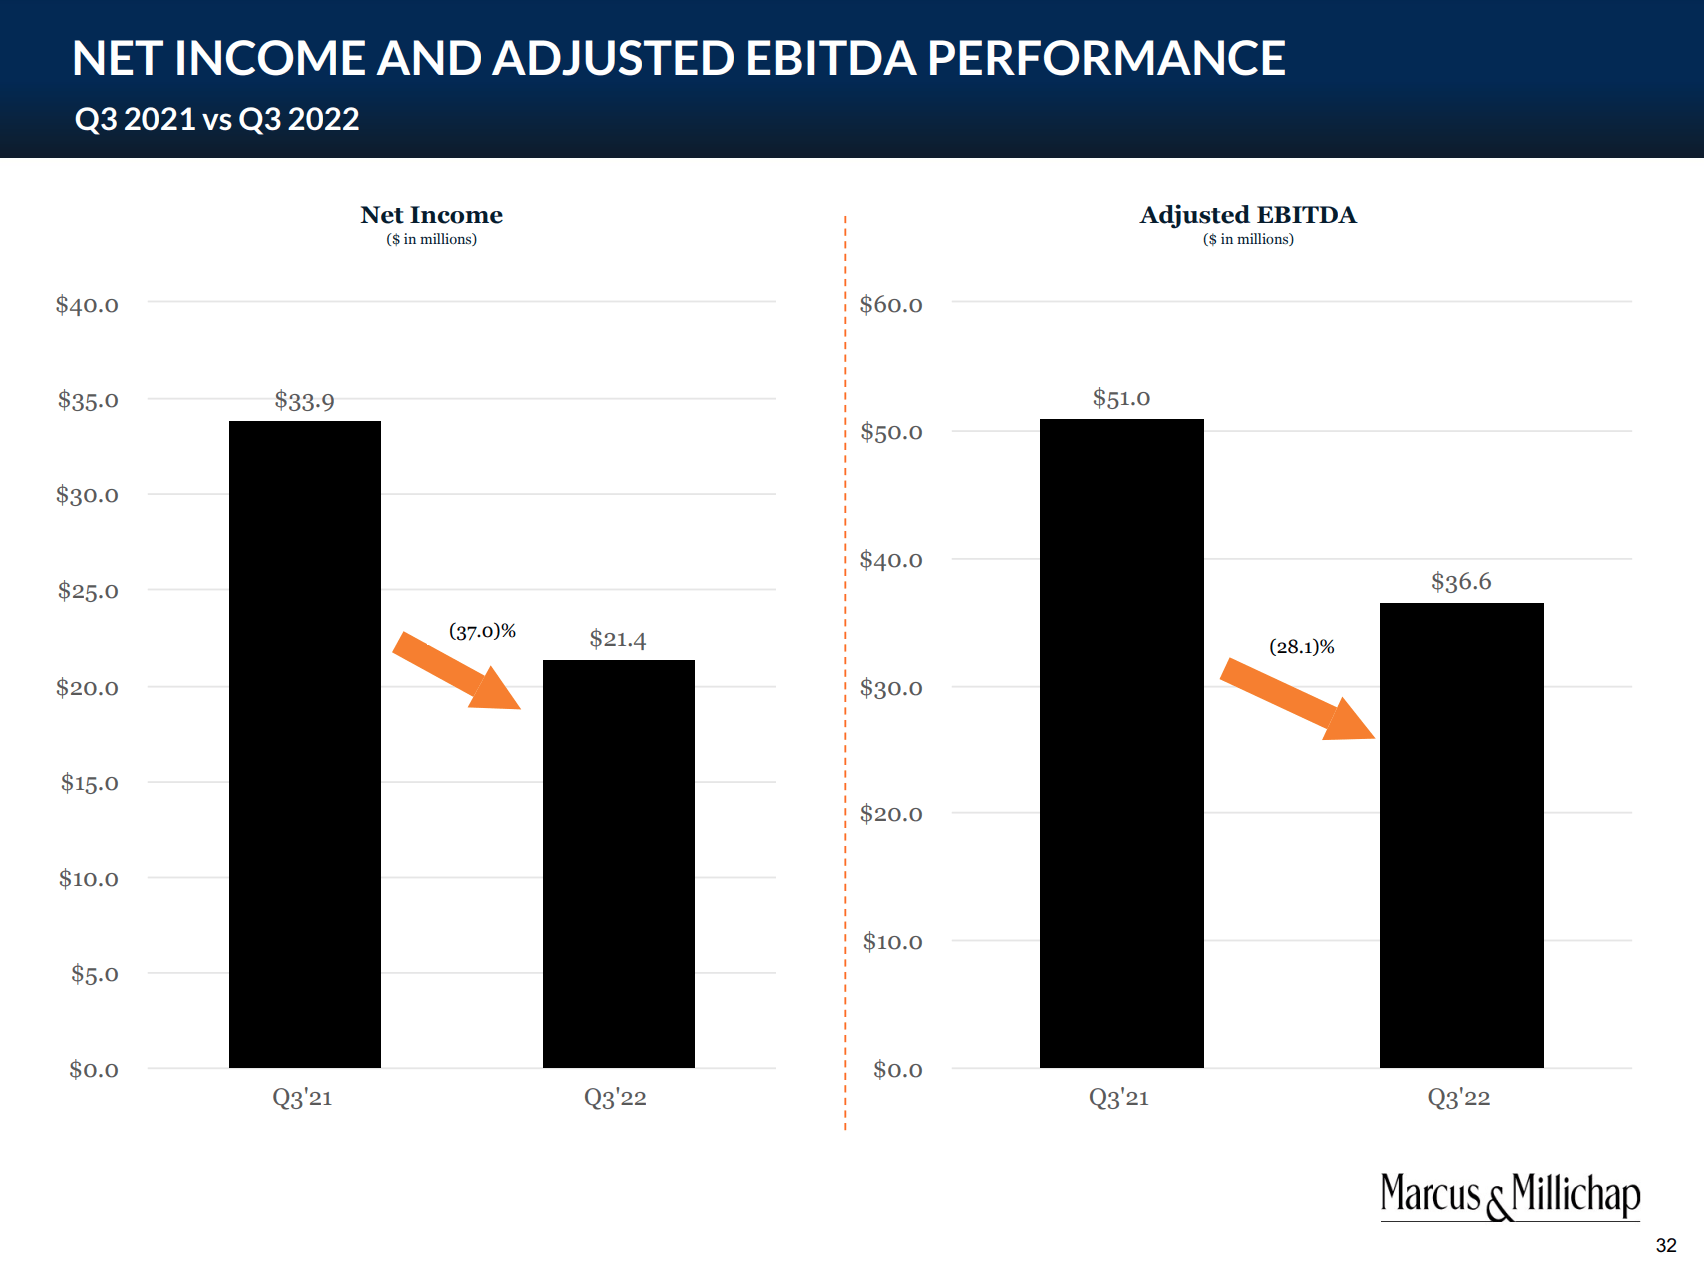
While the company does not provide quarterly guidance, it does provide some directional clues into expectations going forward. As shown below there it is reasonable to expect a meaningful slowdown ahead for both property transactions and financings.
Current Environment (Investor Presentation)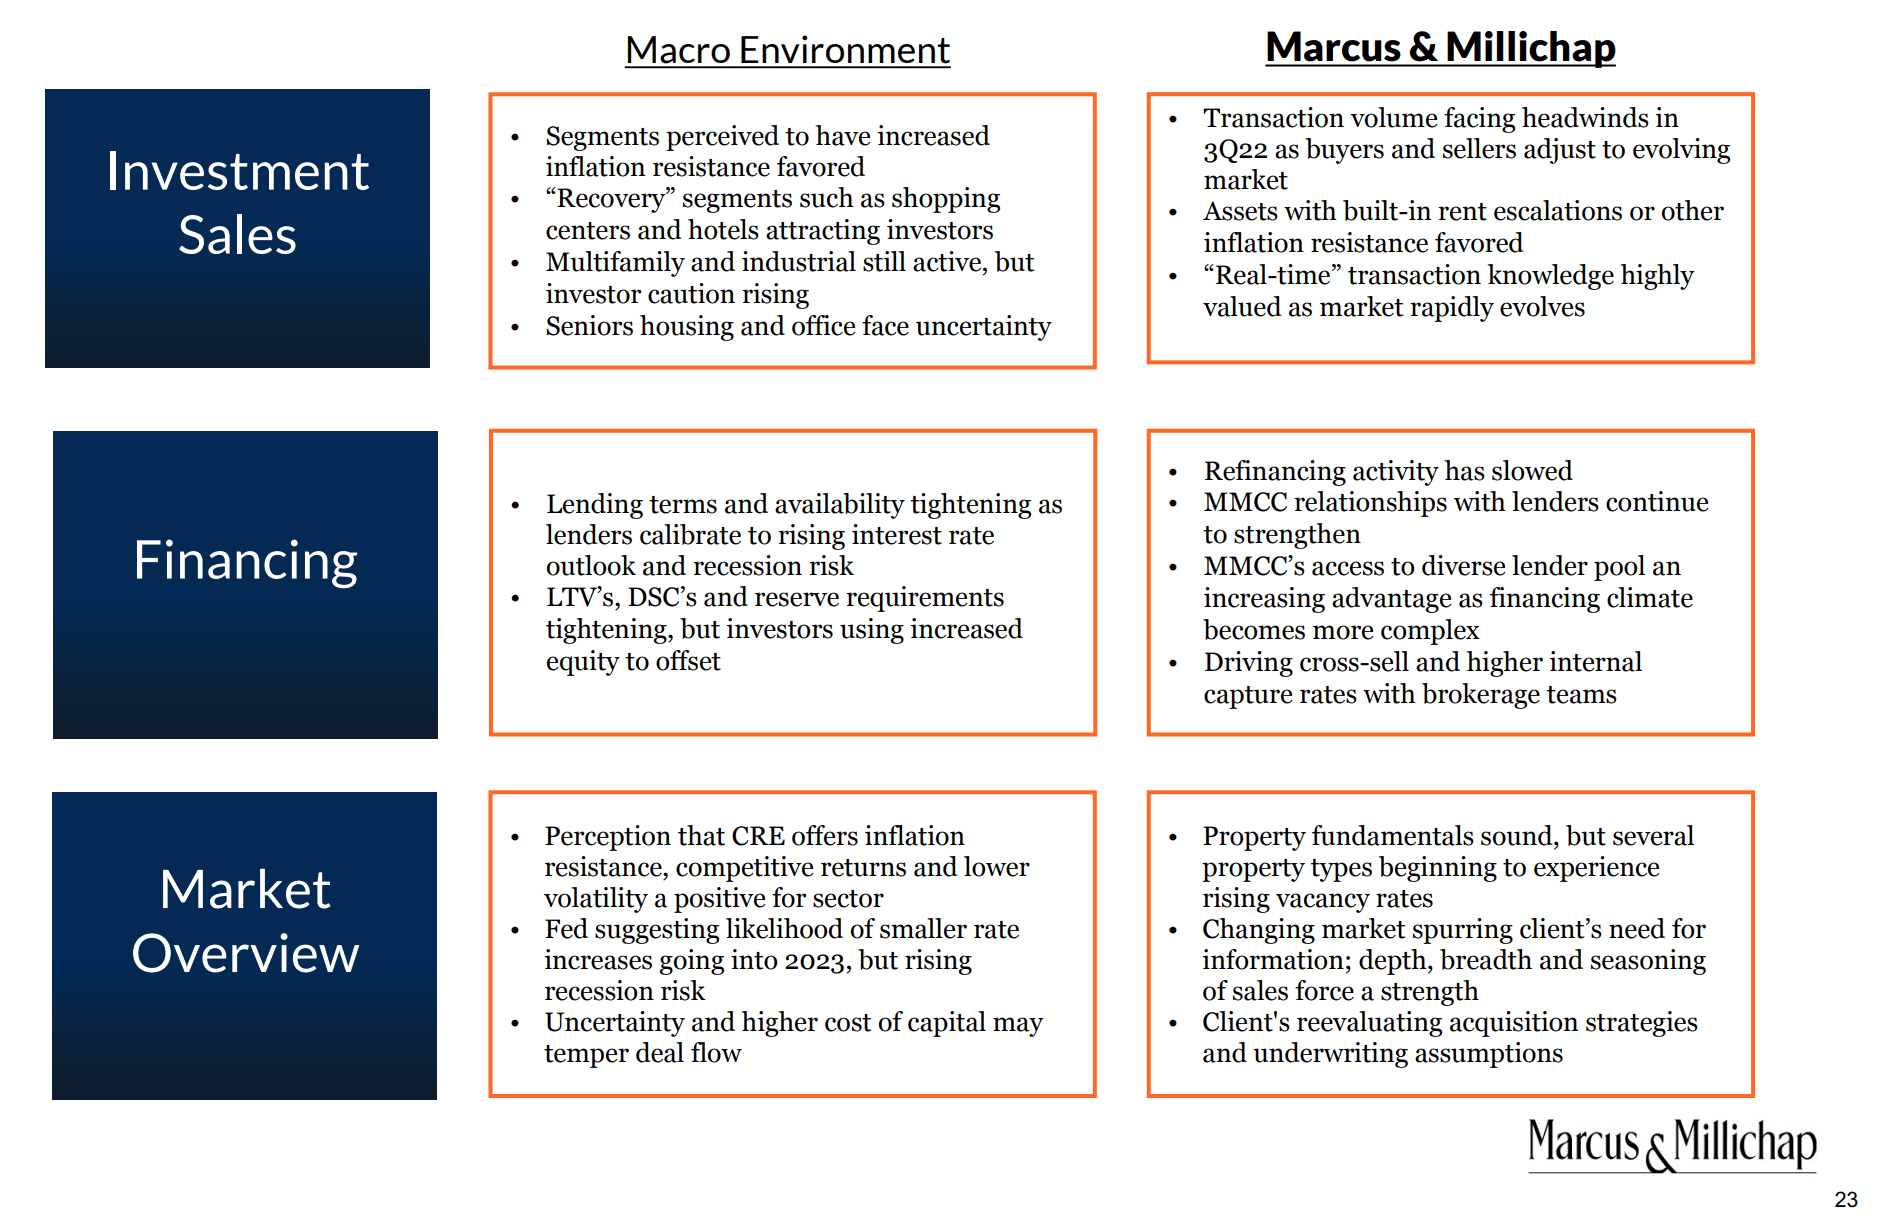
Valuation
While MMI trades at a very low (3.7x) valuation of trailing 12-month EBITDA, as market participants (myself included) believe EBITDA is set to fall significantly in the coming 12-18 months. Estimating ‘normalized’ EBITDA for a business as economically and interest rate sensitive as MMI is more an art than science, particularly given that recent results have benefitted from (until the past 3-5 months) a red-hot commercial property market fueled by low interest rates.
With that caveat, for the five-year period between 2015-2019 MMI consistently reported $100-$120 million in annual EBITDA. This period excludes both the 2020 year which was negatively impacted by the pandemic but also excludes what I view as being unsustainable results in 2021-22 (when 10-year US treasury yields were as low as 1%). As a point of reference from 2015-2019, the 10-year US treasury ranged from 1.6 to 3.3% (versus 3.6% now). While in the near term it is possible (likely?) that annual EBITDA will fall below this level (as interest rates cause buyers/sellers to pause) I believe the 2015-2019 average EBITDA of $110 is reasonable estimate looking out 3-5 years.
As shown below, I see MMI as being somewhat undervalued at 7.3x 2015-2019 average EBITDA (from 2015-2019 MMI traded at 6-10x EV/EBITDA). As a value investor, I want to buy in at a 30%+ discount to fair value. Using my midpoint valuation (9x average 2015-2019 EBITDA), I get to a $39 per share value which suggests a buy price of $27/share (20% below current price).
MMI Valuation (Company Filings; Author Estimates)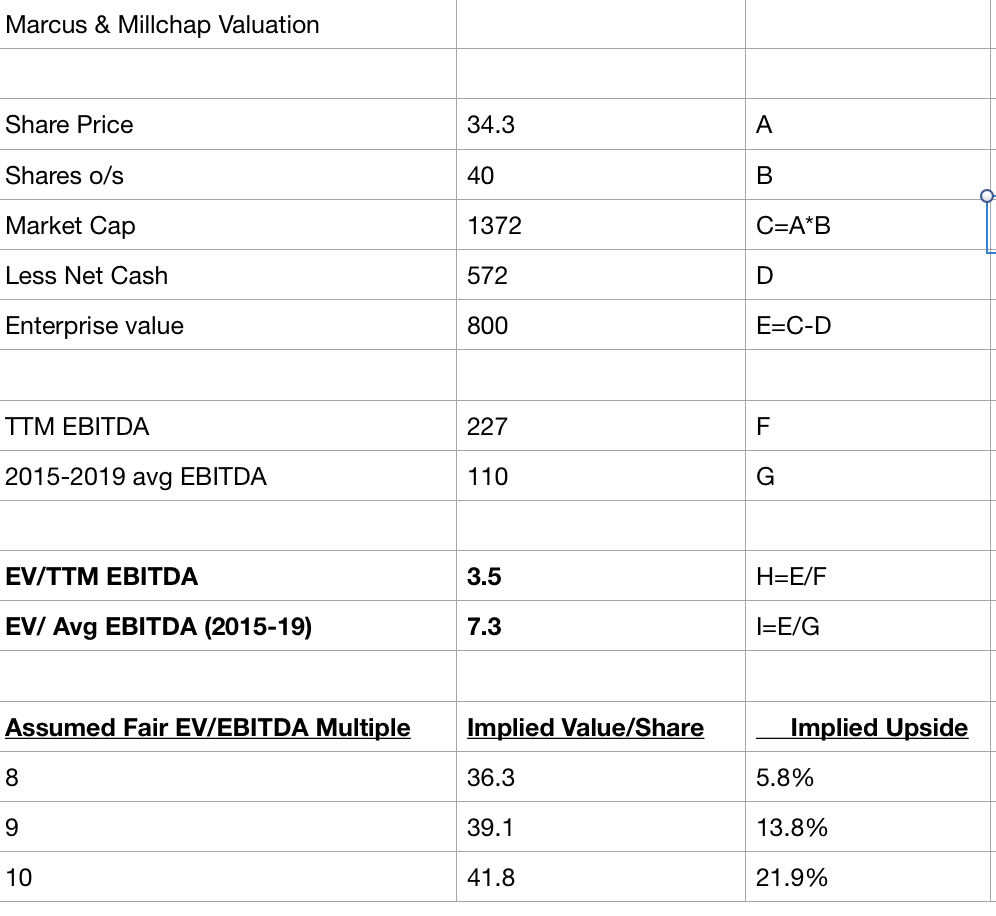
Further, while near term results may be ugly, I expect that over time, MMI will get stronger given the company’s market leadership position and fortress balance sheet ($14 per share in net cash). A strong balance sheet enables MMI the opportunity to continue to invest in the business during market downturns both organically (investment in technology and hiring) as well as making opportunistic acquisitions. Additionally, a strong balance sheet allows MMI to take advantage of share price weakness via share repurchases.
Strategic Growth Objectives (Investor Presentation)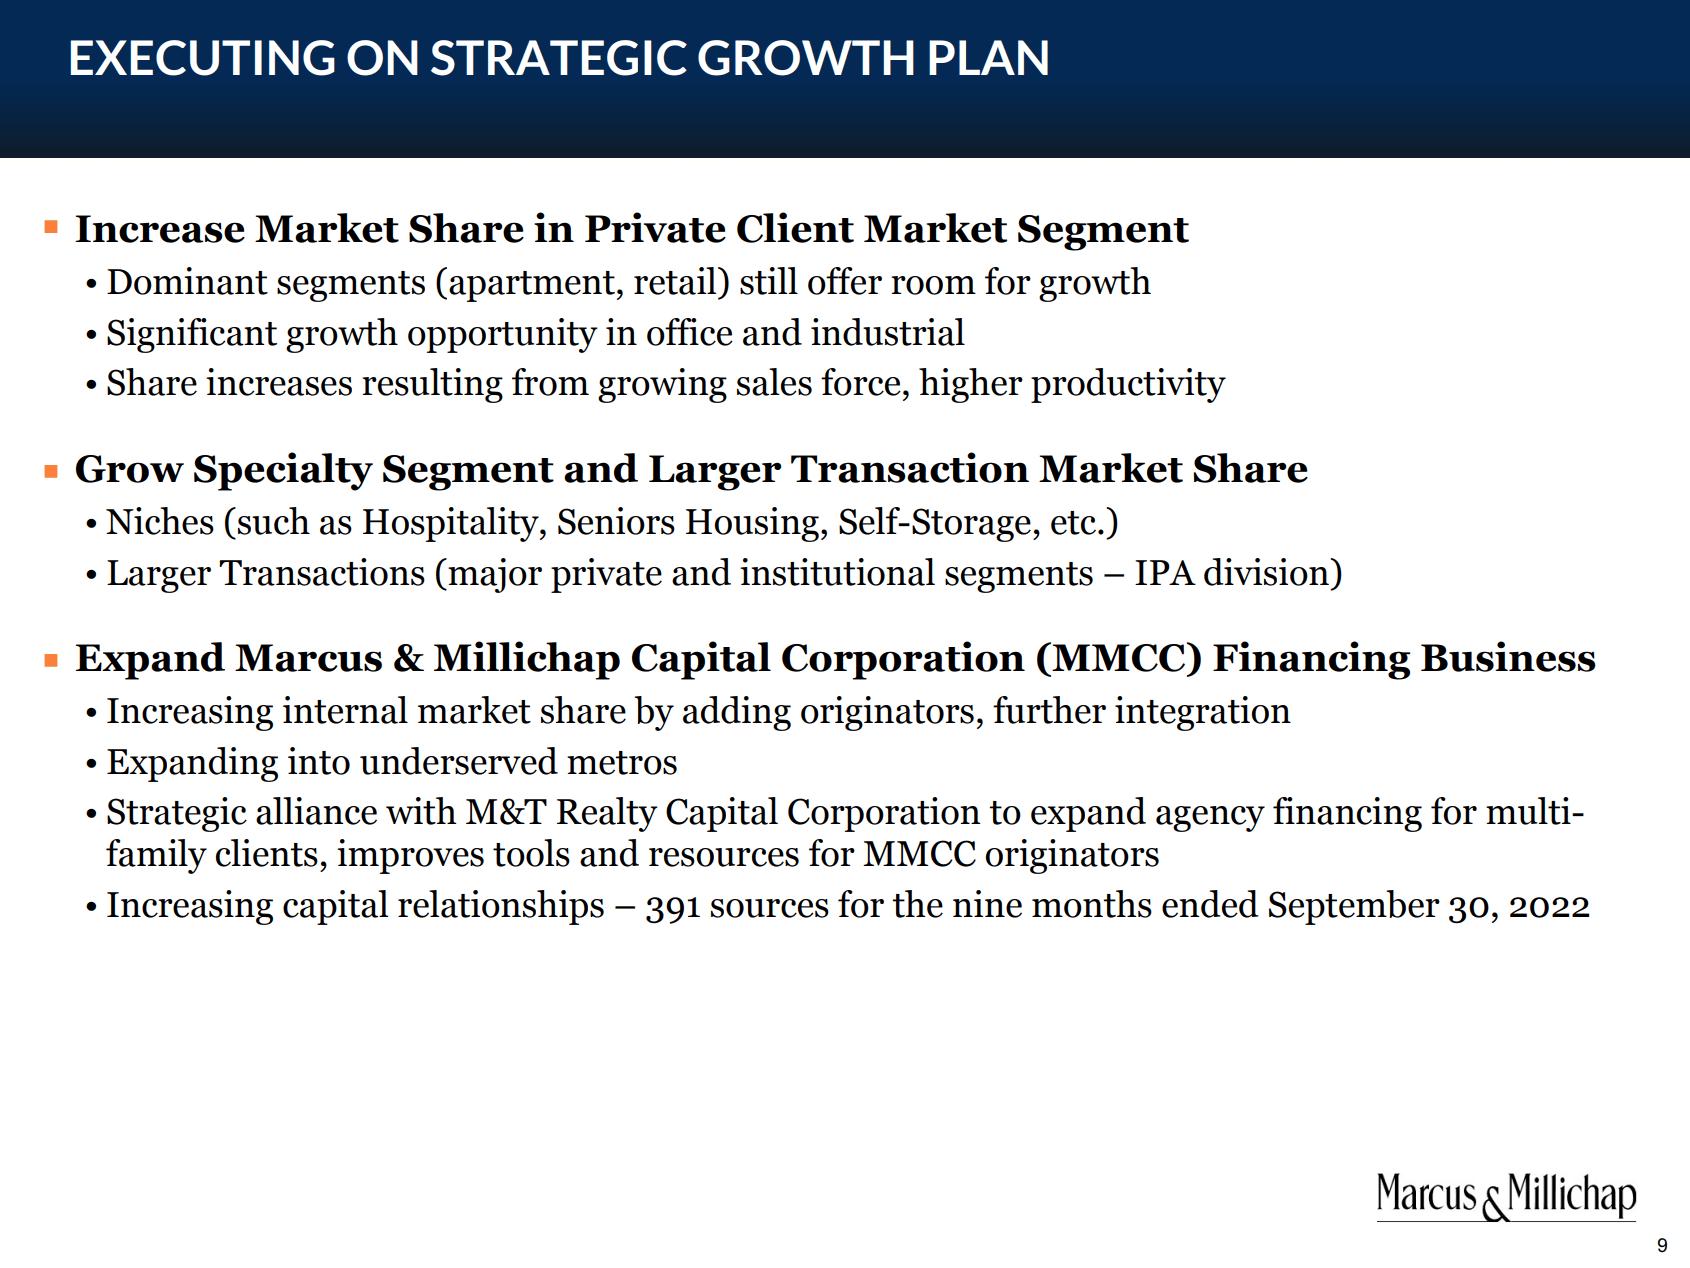
Conclusion
While the near-term is likely to be turbulent, I see MMI as well positioned over the long-term given its niche focus and strong balance sheet. Assuming a significant slowdown (which is beginning to manifest itself in results) in the business, I see shares as being somewhat undervalued today at $34.80 versus my base case fair value estimate of $39. Should shares continue to weaken, I would be a buyer below $27 per share, which represents a 30% discount to my estimate of intrinsic value.
Be the first to comment