

anyaberkut
Bear markets are a great reminder of what matters. Not stories, not speculative manias, but real, tangible fundamentals like safe dividends, cash flows, and strong balance sheets.
And do you know what’s even better than safe and growing dividends to help you stay sane and safe in a bear market? Safe high-yield paid monthly.
Nothing helps pay monthly bills like monthly dividends, and nothing helps turbo-charge dividend reinvestment compounding like a bear market.
Today I am highlighting the three reasons why Main Street Capital (NYSE:MAIN), one of the world’s best monthly high-yield blue-chips, is one of the world’s best monthly high-yield blue-chips is a potentially wonderful opportunity for you to profit from this bear market.
Not just because it could potentially more than double in the next five years, but potentially help you achieve life-changing wealth and income that could be the answer to your rich retirement dreams.
Reason One: Main Street Is One Of The Best Monthly Dividend Stocks On Earth
Here is the bottom line up front on MAIN.
What Main Street Does
Main Street is one of the few internally managed BDCs or Business Development Corporations.
(Source: investor presentation)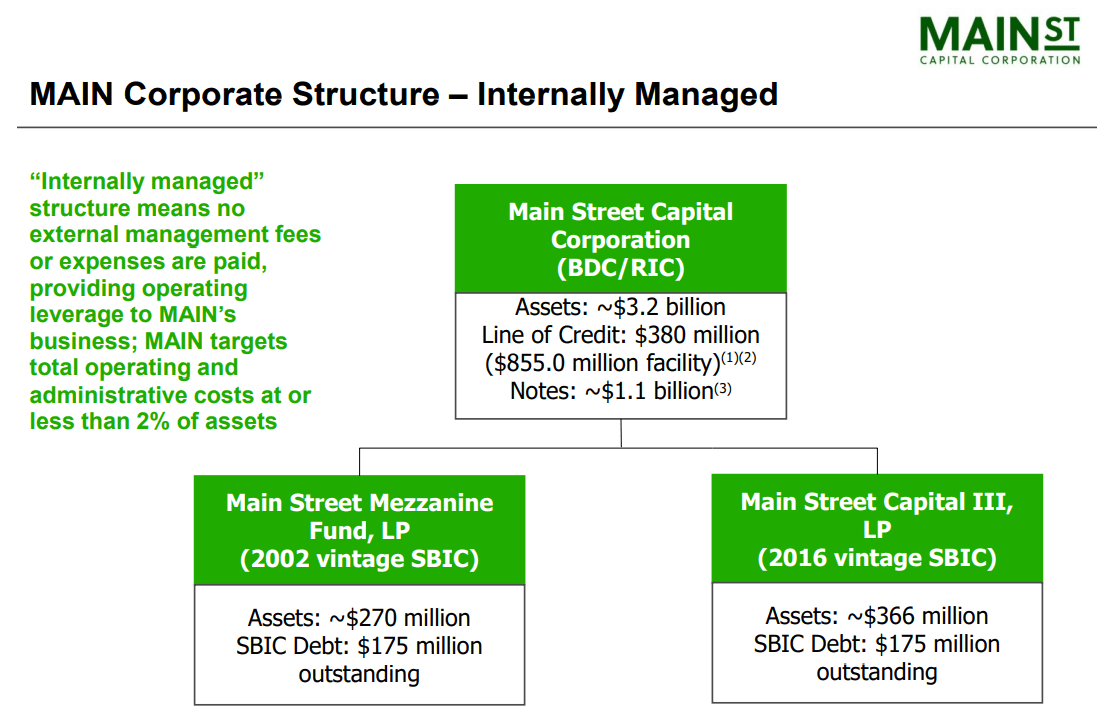
- management works directly for investors
- externally managed BDCs pay a 3rd party to run them
- management gets paid fees based on assets
- Provide an incentive to grow the business even if EPS, NII/share, and book value/share don’t grow
- internal management is the gold standard of governance in this industry
BDCs lend to private companies.
(Source: investor presentation)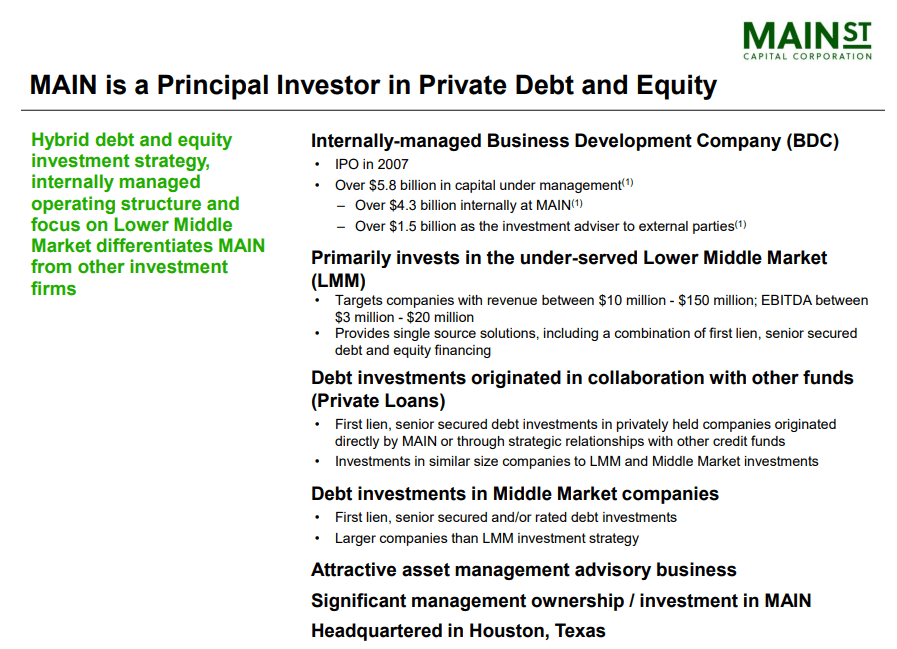
MAIN lends to the small businesses that big banks don’t want to lend to (due to stricter regulations following the GFC).
They usually lend to companies with $10 to $150 million in annual sales and $3 to $20 million yearly cash flow.
(Source: investor presentation)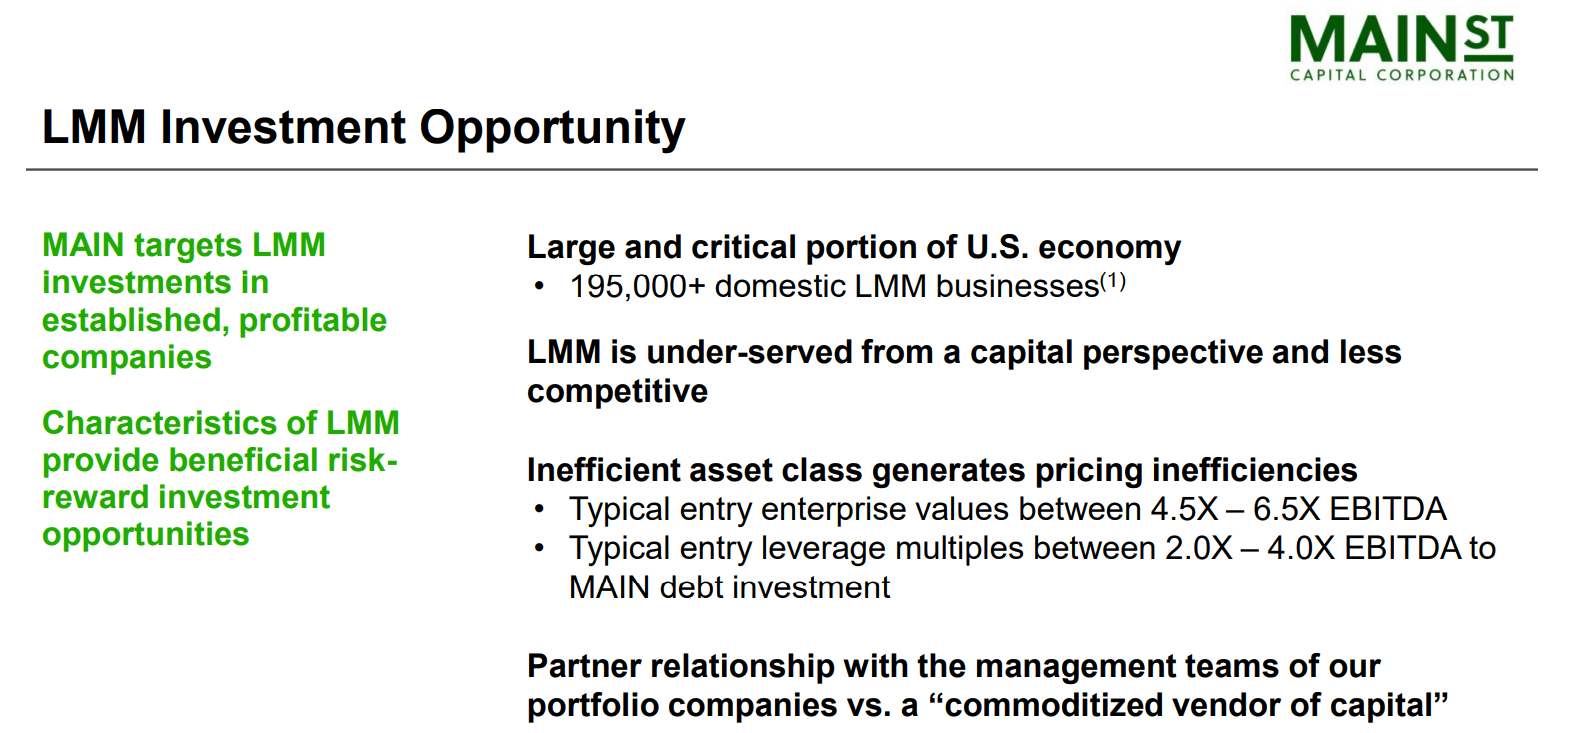
There are nearly 200,000 lower-middle-market or LMM companies in the US, and MAIN invests in debt and stock ownership in its customers, usually at valuations of just 5.5X cash flow.
- its average customer has a debt/EBITDA of 3.0X (investment grade if they could afford a credit rating)
- credit ratings can cost $500K per year…per agency
(Source: investor presentation)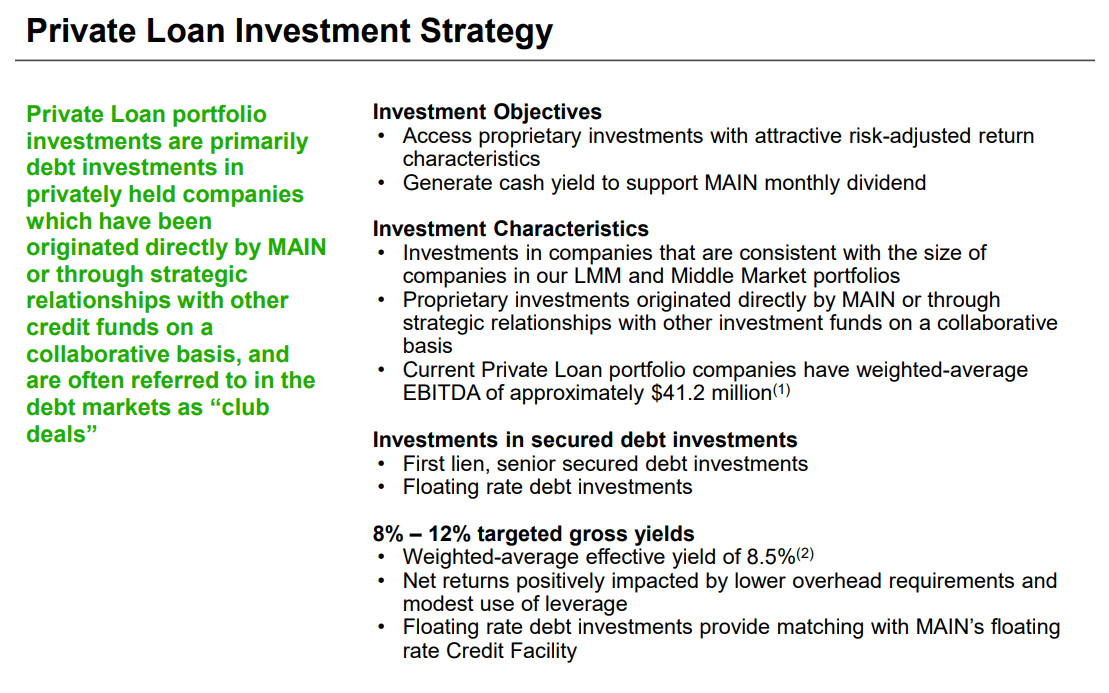
MAIN’s private loan portfolio averages an 8.5% yield and is a floating rate.
- it benefits from rising interest rates
Those loans are almost all senior first lien, the safest kind.
(Source: investor presentation)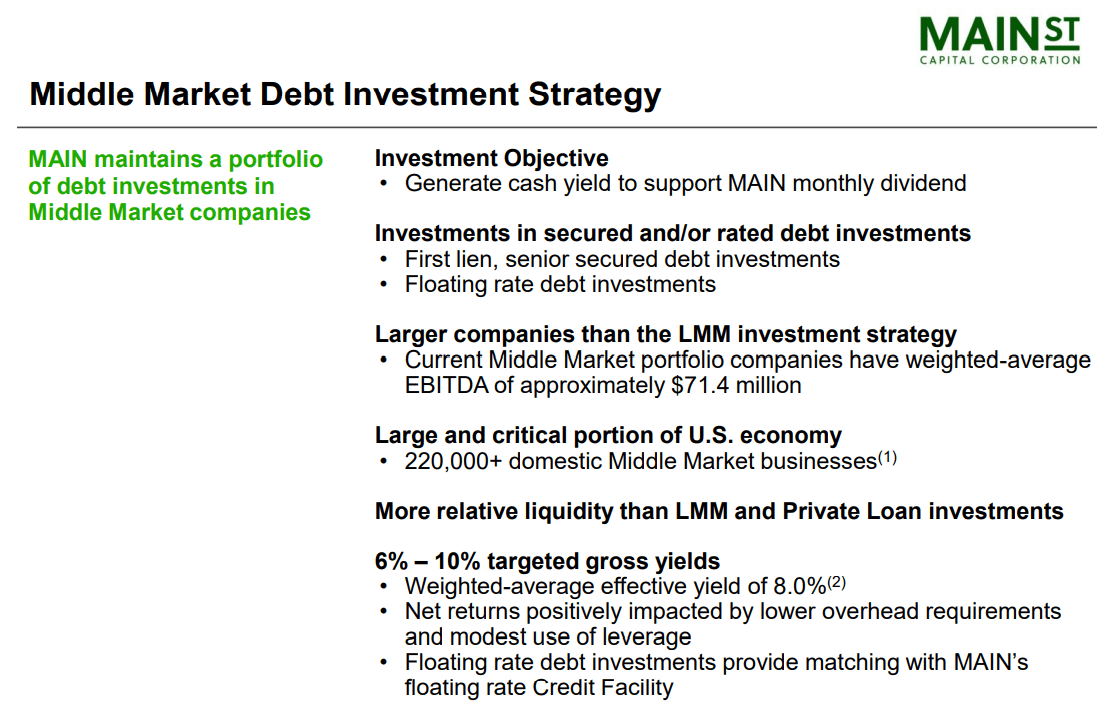
Its middle market loan portfolio serves another 220,000 potential clients, with 8% average yielding floating rate loans.
- also first lien, secured loans
(Source: investor presentation)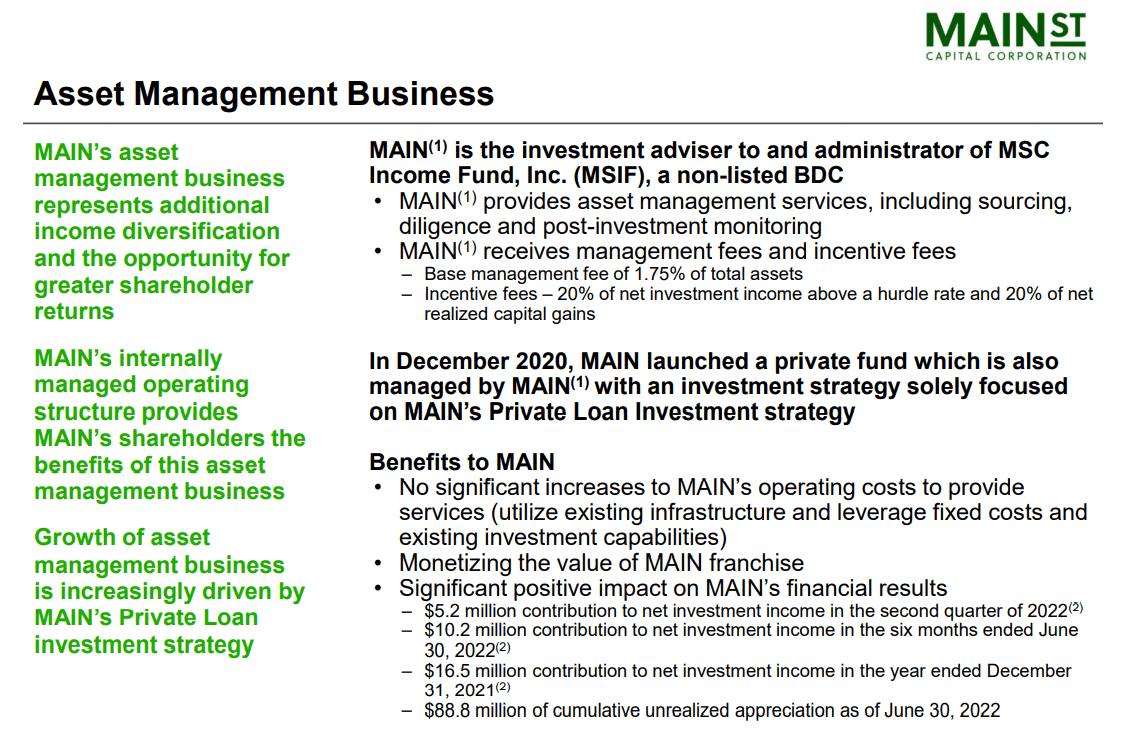
MAIN has an asset management business where it can charge 1.75% and 20% management and performance fees.
- other BDCs charge shareholders similar amounts for external management
- MAIN shareholders benefit from exceptional management and charge others hedge fund fees
(Source: investor presentation)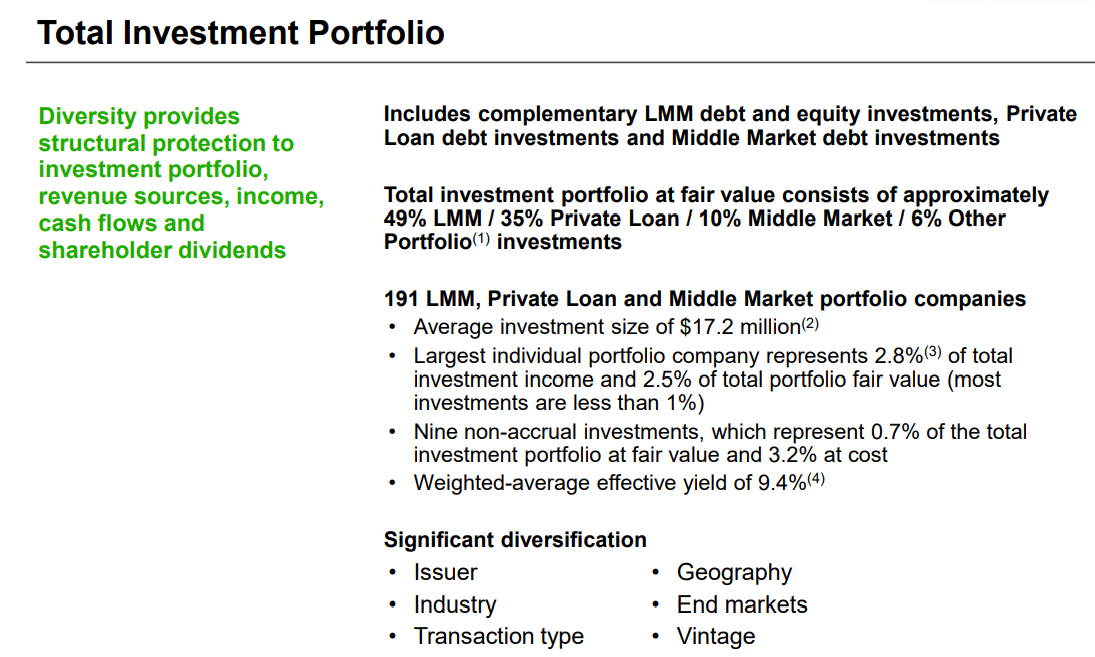
MAIN’s total portfolio consists of 191 loans averaging $17.2 million each, yielding 9.4%. The largest one is 2.8% of its portfolio, and most are under 1%.
Just nine loans, representing 0.7% of its portfolio, are not making payments.
(Source: investor presentation)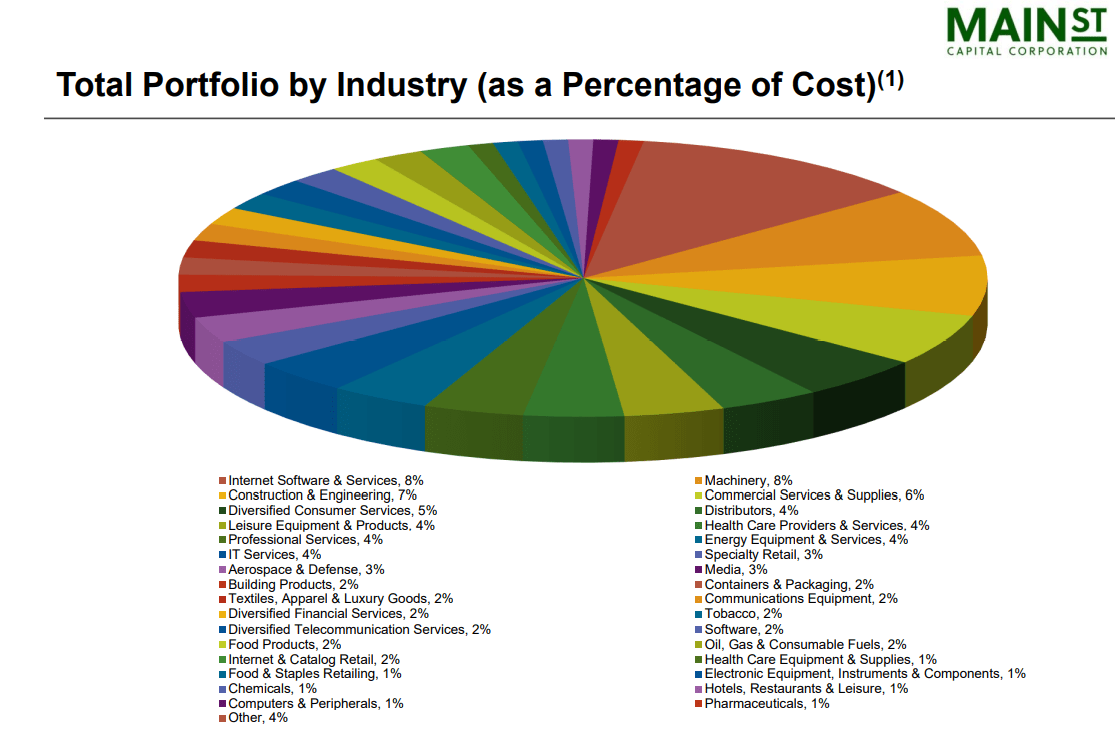
The portfolio is significantly diversified across 30 industries in all 11 sectors of the US economy.
(Source: investor presentation)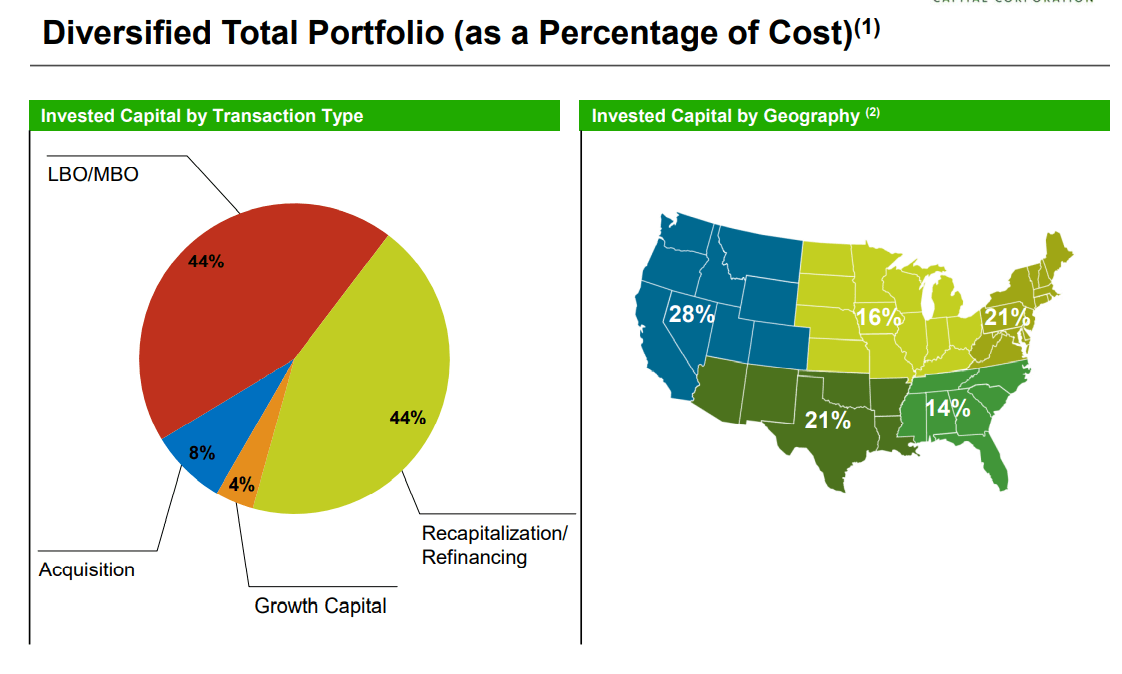
Its portfolio is highly diversified across geography.
(Source: investor presentation)
80% of MAIN’s financing costs are fixed, while 75% of its loans are floating rates.
MAIN Credit Ratings
| Rating Agency | Credit Rating | 30-Year Default/Bankruptcy Risk | Chance of Losing 100% Of Your Investment 1 In |
| S&P | BBB- Stable Outlook | 11% | 9.1 |
| Fitch | BBB- Stable Outlook | 11% | 9.1 |
| Consensus | BBB- Stable Outlook | 11.00% | 9.1 |
(Sources: S&P, Fitch)
Few BDCs have investment-grade credit ratings, and MAIN is one of them.
- profitability improves as rates rise
(Source: investor presentation)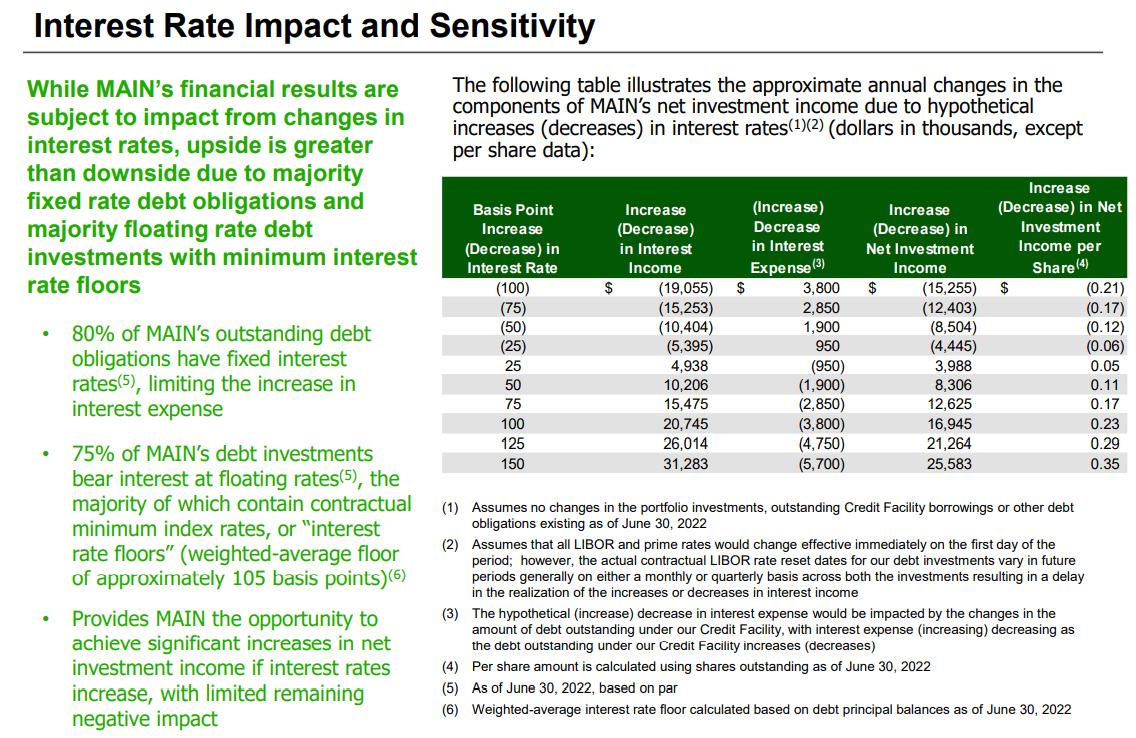
If the Fed hikes to 4.5% (its plan), then MAIN estimates its net investment income/share will rise by $0.35 (11%).
(Source: investor presentation)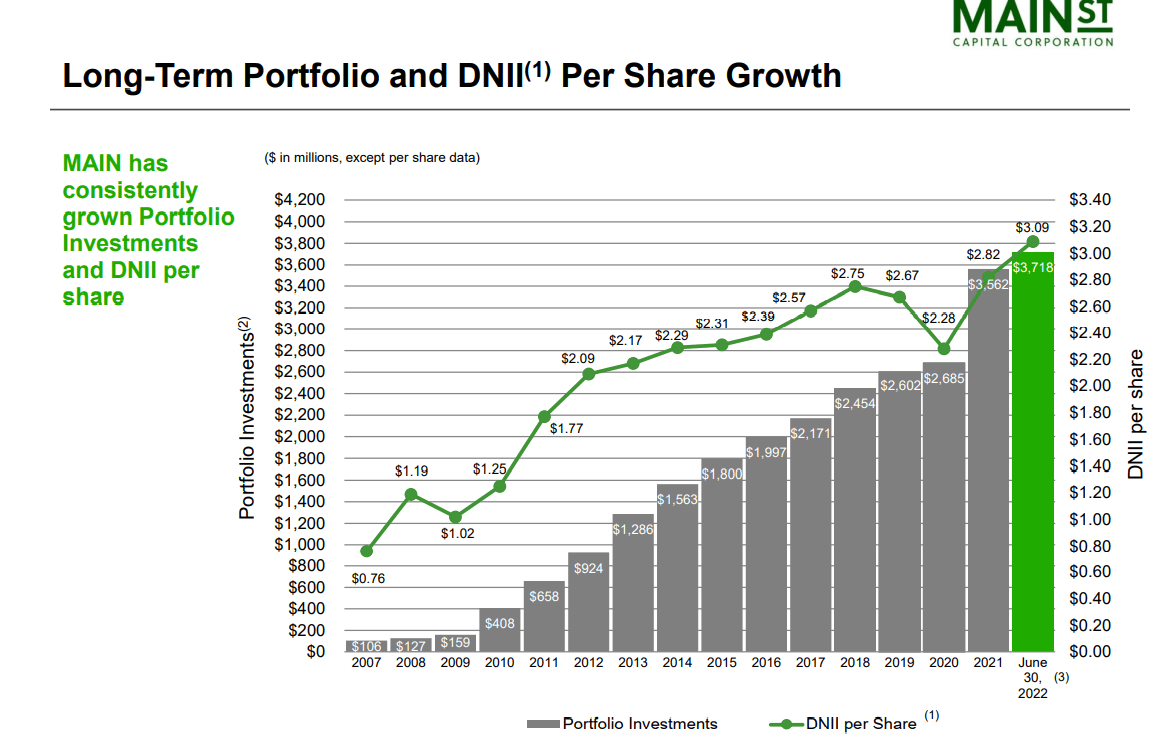
MAIN has been growing its business steadily since 2007, through two severe recessions.
- distributable net income/share growth of 9.8% CAGR
- industry-leading growth rate
What makes MAIN special?
(Source: investor presentation)
Unlike most BDCs, MAIN has never cut its dividend through two of the most severe recessions in US history.
- 11 consecutive years of dividend growth
- 14 consecutive years of paying dividends
- 4.5% CAGR dividend growth over 15 years
(Source: investor presentation)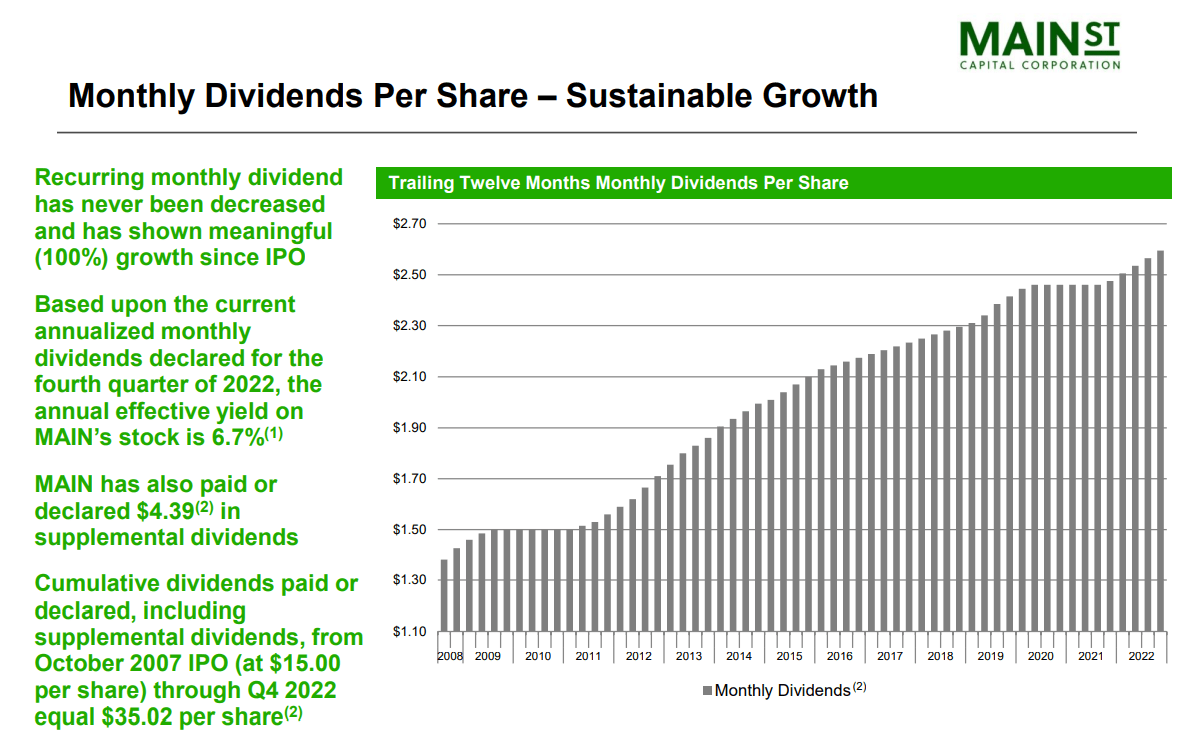
And unlike most BDCs which struggle to grow book value/share (due to conflicts of interest with external management), MAIN has increased its book value by 5% annually for the last 15 years.
(Source: investor presentation)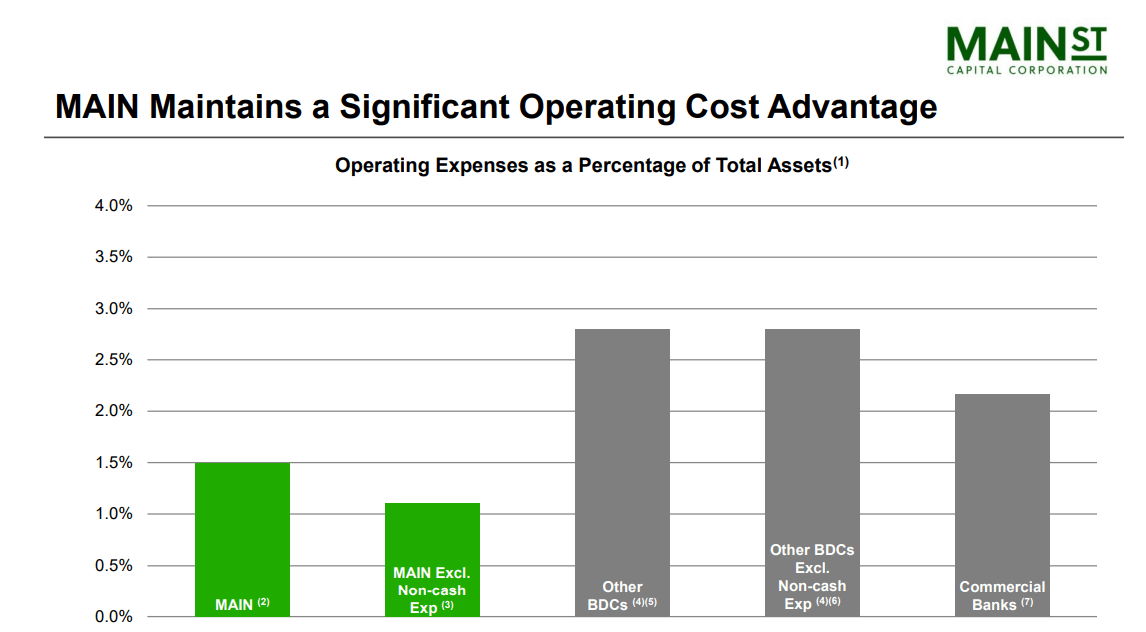
It costs MAIN 1.5% of annual assets to run the business, about half of the cost of externally managed BDCs (internal management is more efficient), and less than most commercial banks.
(Source: investor presentation)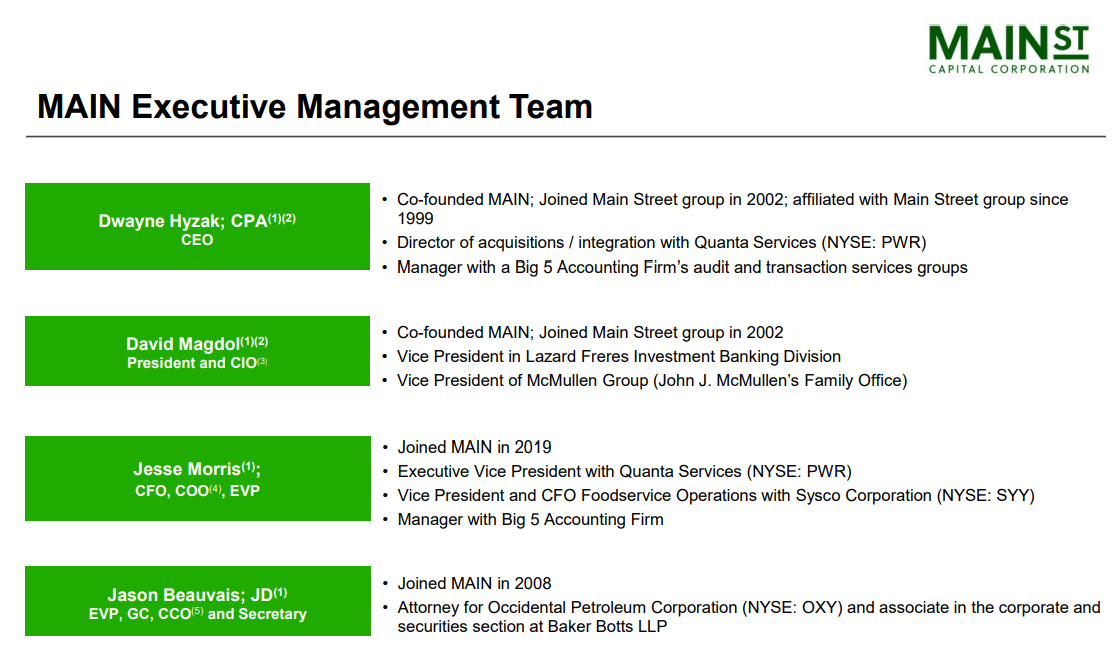
The CEO and Chief Investment Officer are the company’s co-founders, and its general counsel (chief lawyer) has been with them since the Great Recession.
(Source: investor presentation)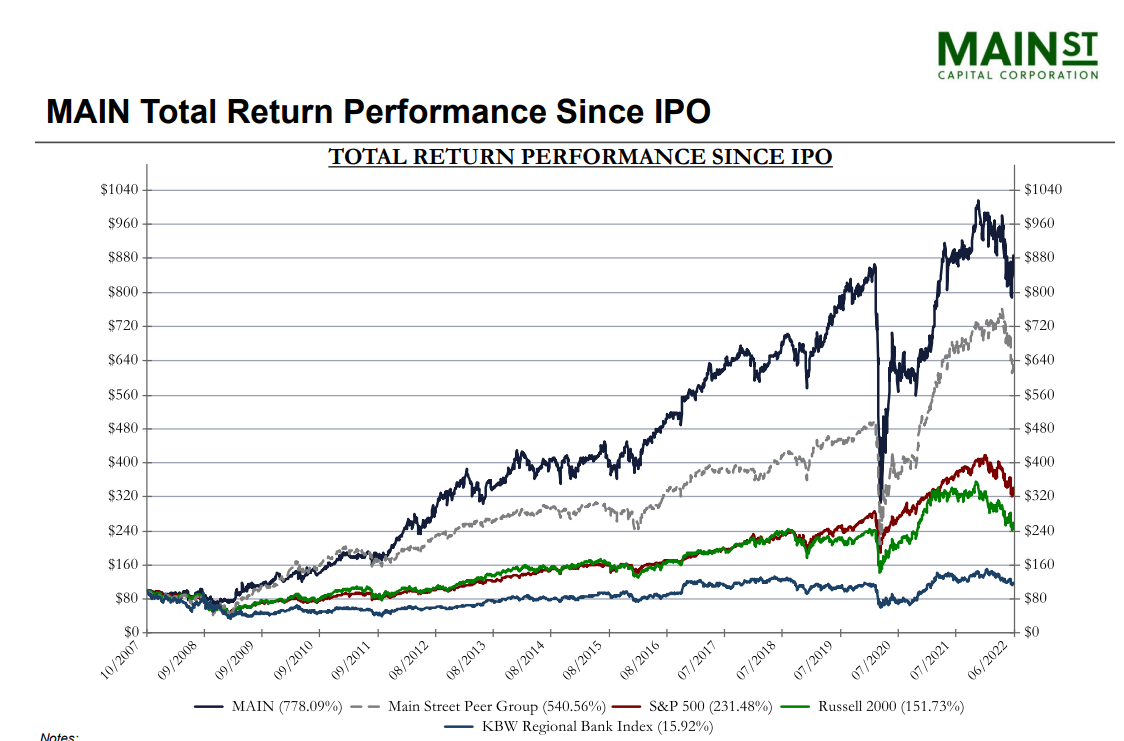
MAIN is like the BRK of BDCs, consistently delivering the best dividend safety, most consistent growth, and best NAV/share growth.
That’s why, since its IPO, it’s delivered almost 9X total returns.
- 44% more than its peers
- 3X more than the S&P
- 5X more than small caps
- 49X better than regional banks
Why I’m recommending MAIN Today
Ycharts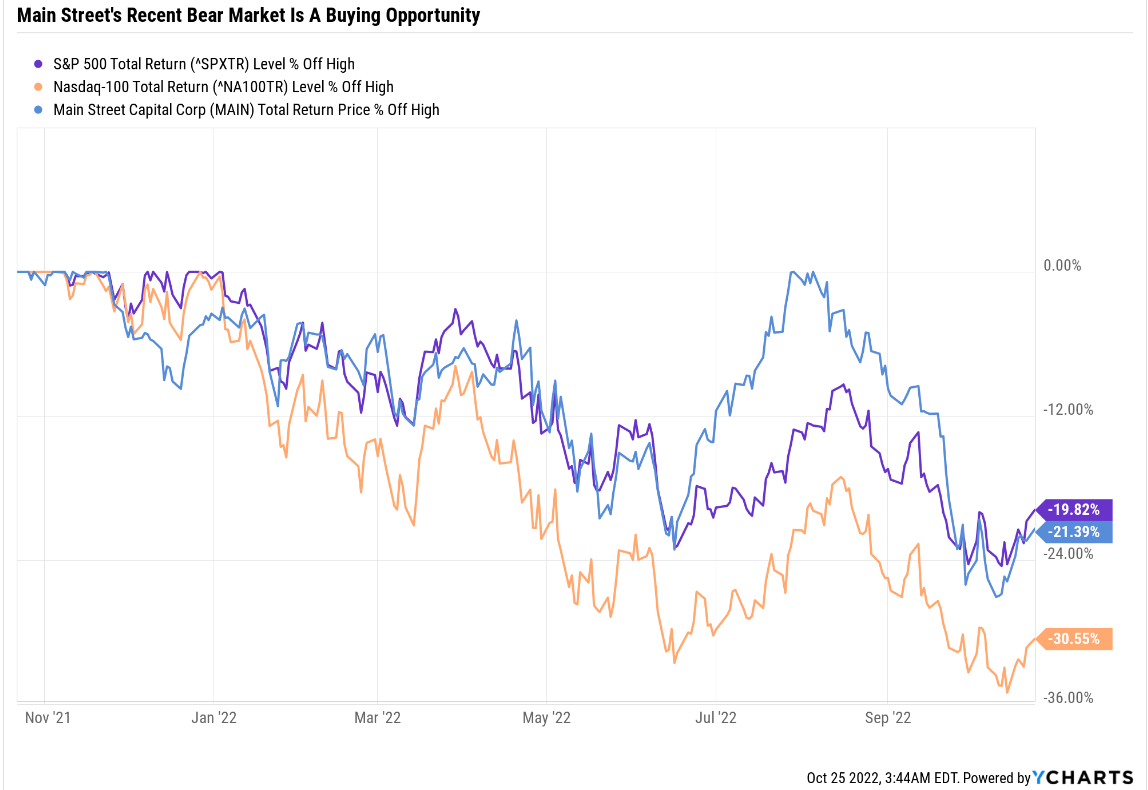
Main was actually up this year and recently plunged over 25%.
Why?
They recently did a secondary offering raising $48 million in growth capital (and diluting investors by 1.8%).
Raising money at record-high valuations is a prudent decision. Why did they raise the money in a bear market headed into recession?
Because business is thriving as private companies race to lock in financing before interest rates increase.
MAIN expects record Net Interest Income or NII/share, representing 13% YOY growth.
Fundamentals do not justify the recent 25% crash, and MAIN’s investment thesis remains intact.
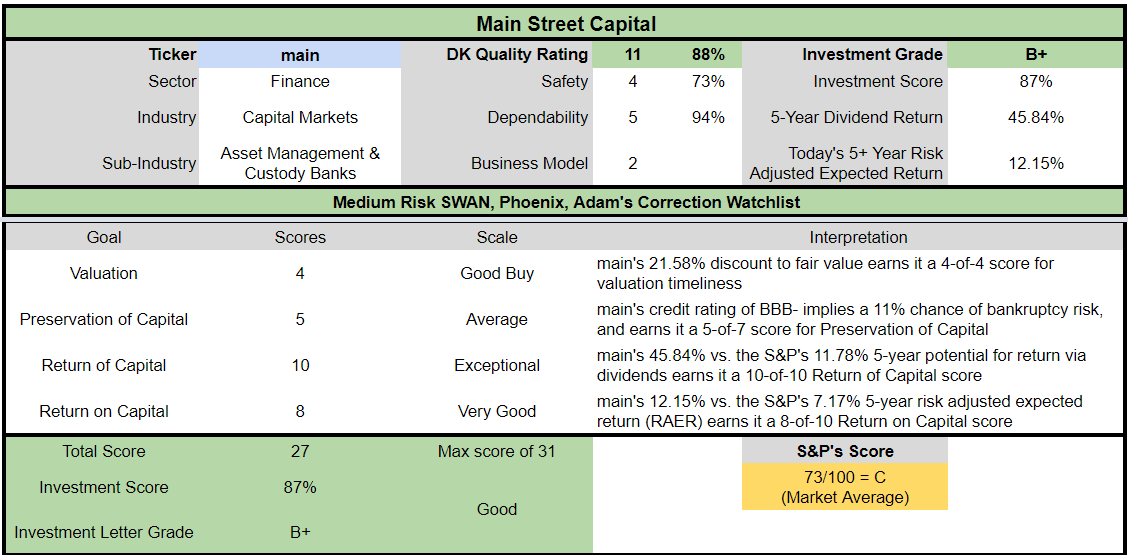
Reasons To Potentially Buy MAIN Today
| Metric | Main Street Capital |
| Quality | 88% 11/13 Quality SWAN (Sleep Well At Night) Monthly Dividend Stock |
| Risk Rating | Medium Risk |
| DK Master List Quality Ranking (Out Of 500 Companies) | 130 |
| Quality Percentile | 74% |
| Dividend Growth Streak (Years) | 11 |
| Dividend Yield | 7.5% (Paid monthly) |
| Dividend Safety Score | 73% |
| Average Recession Dividend Cut Risk | 1.0% |
| Severe Recession Dividend Cut Risk | 2.70% |
| S&P Credit Rating | BBB- Stable |
| 30-Year Bankruptcy Risk | 11.00% |
| LT S&P Risk-Management Global Percentile |
38% Below-Average |
| Fair Value | $44.76 |
| Current Price | $35.10 |
| Discount To Fair Value | 22% |
| DK Rating |
Potentially Good Buy |
| PE | 11.0 |
| Growth Priced In | 1.3% |
| Historical PE | 15 to 15.5 |
| LT Growth Consensus/Management Guidance | 8.0% |
| 5-year consensus total return potential |
13% to 20% CAGR |
| Base Case 5-year consensus return potential |
18% CAGR (2.5X the S&P 500) |
| Consensus 12-month total return forecast | 27% |
| Fundamentally Justified 12-Month Return Potential | 35% |
| LT Consensus Total Return Potential | 15.5% |
| Inflation-Adjusted Consensus LT Return Potential | 13.2% |
| Consensus 10-Year Inflation-Adjusted Total Return Potential (Ignoring Valuation) | 3.46 |
| LT Risk-Adjusted Expected Return | 9.66% |
| LT Risk-And Inflation-Adjusted Return Potential | 7.37% |
| Conservative Years To Double | 9.77 |
(Source: Dividend Kings Zen Research Terminal)
MAIN is trading at just 11X earnings, a 22% historical discount, creating a safe 7.5% yield (paid monthly) and attractive short and medium-term return potential.
MAIN 2023 Consensus Total Return Potential
(Source: FAST Graphs, FactSet)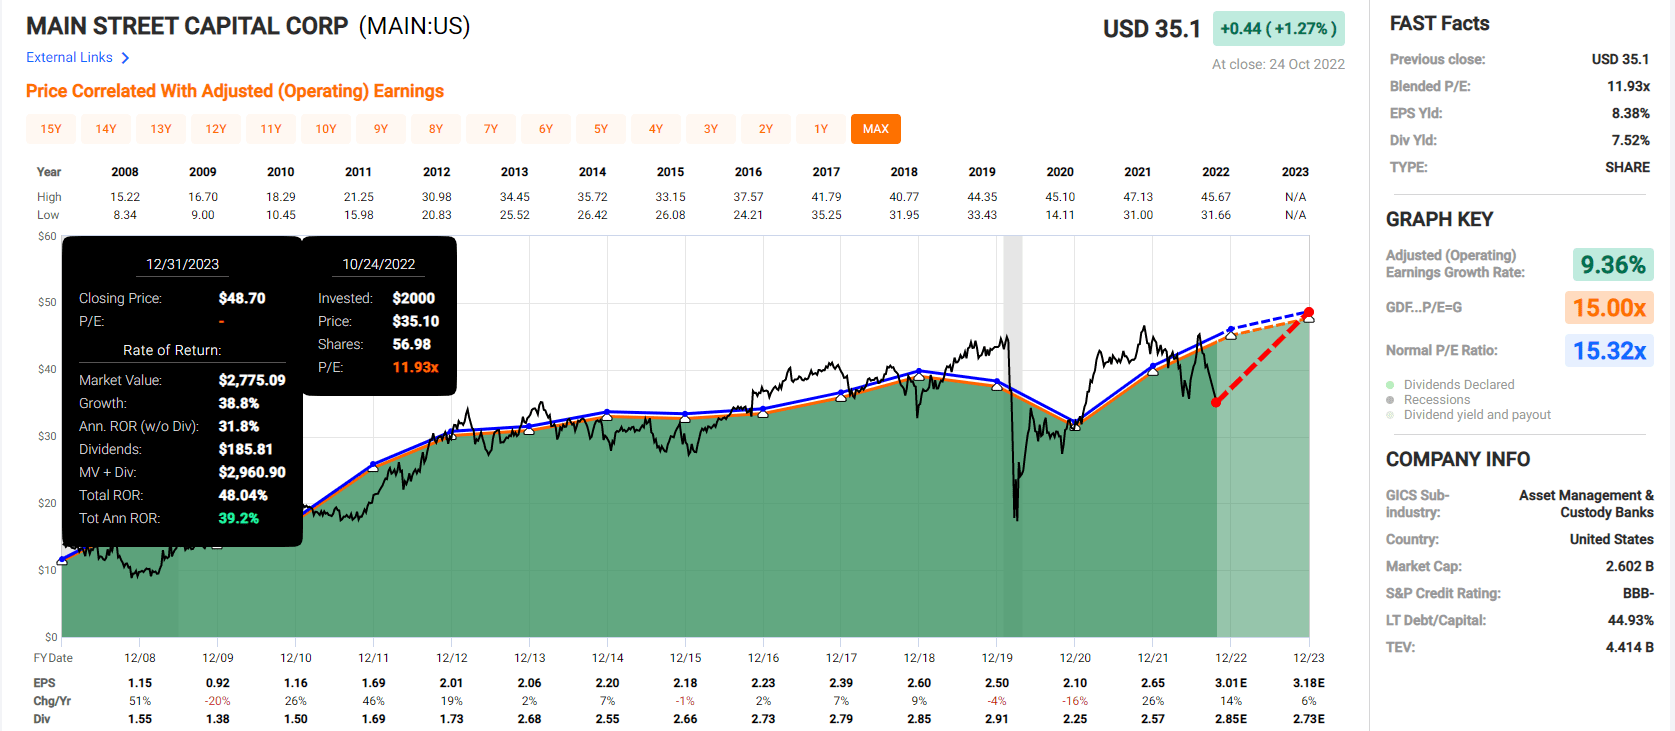
MAIN offers the potential for 39% annual returns through the end of next year if it grows as expected and returns to historical fair value.
- about 2X more than the S&P 500
MAIN 2025 Consensus Total Return Potential
(Source: FAST Graphs, FactSet)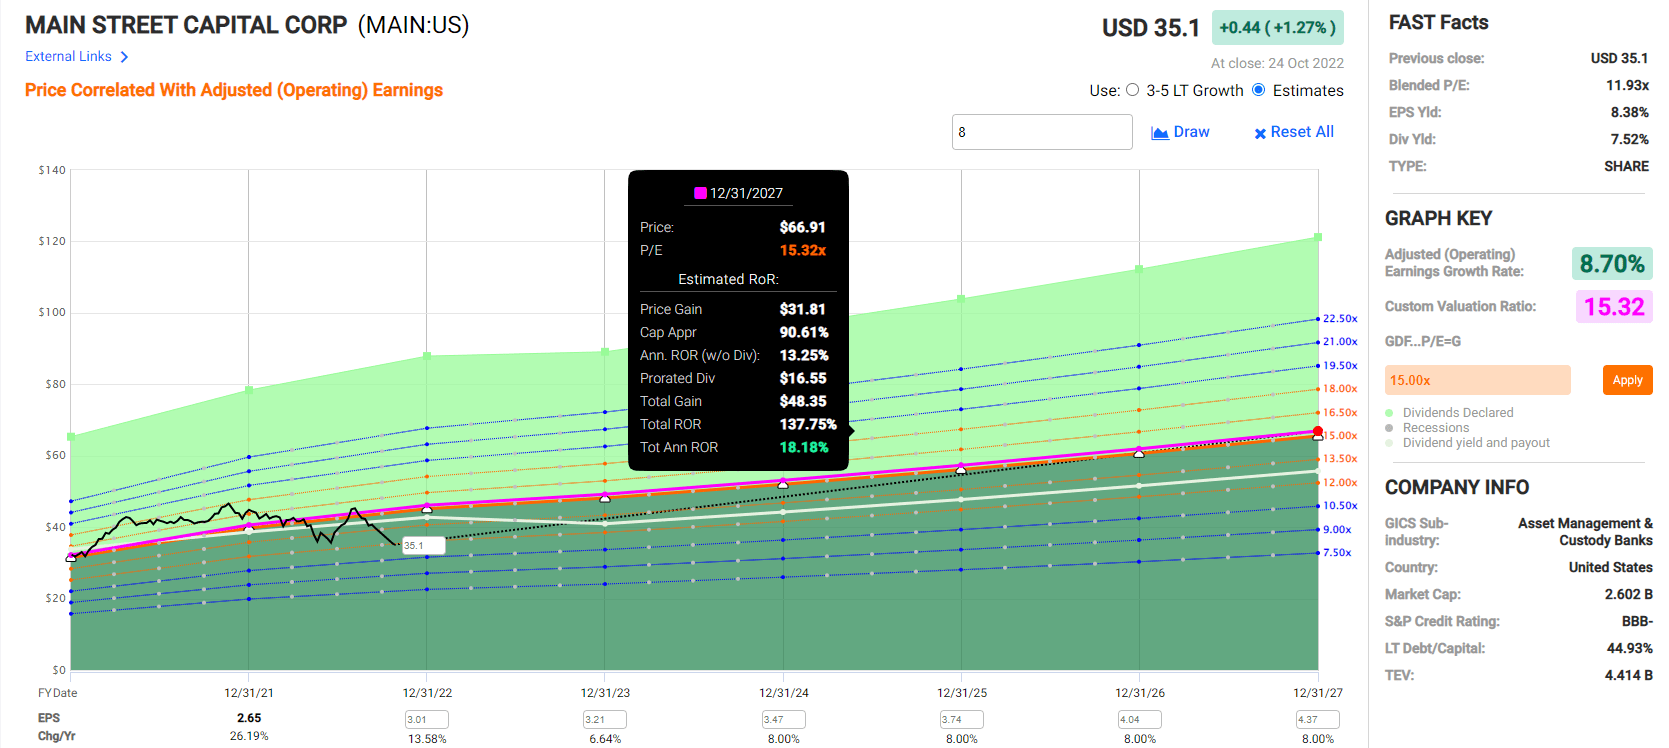
If MAIN grows as expected and returns to fair value by 2025, it could more than double with 18% annual returns.
- about 2.5X the total return potential of the S&P 500
MAIN Corp Investment Decision Tool
DK (Source: Dividend Kings Automated Investment Decision Tool)
MAIN is a potentially good high-yield monthly dividend opportunity for anyone comfortable with its risk profile. Look at how it compares to the S&P 500.
- 22% discount to fair value vs. 4% S&P = 18% better valuation
- 7.5% safe yield vs. 1.8% S&P (almost 4X higher)
- 50% higher annual long-term return potential
- about 2X higher risk-adjusted expected returns
- 4X the consensus 5-year income
Reason Two: Industry-Leading Growth Prospects
MAIN is trading at 11X earnings, priced for 1.3% CAGR long-term growth. Here’s what analysts actually expect.
| Metric | 2021 Growth | 2022 Growth Consensus |
2023 Growth Consensus (recession year) |
| Sales | 188% | -9% | 10% |
| Dividend | 4% | 9% | 1% |
| Earnings | 26% | 14% | 6% |
| EBITDA | 510% | NA | NA |
| EBIT (operating income) | 510% | NA | NA |
| Book Value | 13% | 2% | 3% |
(Source: FAST Graphs, FactSet)
After falling 20% in the Pandemic, MAIN’s earnings recovered fully in 2021 and are now at record levels. Analysts expect another record year next year, even with a mild recession.
MAIN Long-Term Growth Outlook
(Source: Reuters)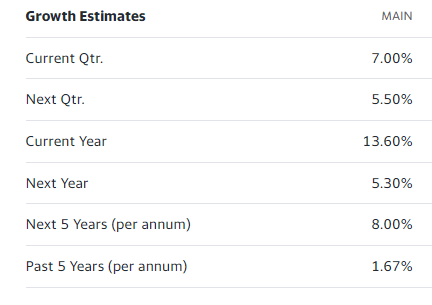
- 8% CAGR growth consensus range (from three sources)
- 4 out of five analysts covering MAIN expect 8% growth over the long-term
(Source: FAST Graphs, FactSet)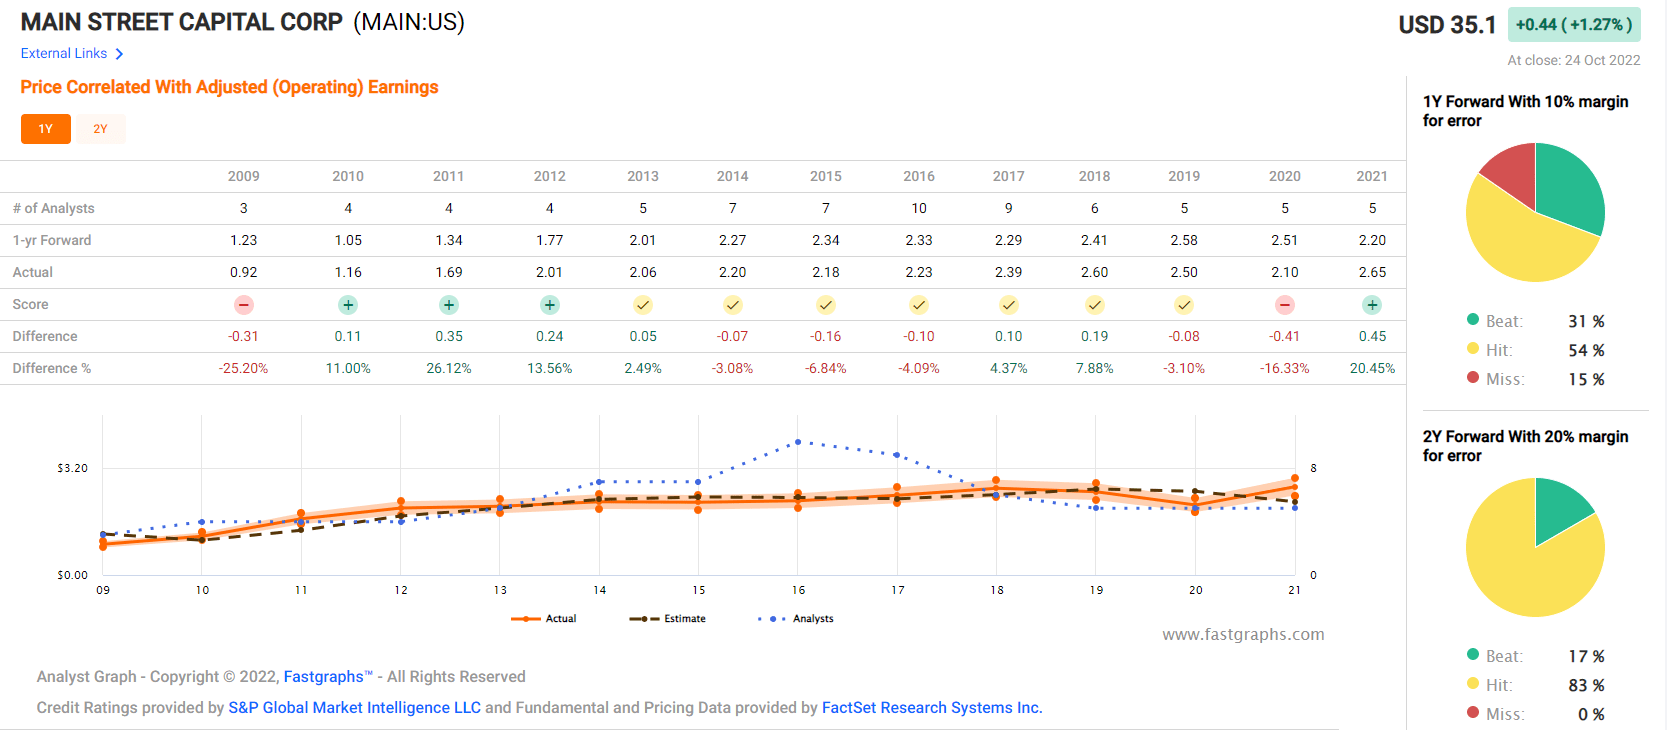
Smoothing for outliers analyst historical margins of error are 5% to the downside and 10% to the upside.
- 2% to 9% CAGR margin-of-error and historical growth adjusted range
- vs. 1.3% growth priced in
(Source: FAST Graphs, FactSet) (Source: FAST Graphs, FactSet)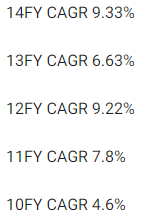
MAIN’s long-term growth rates range from 2% to 9%, just as analysts expect in the future.
| Investment Strategy | Yield | LT Consensus Growth | LT Consensus Total Return Potential | Long-Term Risk-Adjusted Expected Return | Long-Term Inflation And Risk-Adjusted Expected Returns | Years To Double Your Inflation & Risk-Adjusted Wealth |
10-Year Inflation And Risk-Adjusted Expected Return |
| Main Street Capital | 7.50% | 8.0% | 15.5% | 10.9% | 8.6% | 8.4 | 2.28 |
| Safe Midstream | 6.1% | 6.4% | 12.5% | 8.8% | 6.5% | 11.1 | 1.87 |
| 10-Year US Treasury | 4.2% | 0.0% | 4.2% | 2.9% | 0.7% | 107.5 | 1.07 |
| REITs | 3.9% | 6.1% | 10.0% | 7.0% | 4.7% | 15.2 | 1.59 |
| Schwab US Dividend Equity ETF | 3.8% | 8.5% | 12.3% | 8.6% | 6.3% | 11.4 | 1.84 |
| Dividend Aristocrats | 2.8% | 8.7% | 11.5% | 8.1% | 5.8% | 12.5 | 1.75 |
| S&P 500 | 1.8% | 8.5% | 10.3% | 7.2% | 4.9% | 14.6 | 1.62 |
| Nasdaq | 0.8% | 11.5% | 12.3% | 8.6% | 6.3% | 11.4 | 1.85 |
(Source: DK Research Terminal, FactSet, Morningstar, Ycharts)
MAIN has the potential to outperform the most popular investing strategies. Not just the high-yield, the S&P, aristocrats, and even the Nasdaq.
MAIN Historical Returns Since 2007
(Source: Portfolio Visualizer Premium) (Source: Portfolio Visualizer Premium) (Source: Portfolio Visualizer Premium)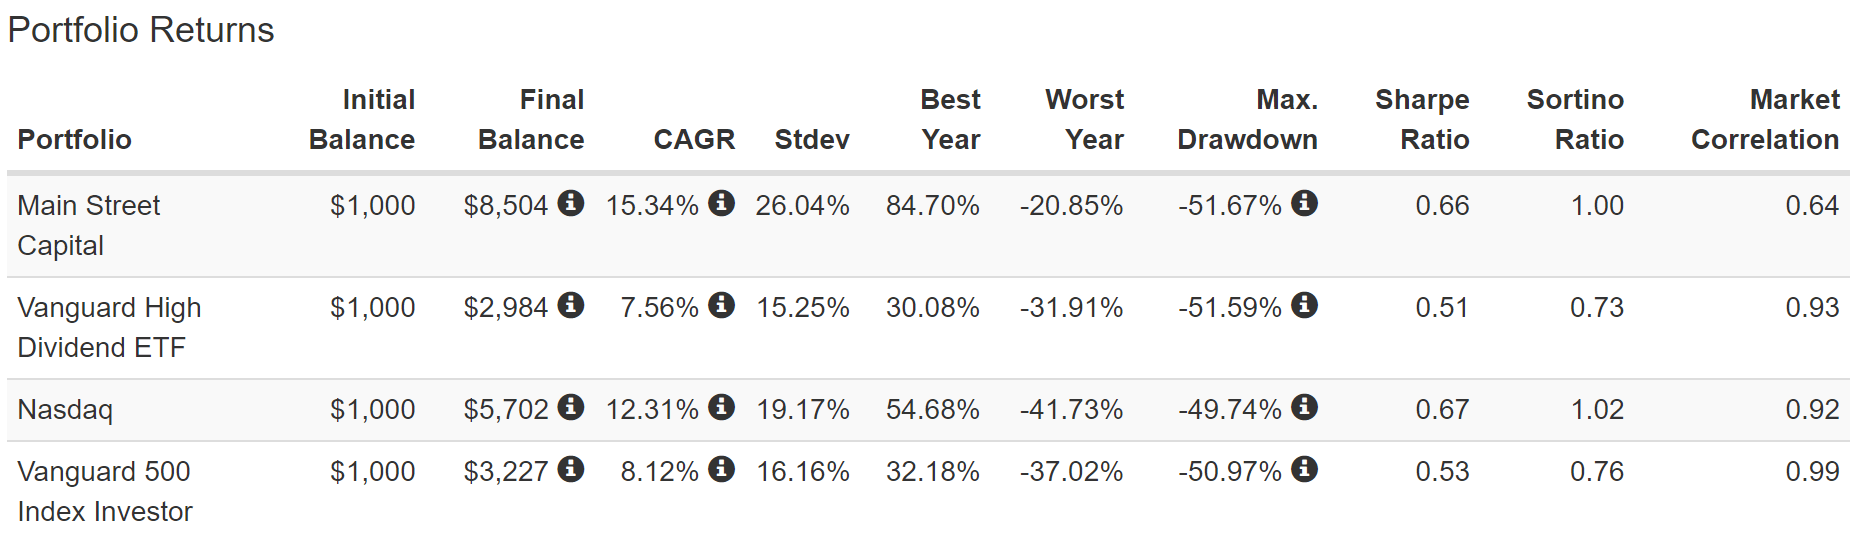
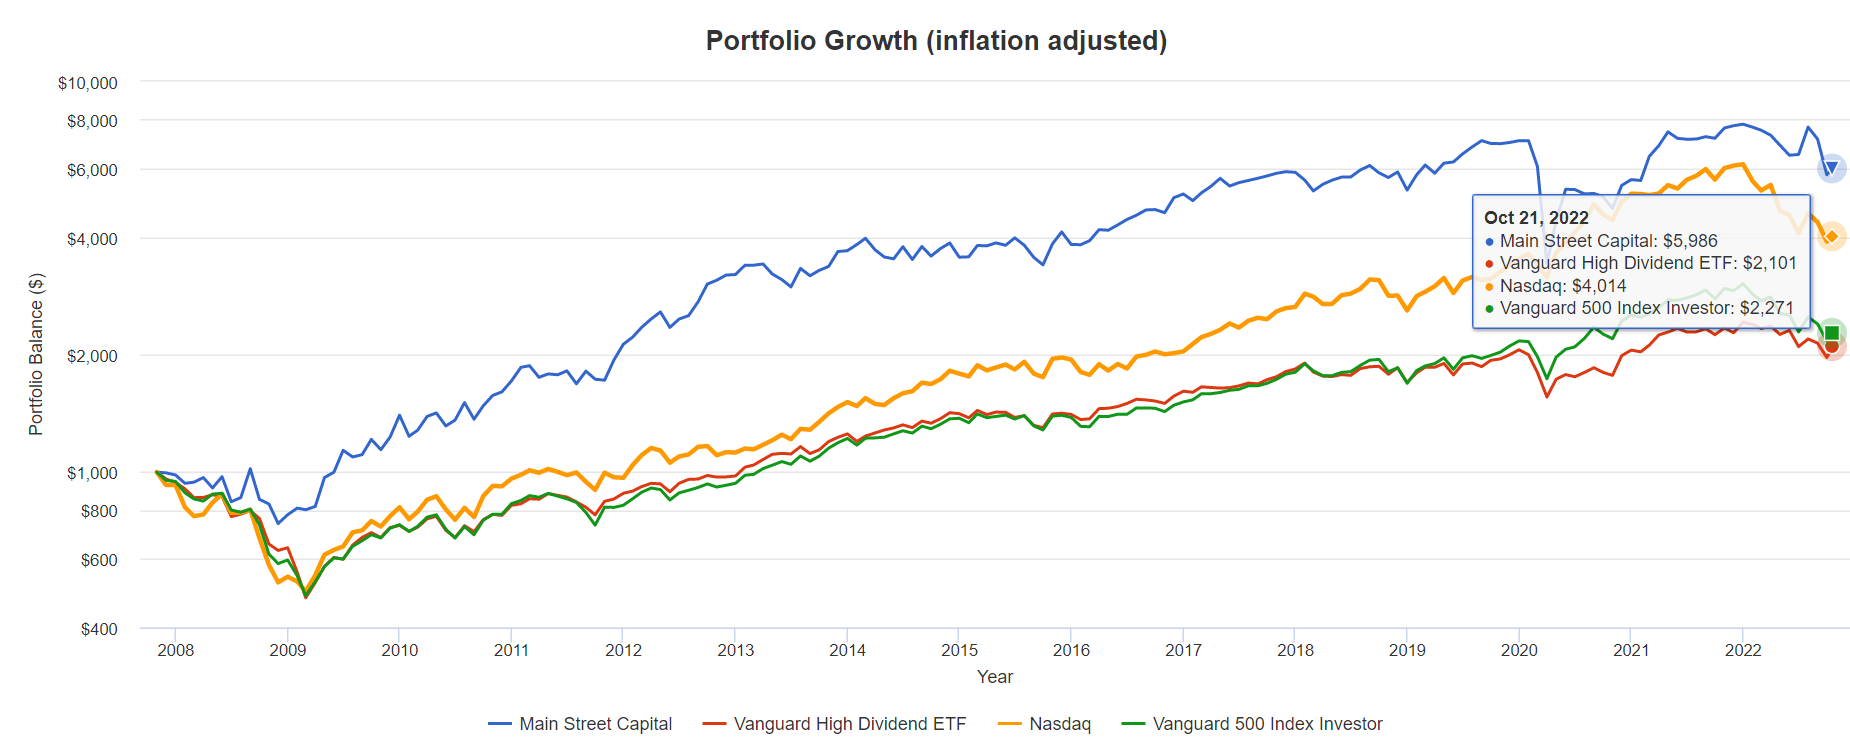
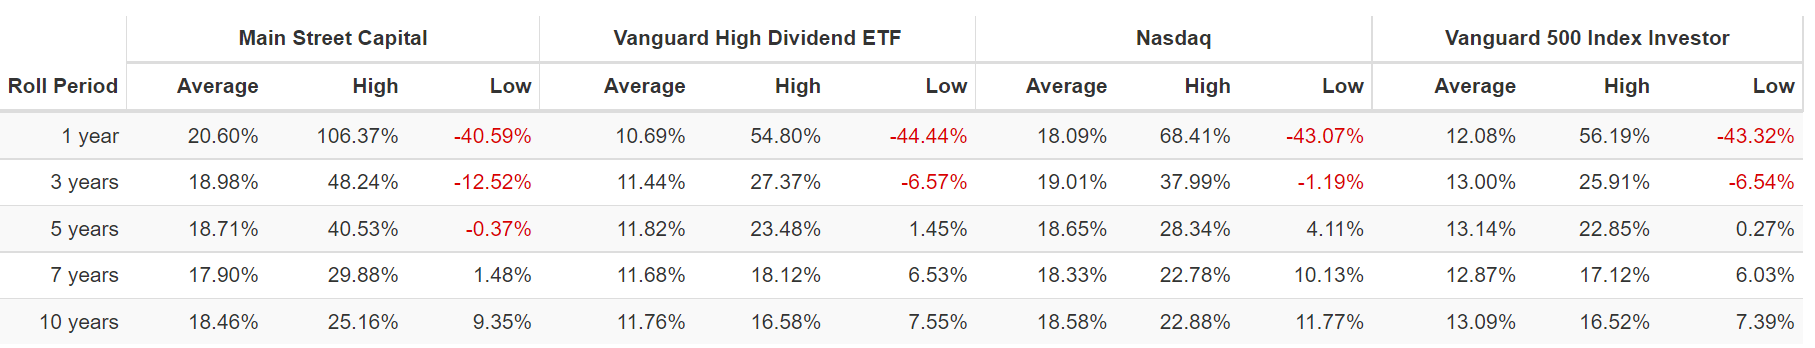
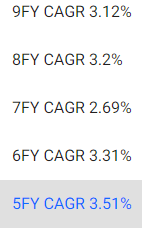
MAIN’s historical rolling returns are 15% annually over the last 15 years.
- 6X inflation-adjusted returns
- 3X more than the S&P and VYM
- 50% more than the Nasdaq
- 18.5% CAGR average rolling 10-year return
- from bear market lows 10 year returns as strong as 25% CAGR
- 9.5X return in 10 years from bear market lows
Inflation-Adjusted Consensus Total Return Potential: $1,000 Initial Investment
| Time Frame (Years) | 8.0% CAGR Inflation-Adjusted S&P 500 Consensus | 9.2% Inflation-Adjusted Aristocrat Consensus | 13.2% CAGR Inflation-Adjusted MAIN Consensus | Difference Between Inflation-Adjusted MAIN Consensus And S&P Consensus |
| 5 | $1,468.65 | $1,553.50 | $1,861.26 | $392.61 |
| 10 | $2,156.93 | $2,413.37 | $3,464.30 | $1,307.37 |
| 15 | $3,167.77 | $3,749.18 | $6,447.96 | $3,280.20 |
| 20 | $4,652.33 | $5,824.36 | $12,001.35 | $7,349.02 |
| 25 | $6,832.64 | $9,048.16 | $22,337.66 | $15,505.02 |
| 30 | $10,034.74 | $14,056.34 | $41,576.24 | $31,541.50 |
(Source: DK Research Terminal, FactSet)
Analysts think MAIN could potentially deliver 42X returns over the next 30 years. Even if it only grows as expected over the next 10 years, ignoring valuation entirely, that’s a potential 3.5X inflation-adjusted return.
| Time Frame (Years) | Ratio Inflation-Adjusted MAIN Consensus/Aristocrat Consensus | Ratio Inflation-Adjusted MAIN Consensus vs. S&P consensus |
| 5 | 1.20 | 1.27 |
| 10 | 1.44 | 1.61 |
| 15 | 1.72 | 2.04 |
| 20 | 2.06 | 2.58 |
| 25 | 2.47 | 3.27 |
| 30 | 2.96 | 4.14 |
(Source: DK Research Terminal, FactSet)
Which is far more than the aristocrats or S&P 500.
Reason Three: A Wonderful Company At A Wonderful Price
(Source: FAST Graphs, FactSet) (Source: FAST Graphs, FactSet)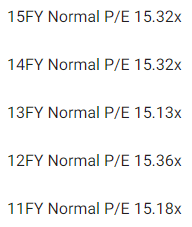
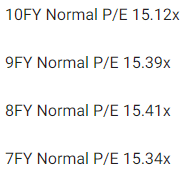
For 15 years, millions of income investors, outside of bear markets and bubbles, have consistently paid 15 to 15.5X earnings for MAIN.
- 90% statistical probability MAIN is worth around 15.3X earnings
| Metric | Historical Fair Value Multiples (all-Years) | 2021 | 2022 | 2023 | 2024 |
12-Month Forward Fair Value |
| 5-Year Average Yield | 6.09% | $41.87 | $43.35 | $43.35 | NA | |
| 13-Year Median Yield | 6.19% | $41.20 | $42.65 | $42.65 | NA | |
| PE | 15.32 | $40.60 | $46.57 | $49.18 | NA | |
| Average | $41.22 | $44.13 | $44.88 | NA | $44.76 | |
| Current Price | $35.10 | |||||
|
Discount To Fair Value |
14.84% | 20.46% | 21.79% | NA | 21.58% | |
|
Upside To Fair Value |
17.42% | 25.72% | 27.85% | NA | 35.05% | |
| 2022 EPS | 2023 EPS | 2022 Weighted EPS | 2023 Weighted EPS | 12-Month Forward EPS | 12-Month Average Fair Value Forward PE |
Current Forward PE |
| $3.04 | $3.21 | $0.47 | $2.72 | $3.18 | 14.06 | 11.02 |
Including historical dividend yields, I conservatively estimate MAIN is historically worth 14X earnings, and today it trades at just 11X.
- 22% historically undervalued
- 35% fundamentally justified 12-month total return potential
- analysts expect a 27% return in the next 12 months
| Rating | Margin Of Safety For Medium Risk 11/13 SWAN Quality Companies | 2022 Fair Value Price | 2023 Fair Value Price |
12-Month Forward Fair Value |
| Potentially Reasonable Buy | 0% | $44.13 | $44.88 | $44.76 |
| Potentially Good Buy | 15% | $37.51 | $38.15 | $38.05 |
| Potentially Strong Buy | 25% | $33.09 | $33.66 | $33.57 |
| Potentially Very Strong Buy | 35% | $24.38 | $29.17 | $29.09 |
| Potentially Ultra-Value Buy | 45% | $24.27 | $24.68 | $24.62 |
| Currently | $35.10 | 20.46% | 21.79% | 21.58% |
| Upside To Fair Value (Including Dividends) | 33.24% | 35.38% | 35.05% |
MAIN is a potentially good buy for anyone comfortable with its risk profile.
Risk Profile: Why Main Street Capital Isn’t Right For Everyone
There are no risk-free companies, and no company is suitable for everyone. You have to be comfortable with the fundamental risk profile.
- MAIN’s risk section in its Annual report runs 27 pages
- not unusual for financial companies
MAIN’s Risk Profile Includes
- economic cyclicality risk: in the Pandemic and Great Recession earnings fell 20%
- liquidity risk: if credit markets seize up it might not be able to access capital markets and keep growing
- loan pre-payment risk (mostly in strong economies with high interest rates)
- interest rate sensitivity: approximately 2% per 25 basis point change in the Fed Funds rate
- talent retention risk in the tightest job market in 50 years
- disruption risk: minimal, though theoretically big banks could reenter the industry
(Source: Dividend Kings S&P 500 Valuation Tool)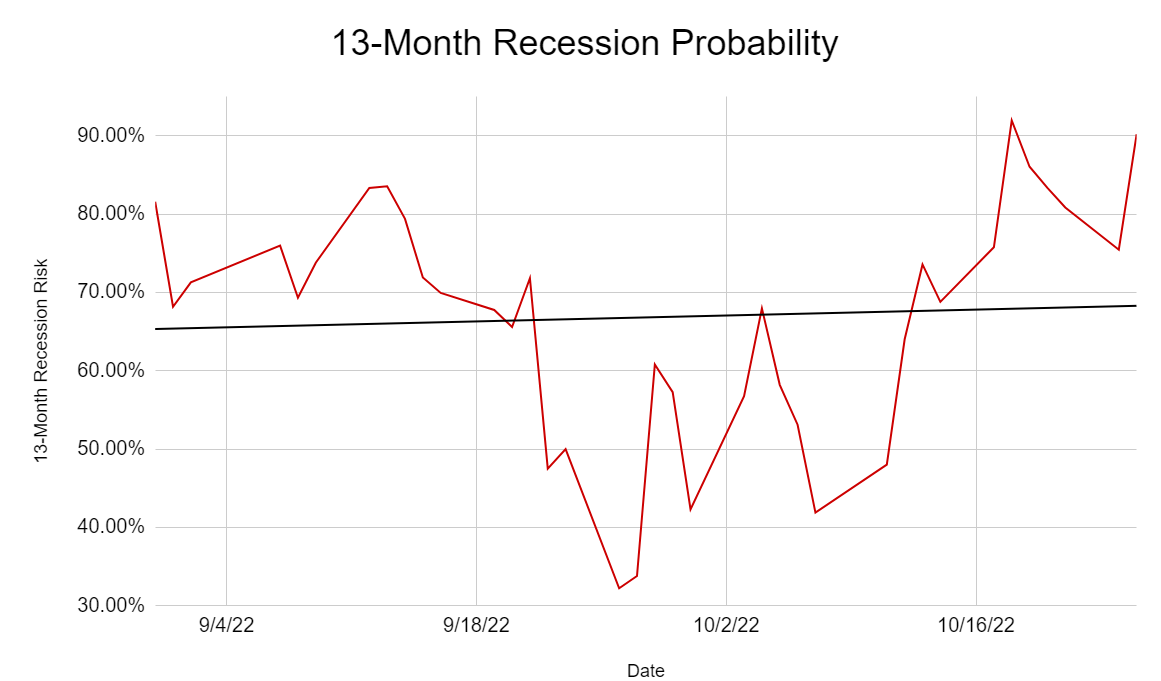
The bond market now estimates a 90% probability of recession within 13 months.
- Bloomberg: 100%
- Ned Davis Research: 98%
- The Conference Board: 96%
- 80% of CEOs expect a recession in 2023
How do we quantify, monitor, and track such a complex risk profile? By doing what big institutions do.
Long-Term Risk Analysis: How Large Institutions Measure Total Risk
- see the risk section of this video to get an in-depth view (and link to two reports) of how DK and big institutions measure long-term risk management by companies
DK uses S&P Global’s global long-term risk-management ratings for our risk rating.
- S&P has spent over 20 years perfecting their risk model
- which is based on over 30 major risk categories, over 130 sub categories, and 1,000 individual metrics
- this risk rating has been included in every credit rating for decades
The DK risk rating is based on the global percentile of how a company’s risk management compares to 8,000 S&P-rated companies representing 90% of the world’s stock market cap.
MAIN Scores 38th Percentile On Global Long-Term Risk Management
S&P’s risk management scores factor in things like:
- supply chain management
- crisis management
- efficiency
- labor relations
- customer relationship management
- climate strategy adaptation
- loan underwriting
MAIN’s Long-Term Risk Management Is The 381st Best In The Master List (24 Percentile In The Master List)
| Classification | Average Consensus LT Risk-Management Industry Percentile |
Risk-Management Rating |
| British American Tobacco (BTI) #1 Risk Management In The Master List | 100 | Exceptional |
| S&P Global (SPGI) Tied for #1 | 100 | Exceptional |
| Foreign Dividend Stocks | 76 |
Good |
| Strong ESG Stocks | 73 |
Good |
| Ultra SWANs | 70 | Good |
| Low Volatility Stocks | 68 | Above-Average |
| Dividend Aristocrats | 67 | Above-Average |
| Dividend Kings | 63 | Above-Average |
| Master List average | 62 | Above-Average |
| Hyper-Growth stocks | 61 | Above-Average |
| Monthly Dividend Stocks | 60 | Above-Average |
| Dividend Champions | 57 | Average bordering on above-average main |
| Main Street Capital | 38 | Below-Average, Bordering On Average |
(Source: DK Research Terminal)
MAIN’s risk-management consensus is in the bottom 24% of the world’s highest quality companies and similar to that of such other blue-chips as
- Church & Dwight (CHD): Ultra SWAN dividend aristocrat
- Sherwin-Williams (SHW): Super SWAN dividend king
- Chubb Limited (CB): Super SWAN dividend aristocrat
- Kimberly-Clark (KMB): Ultra SWAN dividend king
- Carlisle Companies (CSL): Ultra SWAN dividend champion
The bottom line is that all companies have risks, and MAIN is below-average, at managing theirs according to S&P.
How We Monitor MAIN’s Risk Profile
- 5 analysts
- two credit rating agencies
- 7 experts who collectively know this business better than anyone other than management
When the facts change, I change my mind. What do you do, sir?” – John Maynard Keynes
There are no sacred cows at iREIT or Dividend Kings. Wherever the fundamentals lead, we always follow. That’s the essence of disciplined financial science, the math behind retiring rich and staying rich in retirement.
Bottom Line: Main Street Capital Is A 7.5% Monthly Yield Retirement Dream Blue-Chip
Let me be clear: I’m NOT calling the bottom in MAIN (I’m not a market-timer).
Sleep Well At Night doesn’t mean “can’t fall hard in a bear market.”
Fundamentals are all that determine safety and quality, and my recommendations.
- over 30+ years, 97% of stock returns are a function of pure fundamentals, not luck
- in the short term; luck is 25X as powerful as fundamentals
- in the long term, fundamentals are 33X as powerful as luck
While I can’t predict the market in the short term, here’s what I can tell you about MAIN.
- One of the highest quality, safest, and most dependable monthly paying dividend blue-chips on earth.
- 7.5% safe yield, paid monthly, growing at 5% over time
- 15.5% CAGR long-term total return consensus, better than the Nasdaq, aristocrats, S&P 500, and SCHD.
- 22% historically undervalued, a potentially good buy
- 11.0X PE
- 134% consensus return potential over the next five years, 18% CAGR, about 2.5X more than the S&P 500
- 2X the risk-adjusted expected returns of the S&P 500 over the next five years
- about 4X better income potential over the next five years
If you want to take advantage of this bear market, MAIN is a potentially great way to do just that.
If you want to buy one of the best monthly dividend stocks at a bargain-basement price, now is your chance.
If you want to potentially earn Buffett-like returns, while getting paid a safe 7.5% yield, monthly, MAIN is an ideal choice.
If you’re goal is to retire in safety and splendor, harnessing the world’s best blue-chips, there are few better options than Main Street Capital right now.
Be the first to comment