

Baris-Ozer
Written by Nick Ackerman. This article was originally published to members of Cash Builder Opportunities on July 10th, 2022.
Two names that are almost synonymous with income investing are the dynamic duo Main Street Capital (NYSE:MAIN) and Realty Income (NYSE:O). Both of these names have provided income investors with steady returns through their monthly dividends. Not only have they been paying regular dividends without missing a beat, but they’ve also been growing these dividends.
Growing dividends and income are an important part of investing to help maintain an investor’s purchasing power. While inflation has been almost nonexistent for most of the last decade, we are really starting to see the negative impacts that higher inflation is causing now.
If you are already using this income for your retirement expenses, this does the growth in the background. If you are still in the accumulation phase of your life, reinvesting and growing dividends only compounds this growth further.
With all that being said, it led me to start questioning how a portfolio of just MAIN and O would have performed and how such a portfolio might perform going forward. Investing in just two positions probably isn’t recommended, as you would get significant individual stock risk. On the other hand, they are almost diversified holdings within themselves in a way. Since MAIN is investing in many different portfolio positions and O is leasing their properties to many different tenants.
Main Street And Realty Income: Historical Performance
Looking over the last decade, we can see how the price of these names compared to the S&P 500 Index. Of course, this isn’t a great benchmark but can provide some context on how they’ve performed.
Price Return (Seeking Alpha)
What we see above is a price return comparison only. That means we aren’t factoring in the dividends over the last decade. When we take a look at the total return, which would reflect this, we see a much different picture.
Total Return (Seeking Alpha)
When we do that, we can see that MAIN has actually put up similar results – slightly better, in fact. O has been the laggard here. If you are looking for steady monthly dividends, then the performance might not be too much of a concern.
The last time I paid my electric and gas bill was with cash (okay, it was online with a debit card, but you know what I mean.) I haven’t tried to offer them a share of stock before, but I’d hazard a guess they’d laugh at me. Basically, for income investors, having the cash come in is much better than potential growth.
For the next chart, I wanted to provide a comparison that was more appropriate to MAIN and O. That would be comparing the total return performance of VanEck BDC Income ETF (BIZD) and Vanguard Real Estate Index Fund ETF (VNQ). These would be more appropriate comparisons because BIZD is a basket of BDCs, and VNQ is a basket of REITs.
Total Returns (Seeking Alpha)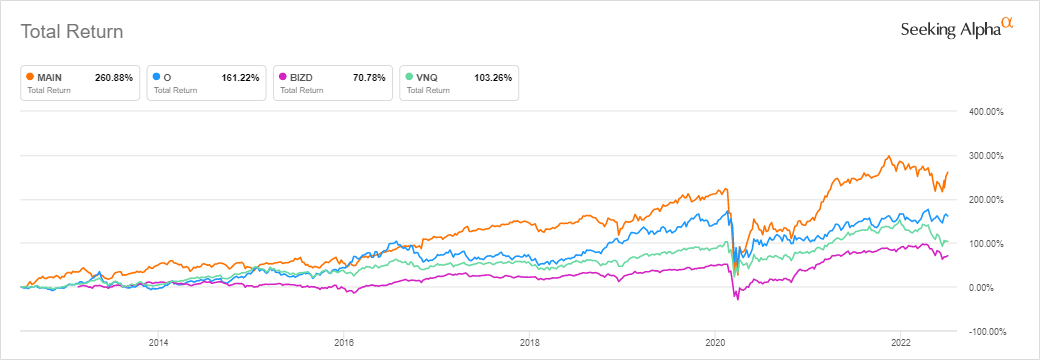
What we see here is that both of them have stomped these ETFs. That suggests that these names far outperformed most of their peers during the last decade.
The returns would have been quite appealing historically. To take a look at what the drawdowns would have been over this time, we can see that the worst period would have been during COVID. The maximum drawdown in that time was 43.55%.
Drawdowns (Portfolio Visualizer)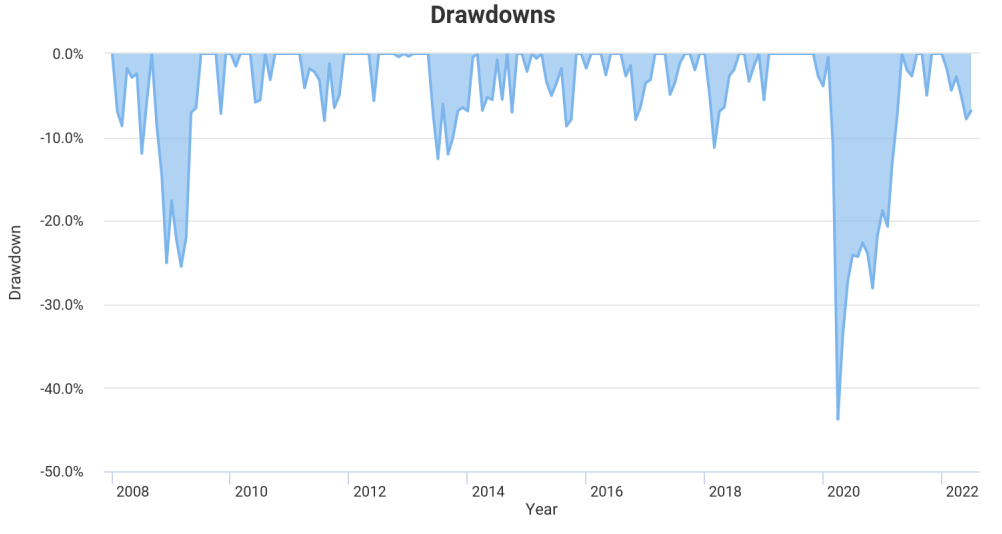
For context, the S&P 500 saw a maximum drawdown of 33.72% in that period. That suggests that a MAIN and O portfolio would be more volatile. That’s about what we should expect, too, since BDCs are often more volatile due to generally being riskier. To break it down, MAIN had a decline of 51.67%, and O was 38%.
Drawdown Breakdown (Portfolio Visualizer)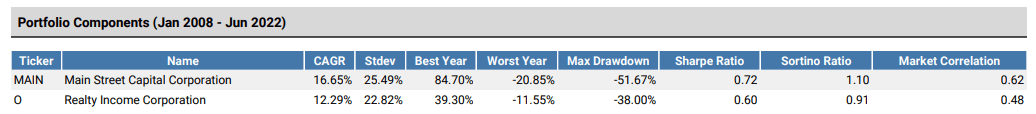
While MAIN was more volatile during market tantrums, both MAIN and O average right around the same volatility over the last decade. Neither is anywhere close to what we experienced during the March 2020 panic.
Ycharts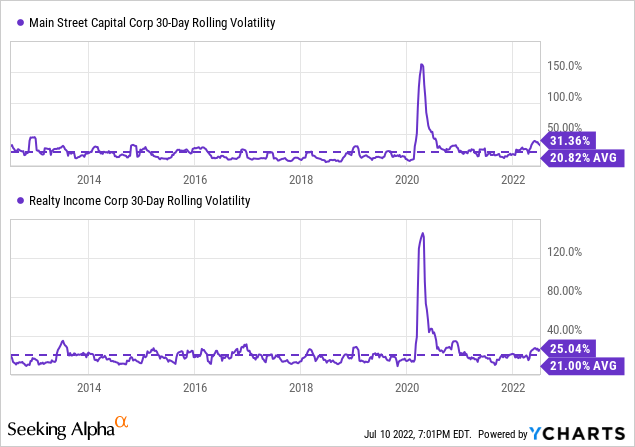
MAIN launched at the end of 2007, right before the GFC market crash. Not a bad time to take advantage of some great deals, but probably a stressful time to launch a BDC. If you used $10k and split it 50/50 with O and MAIN going back from January 2008 to June 2022, You’d end up with a total balance of $76,330 today. That’s on a total return basis, assuming dividend reinvestments.
$10k Growth (Portfolio Visualizer)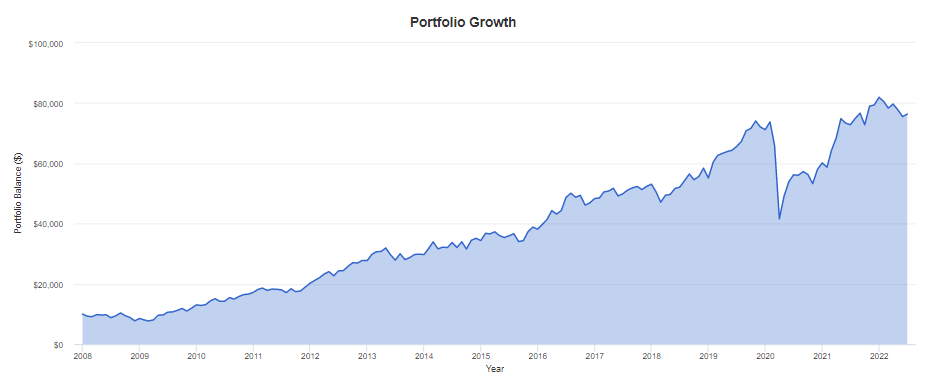
A Look At The Income
When looking at the dividends, we can see that since both have been incepted, they haven’t cut their dividends. That includes the great financial crisis for both of them. Though for MAIN, they were just basically getting started since they launched on October 4, 2007. O had their public listing in 1994.
Over this time, MAIN had many supplemental dividends paid out. Those had been phased out in 2020 but have made a reappearance more recently.
Main Dividend History (Seeking Alpha)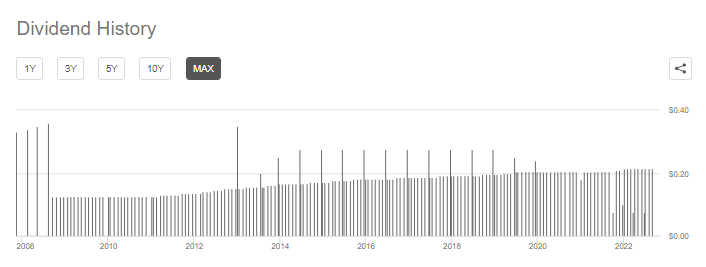
For O, we have a longer dividend history. They had survived through the early 2000s, the GFC and now COVID.
O Dividend History (Seeking Alpha)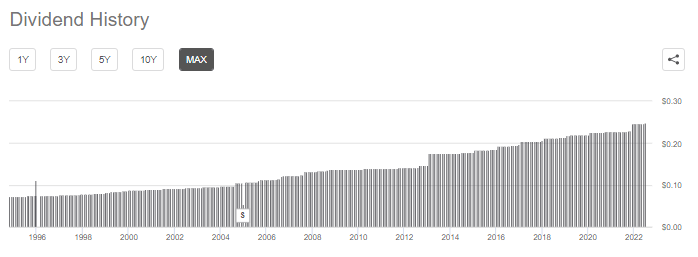
MAIN’s dividend yield currently comes out to 6.37%. They last reported NII of $0.77, putting the latest quarter’s payout ratio at a sustainable 83.77%. That might seem high for a company, but they have to pay out most of their earnings as a BDC. MAIN is expected to earn an NII of $2.92 for 2022. That puts the forward payout ratio at 88.36%.
O has a dividend yield of 4.31%. They similarly are required to pay out a substantial amount of their taxable income. Of course, this is one of the reasons why both of them are such great income plays. They last reported an FFO of $0.98, putting their payout ratio at 75.77%. Analysts expect FFO to come in at $3.99 for the next year. That would put the forward payout ratio at 74.44%.
Given the payout ratios and the consistency and commitment of both of these investments, a cut doesn’t seem likely even with a mild recession.
Over the last 10 years, MAIN has delivered a CAGR on its dividend of 3.95%. For O, this has been a bit higher at 5.5%.
High Inflation, Rising Rates And Recession
At this time, investors have a lot to consider before making an investment decision. We are looking at high inflation that is causing the Fed to move aggressively on raising rates. This, in turn, means the chance for a recession becomes more likely when the Fed purposely tries to slow down the economy to combat inflation. At this time, we may be in a recession already. The technical definition of a recession is two-quarters of negative GDP.
MAIN has a way of combating the higher interest rates. Like most BDCs, they have floating rate loans, while their leverage costs are primarily fixed rate.
While MAIN’s financial results are subject to impact from changes in interest rates, upside is greater than downside due to majority fixed rate debt obligations and majority floating rate debt investments with minimum interest rate floors
81% of their debt is at fixed interest rates, while 73% of their portfolio is tied to floating rates with an average floor of 105 basis points.
On the other hand, MAIN can be riskier during a recession because they invest in mostly below-investment-grade investments. That’s why the underlying loans are less than ideal for the one taking those loans out in the first place.
With MAIN being more susceptible to recession risks, it helps that their portfolio is quite diversified. That is through geography and industry.
For O, we are a bit more susceptible to higher rates means borrowing costs can go up. Higher inflation also means that expenses can increase without offsetting rises in rents with lower rent escalators for O. One way that inflation is combated, though, is through appreciation in the properties.
Additionally, 43% of O is rented out to investment-grade clients. They have a considerable amount of history and size that can help during recessions too. They are also diversified across the U.S., with properties in Europe as well.
Realty Income Characteristics (Realty Income)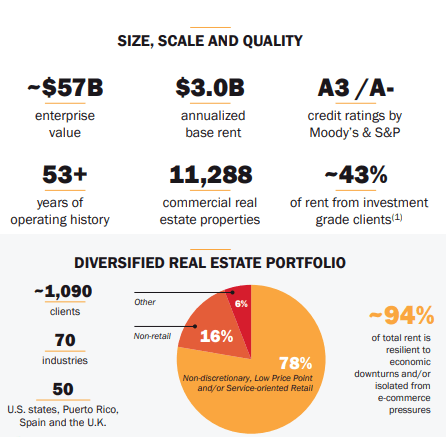
They put that 94% of other portfolio is resilient to economic downturns. This means that a recession should have a limited impact on their underlying tenants.
In summary, if one invested in a portfolio of just MAIN and O, an investor could be a bit more sheltered from the current economic situations than one might have initially thought. MAIN can thrive in higher rates/inflation, while a recession would be more difficult. O is lacking in a higher inflationary environment but could be steadier during a downturn; they should be able to handle that situation better with higher quality tenants.
Conclusion
A portfolio of just MAIN and O might not sound like a fantastic idea. However, I believe that at the end of the day, it wouldn’t be the worst way to be invested. In a way, both of these names are diversified as they are exposed to underlying holdings and tenants that are diversified in their own way. They help offset each other during the higher interest rate, higher inflation and recession risk environment.
So, while one might not just invest in these two, they certainly can be included in one’s income portfolio without worry. Over the long run, while they might not be the fastest growers, they have proven to be some of the steadier offerings. I suspect that, due to their terrific management teams, we can continue to expect to be rewarded as shareholders.
Be the first to comment