

Animaflora/iStock via Getty Images
The European big oil majors all trade at a discount to U.S. energy majors. In my opinion, the difference can be chalked up to 1) U.S. operators historically being more shareholder-oriented and achieving better outcomes for shareholders. 2) The push towards ESG has been stronger in Europe at times. Investors aren’t always prioritizing returns. 3) U.S. oil majors are focusing on E&P of oil & gas and aren’t diversifying into all kinds of businesses around the energy transition. 4) the opportunistic European windfall taxes certainly don’t help (Shell disclosed $2 billion+ hit today).
I think the energy transition is an incredibly interesting phenomenon that leads to opportunities all around (renewable and fossil). However, I have little confidence (a view shared by the market) European oil major CEOs have crystal balls allowing them to deploy their E&P cash flows most constructively and profitably with the uncertainty ahead of them. My general stance is CEOs are likely to screw cash flow deployment up.
That leads me to one of the reasons I kind of like Shell. Shell isn’t deploying its cash flows into wind parks and solar energy parks like other European oil majors. Its strategy, however doubtful I am, is focused on customers. Shell believes having relationships and distribution platforms connecting industry and customers will be the way of the future. If they’re right, they could actually be transforming into a much higher quality business (higher returns and more predictable returns on capital). But again, that assumes their crystal ball is working correctly, and few seem to do. Still, it is not as bad as plowing your relatively high-cost capital into undifferentiated capital-intensive businesses (solar/wind) with uncertain return profiles.
Shell is a special case in another respect, as it is compelled to shrink its asset base. When companies are shrinking assets, that always gets me interested because it usually means less waste and more returns to shareholders.
Shell is currently highly profitable, but it is the subject of a rather awkward court judgment that forces it to reduce emissions and discourage customers from emitting CO2 (I’ve reviewed the decision extensively here).
Meanwhile, Shell has appealed the decision. However, my understanding is the entire appeal process could take a few years from start to finish.
I don’t see any other reasonable likely route to achieve this that doesn’t include some significant asset sales. Shell is doing just that and in one of its latest moves, seems to be getting rid of projects where the social license isn’t really there.
Shell also has a new CEO per January the 1st and I’m tentatively optimistic this could mean a doubling-down on shareholder returns. However, I don’t think Ben van Beurden did a lousy job for shareholders as opposed to some of his predecessors.
I’ve pulled valuations of Seeking Alpha and highlighted some of the differences between relevant multiples of five major E&P companies:
|
SHELL |
TOTAL |
BP |
EXXON |
CHEVRON |
|
|---|---|---|---|---|---|
| P/E Non-GAAP (FY1) |
5.19 |
4.32 |
3.77 |
7.71 |
9.00 |
| P/E Non-GAAP (FY2) |
5.76 |
4.94 |
4.96 |
9.53 |
10.39 |
| P/E Non-GAAP (FY3) |
6.96 |
6.89 |
5.80 |
11.54 |
12.25 |
| P/E Non-GAAP (TTM) |
5.69 |
4.51 |
4.05 |
8.40 |
9.95 |
| P/E GAAP (FWD) |
5.79 |
5.36 |
NM |
7.92 |
8.88 |
| P/E GAAP (TTM) |
4.81 |
6.91 |
NM |
8.73 |
9.78 |
| PEG Non-GAAP (FWD) |
1.15 |
NM |
NM |
NM |
2.21 |
| PEG GAAP (TTM) |
0.01 |
0.06 |
– |
NM |
0.04 |
| Price/Sales (TTM) |
0.57 |
0.61 |
0.49 |
1.16 |
1.47 |
| EV/Sales (FWD) |
0.63 |
0.66 |
0.64 |
1.08 |
1.43 |
| EV/Sales (TTM) |
0.67 |
0.67 |
0.66 |
1.19 |
1.51 |
| EV/EBITDA (FWD) |
2.97 |
2.52 |
2.38 |
4.35 |
4.92 |
| EV/EBITDA (TTM) |
3.39 |
2.74 |
3.81 |
5.61 |
6.46 |
| Price to Book (TTM) |
1.07 |
1.31 |
1.82 |
2.36 |
2.10 |
| Price/Cash Flow (TTM) |
3.56 |
2.84 |
3.05 |
5.77 |
7.15 |
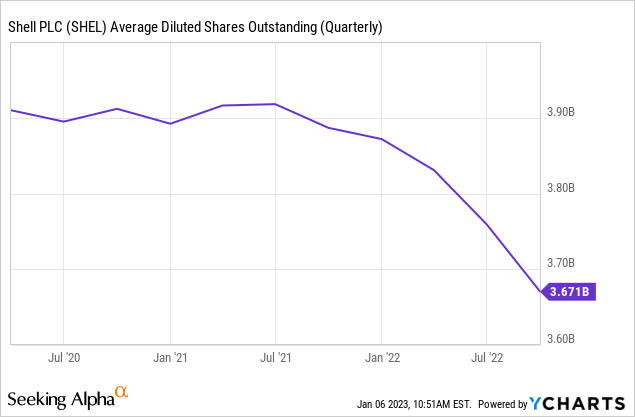
Shell is trading in line or at a discount even to European peers like TotalEnergies (TTE) and BP plc (BP). It is heavily discounted compared to Exxon Mobil (XOM) and Chevron (CVX). A large discount is warranted if you’re doing something that’s exceptionally bad. Shell is shrinking its share count fast (by ~10% last year):
It is by court order implicitly banned from making bad value destructive acquisitions (it would make it very difficult to achieve the emission reductions). Instead, it is being compelled to sell fossil fuel assets in what’s a fairly reasonable market for these assets. We’re not exactly talking bear market oil & gas right now. Meanwhile, it is paying a not insignificant 3.57% sustainable dividend while investing over $20 billion per year (10% of market cap) in its business. In my opinion, there have been worse times to buy Shell. I like it here and think it’s a buy if it suits one’s portfolio. Admittedly, I currently don’t own it myself, but I’m quite overweight energy as is.
Editor’s Note: This article discusses one or more securities that do not trade on a major U.S. exchange. Please be aware of the risks associated with these stocks.
Be the first to comment