

Peter Chronis/iStock via Getty Images
Risk/Reward Rating: Positive
They say there are three rules in real estate: location, location, location. If this remains true, The Macerich Company (NYSE:MAC) offers an asymmetric risk/reward opportunity. The company owns arguably the highest quality portfolio in the Retail REITs industry while trading at half the valuation of its leading peers with lower quality locations. As a result, we are adding Macerich to the dox it! list for stoxdox members.
At only 5.5x FFO (funds from operations), or cash flow in the Real Estate sector, Macerich trades at a steep discount to Simon Property Group (SPG), which I view as an excellent comparable company. The following table compares the valuation of Macerich to Simon based on consensus FFO estimates through 2026. The data was compiled from Seeking Alpha.
Seeking Alpha. Created by Brian Kapp, stoxdox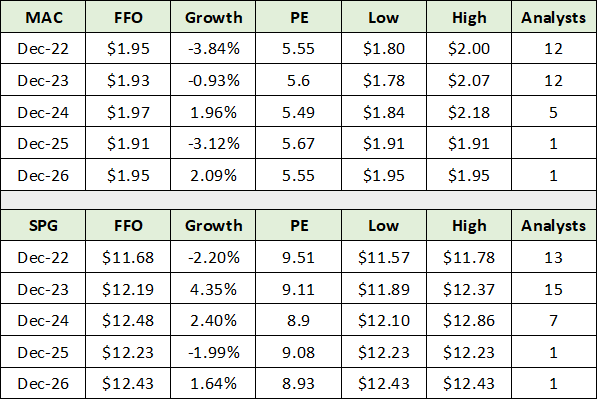
Notice that the growth estimates for each company are the same for all intents and purposes. Both Macerich and Simon are expected to face stagnation over the coming five years. Given the similar growth profiles, the valuation difference between the two must be the result of the risk level embedded in each company. The market perceives Macerich to be extraordinarily risky in comparison to Simon Property Group.
While Macerich is more leveraged than Simon, the quality of Macerich’s portfolio is decidedly higher. As we will see, Macerich tenants achieve materially higher sales on average than do Simon tenants. As a result, the large valuation discrepancy between the two appears to be pricing in extreme risk for Macerich. Excluding the possibility of a deep retail real estate downturn, much of the risk looks to be priced into the shares.
It should be noted that the broad Retail REITs industry has been under considerable stress for some time due to the secular shift to online shopping. In regard to this secular stress, Macerich’s focus on the high end of the market should provide relative insulation in comparison to Simon’s. As a result, Macerich’s high-quality assets should continue to provide support for its elevated debt levels.
Multiple Expansion
The valuation discount hints at a valuation expansion opportunity for Macerich. The following slide provides further color on the valuation of Macerich from a historical perspective. All Macerich slides here are from the company’s June 2022 Investor Presentation.
Macerich Investor Presentation Second Quarter 2022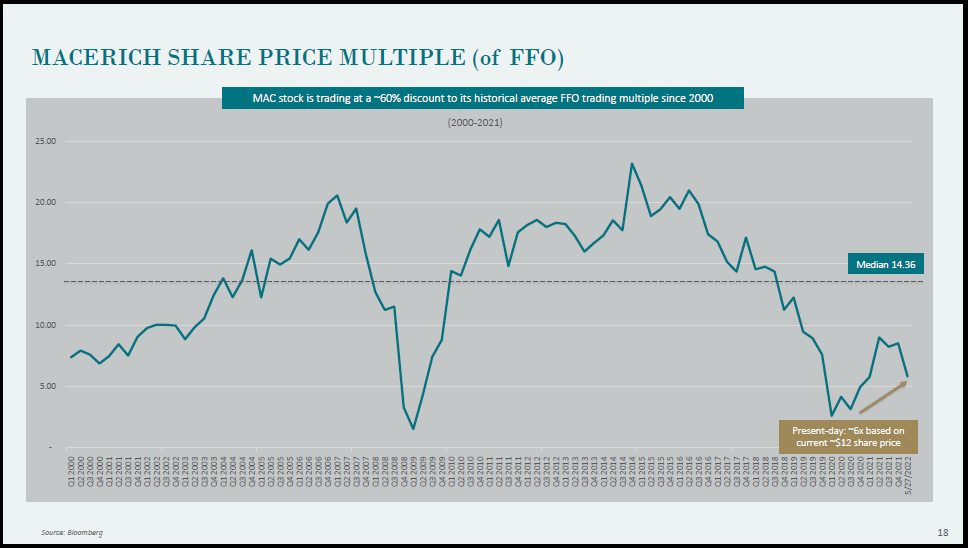
While I don’t expect Macerich to trade at its historical median valuation near 14x FFO, something more in line with Simon Property Group’s valuation closer to 10x FFO is a reasonable expectation over time. Interestingly, Tanger Factory Outlet Centers (SKT), which serves the middle of the market, is also valued near 10x FFO today.
While Simon is decidedly stronger financially, the quality of Macerich’s assets has an offsetting effect for those who are more risk-tolerant. Macerich offers above-average current income with a 5% dividend yield and well above-average price appreciation potential.
Location, Location, Location
Location is at the core of real estate investing. All other factors are usually subordinate in the investment decision. While low-quality locations can offer excellent investment opportunities if purchased at the right price, all else equal, great locations at a steep discount are preferred.
For perspective on the quality of Macerich’s portfolio, Macerich tenants are averaging retail sales of $843 per square foot while the last reported Simon figure was $693 in 2019. Simon no longer reports this figure in its financial releases. The following two slides display the locations of Macerich’s portfolio, followed by details regarding the company’s top ten assets.
Macerich Investor Presentation Second Quarter 2022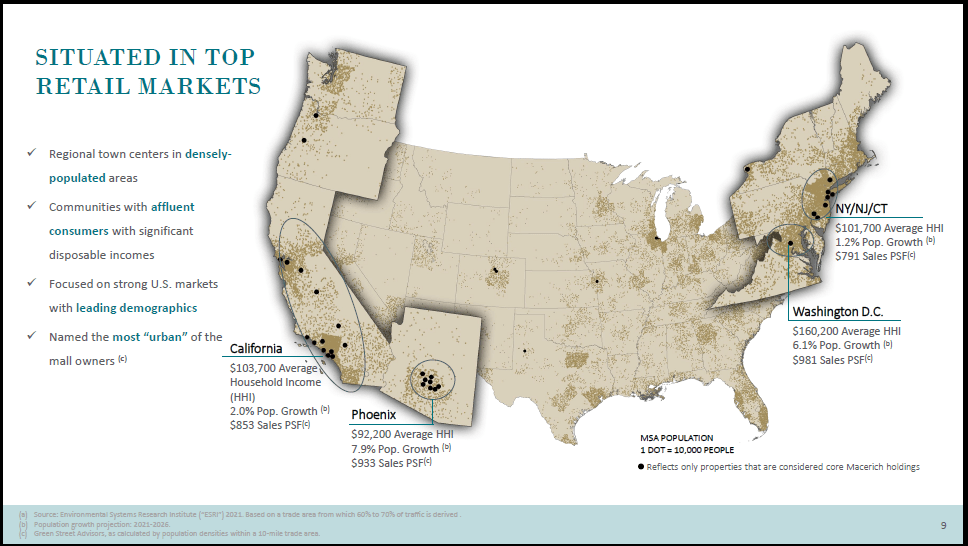
Top Ten Assets
Macerich Investor Presentation Second Quarter 2022
The following slide is from Simon Property Group’s Q2 2022 Supplemental Presentation. When compared to the Macerich property location map above, it is clear that Simon’s portfolio is much more diversified across the United States, with broad exposure to the middle market segment.
As a result, Simon is more exposed to the broad retail real estate market compared to Macerich. In terms of the secular stress discussed above, Macerich’s focus on the high end of the market should provide relative insulation in comparison to Simon.
Simon Property Group’s Q2 2022 Supplemental Presentation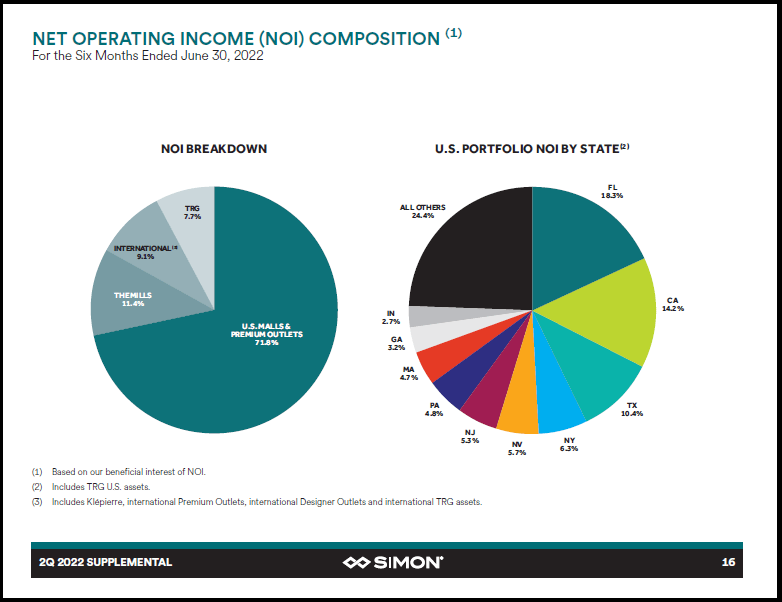
With the portfolio differences above in mind, it is not clear to me that Simon is as safe in comparison to Macerich as the valuation difference suggests. Looking to Tanger Factory Outlets for another reference point, it too is valued at nearly 2x the multiple of Macerich. Tanger is decidedly riskier than Simon while trading at the same valuation. All signs point toward material valuation expansion potential for Macerich.
Investment Case
Macerich possesses the key ingredients for an excellent real estate opportunity: high-quality assets at a discounted price. The following slide presents a general overview of recent trends and Macerich’s current financial position. The company appears to have ample liquidity at over $600 million while generating $230 million of disposable free cash flow after the dividend payment.
Macerich Investor Presentation Second Quarter 2022
With a market capitalization near $2.4 billion, Macerich is paying a 5% dividend with an additional 10% of disposable free cash flow. A 15% free cash flow yield on top-quality real estate is an unusual opportunity in the real estate sector.
Technicals
The technical backdrop is a mirror image of the fundamentals discussed above. For Macerich, it is best to start with the big picture. On the 20-year monthly chart below, notice that Macerich has carved out a well-defined trading range with enormous amplitude (roughly $5 to $70).
Macerich 20-year Monthly Chart (Created by Brian Kapp using a chart from Barchart.com)
The shares are currently testing the lower end of this range and are nearing levels only seen during market panics, the GFC and COVID. Please note that the orange lines represent resistance levels and the green lines represent the primary support zone. Macerich is currently finding support at the upper green line. The following 5-year weekly chart provides a closer look.
Macerich 5-year Weekly Chart (Created by Brian Kapp using a chart from Barchart.com)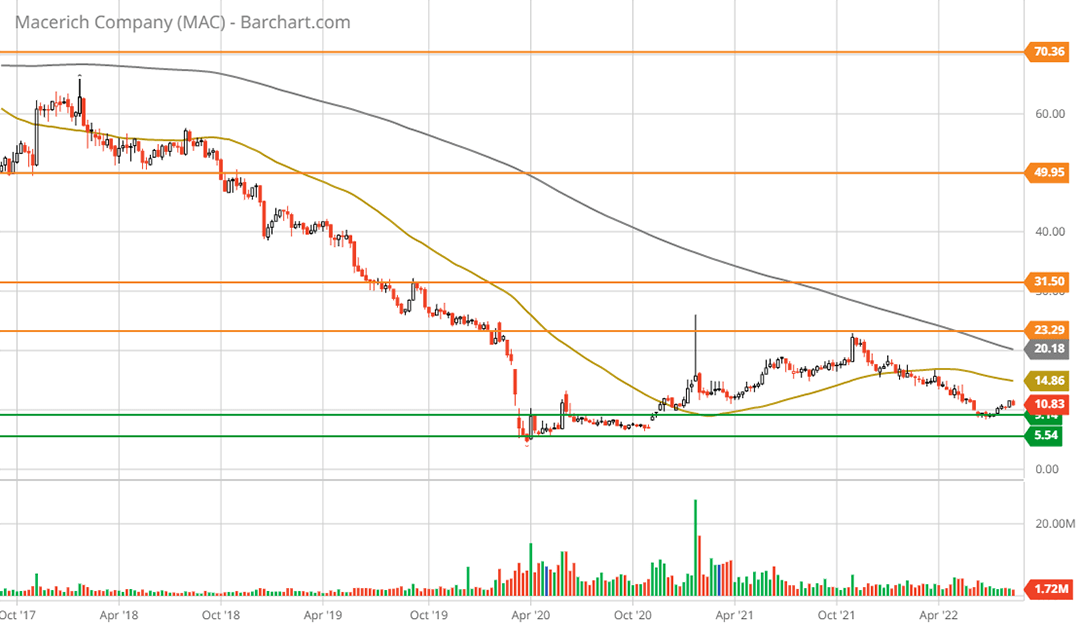
I would estimate that Macerich will be roughly confined to the zone defined by the first support and resistance lines for the foreseeable future, or $9 to $22. With the shares trading near $11, the technical asymmetry is clearly to the upside.
The second resistance level just above $30 is a possible price target for the future, however, it appears unrealistic nearer term given the state of the Retail REIT industry. The 1-year daily chart below provides a closer look at the Macerich opportunity. Please note that the gold trendline represents the 50-day moving average, which is near $10 currently. The grey trendline near $14 is the 200-day moving average and serves as a natural target area.
Macerich 1-year Daily Chart (Created by Brian Kapp using a chart from Barchart.com)
The price zone between $15 and $16 is likely to offer the first material resistance if an uptrend is to unfold. This price range represents a high probability trade opportunity prior to heavier resistance near $22.
Summary
Macerich’s above-average risk is counterbalanced by the quality of its portfolio, discounted valuation, and strong technical setup. The risk/reward asymmetry is skewed to the upside, thus receiving a positive rating.
For those looking for exceptional growth opportunities, the valuation expansion potential is material. For those looking for growth and income, the income is above average for the equity markets at 5% and is competitive in the Real Estate sector overall. Macerich possesses the key ingredients for a great real estate opportunity: high-quality assets at a discounted price.
Be the first to comment