

scyther5
2022 Global Value Review
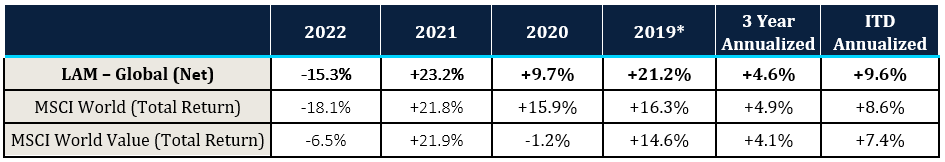
| *Partial year, inception date of 5/31/19. Past performance is not necessarily indicative of future results. |
The Global Value portfolio outperformed the MSCI World index by 290 bps in 2022. For the first three quarters of the year, the portfolio was slightly behind the index, before surging in the fourth quarter, with a +15.1% return, compared to +9.8% for the MSCI World.
Since inception in 2019, the portfolio has generated a 9.6% annualized return, with 100 bps and 220 bps of annual outperformance, against the MSCI World and MSCI World Value indices, respectively. We have achieved this result while climbing a wall of worry that has included: a value downcycle in 2019, COVID in 2020, an economic reopening in 2021, and then inflation, rising interest rates, the war in Ukraine, and a weakened European economy in 2022.
From a valuation perspective, the portfolio is trading at 9.4x 12-month forward earnings, which is as cheap as it’s been since the strategy was launched in 2019. And, from an earnings perspective, the portfolio shows superior fundamentals with better historical earnings growth and more resilient earnings during economic downturns. Since inception, we have not seen as attractive a combination of value and growth in our portfolio.
LOOKING BACK
The Global Value portfolio ended 2022 ahead of the MSCI World but behind the MSCI World Value. The portfolio lagged the value index in 2022, with most of this underperformance attributable to differences in sector composition. Relative to the World Value index, the portfolio is overweight Information Technology and Consumer Discretionary by 31%, which we estimate created an ~5% headwind to returns. The portfolio is 15% underweight Energy and Consumer Staples, which hurt performance by another ~5%. In summary, sector weightings explain all the -8.8% relative return to the value index and then some.
While the sector differences to the value benchmark hurt the performance in 2022, we think that our positioning is right for the long haul. These sector weights emerge from our bottom-up stock selection process, not from an active top-down approach.
Besides Value, we look for Quality and Analyzability. The traits of Quality and Analyzability have led us toward cheap stocks with attractive growth within the Information Technology and Consumer Discretionary sectors, and away from cheap unanalyzable stocks within the Energy sector and expensive stocks within Staples.
THE ERROR OF TRACKING VALUE INDICES
We worry little about tracking the MSCI World Value, which is structured to own lower-growth businesses (like consumer staples) or lower-quality businesses (like energy and commodities). This hasn’t been a winning long-term approach for that index. On the graph below, we present the annual return of the MSCI World Value relative to the MSCI World going back to 2000. The tech bubble burst in March 2000 and the value index had an amazing year, outperforming by over 13 percentage points. Over the next six years, the value index continued to outperform, and over the full seven-year period, the value index cumulative return was 52.9% compared to just 16.1% for the MSCI World, an outperformance margin of 36.8 percentage points.
In 2007 the good run for the MSCI World Value ended, and for the next 15 years it underperformed almost every year. Over that period, the value index still appreciated 99.7%, but it lagged the 193.2% return of the MSCI World by a whopping 93.5 percentage points. Now, finally, in 2022 the value index had its best year of relative performance since the tech bubble ended in 2000, outperforming by 11.6 percentage points.
MSCI World Value Returns Relative to MSCI World
Source: FactSet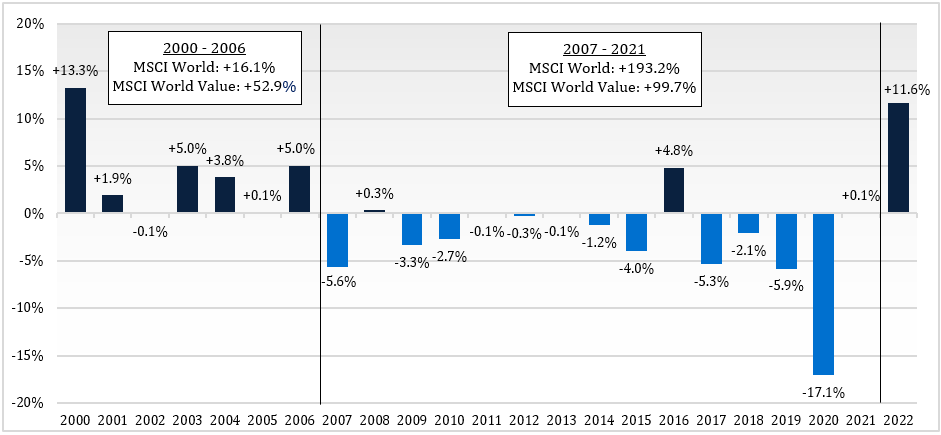
Lyrical’s returns have not always been in sync with those of the value indices, and we see this is as a good thing. Since we launched in 2019, we outperformed the MSCI World by 4 percentage points cumulatively while the MSCI World Value underperformed the World index by 5 percentage points.
TIME FOR DEEP VALUE
The biggest difference between our portfolio and the MSCI World Value is that we are deeper value, trading at a 30% cheaper P/E ratio. Unlike the index, we only invest in the cheapest stocks in the market because these stocks have delivered a consistent source of alpha. As shown below, the cheapest 20% of stocks in global developed markets have delivered outperformance of nearly 6% per year compared to the MSCI World since 1974. Notably, the MSCI World Value has underperformed over this entire period, in the process giving value a bad name.
Why Global Value Stocks
Source: FactSet. Lyrical exercised discretion in determining the dates of each cycle.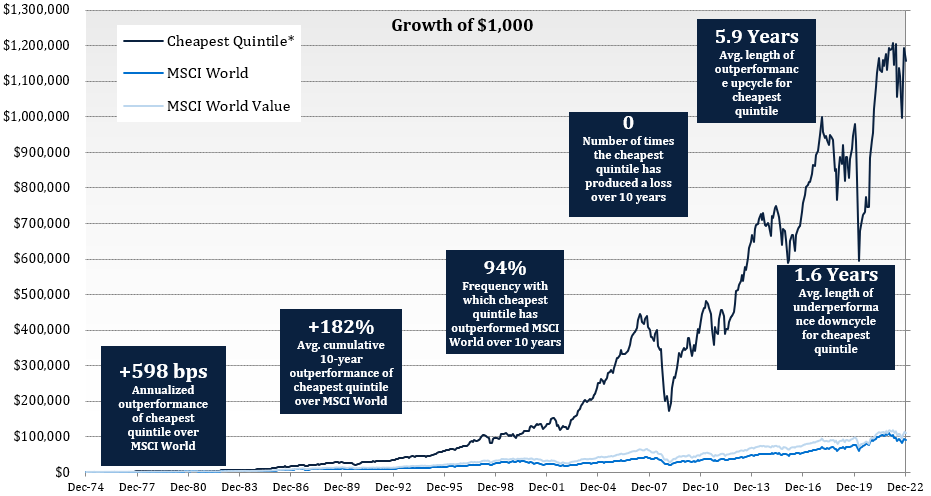
Owning truly cheap stocks has been a winning formula over the very long-term, but value does go through downcycles. The table below shows the data from the above chart, comparing the performance of the cheapest stocks in global markets to the MSCI World. We highlight value upcycles in blue. As summarized at the bottom, value upcycles have lasted about seven years in global markets, and they’ve been interrupted by downcycles lasting almost two years. From March 2018 to May 2020, global value stocks had their second worst downcycle, underperforming the MSCI World by -14.8%, annualized.
TIME FOR DEEP VALUE
Owning truly cheap stocks has been a winning formula over the very long-term, but value does go through downcycles. The table below shows the data from the above chart, comparing the performance of the cheapest stocks in global markets to the MSCI World. We highlight value upcycles in blue. As summarized at the bottom, value upcycles have lasted about seven years in global markets, and they’ve been interrupted by downcycles lasting almost two years. From March 2018 to May 2020, global value stocks had their second worst downcycle, underperforming the MSCI World by -14.8%, annualized.
History of Global Value Performance Cycles
Source: FactSet. Lyrical exercised discretion in determining the dates of each cycle.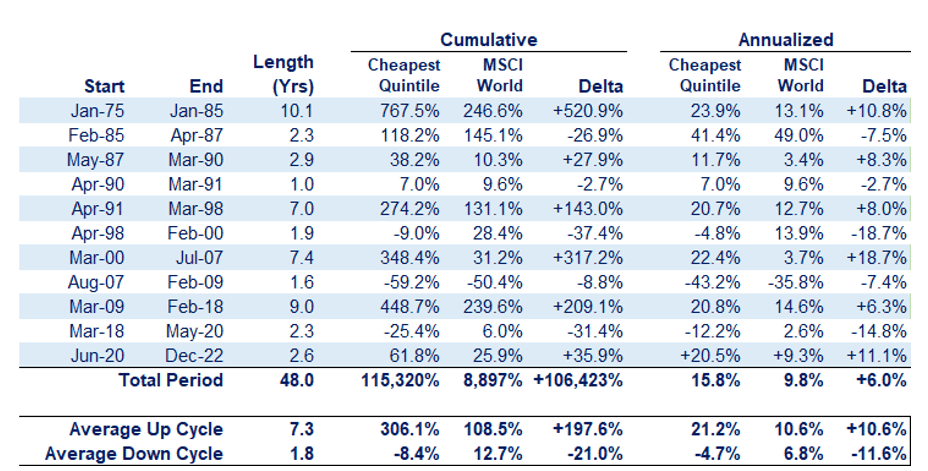
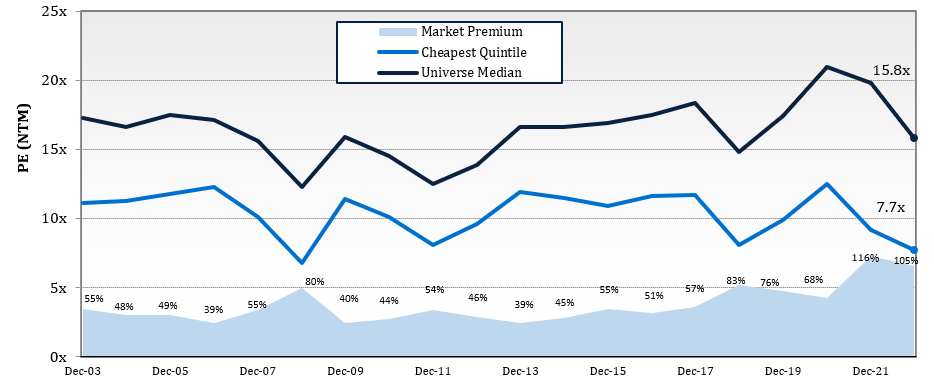
Historically, the worse a downcycle is in value stocks, the better the upcycle on the other side, and we believe this sets the stage for abnormally good returns in value stocks from here for years to come. When value stocks underperform—as they did from 2018 to 2020—the valuation spread between these cheap stocks and the market widens. As shown below, the P/E for the median stock in our 2,500-stock global universe is 15.8x, or 105% more expensive than the median stock in the cheapest part of the market. This is an extreme spread that is wider than we saw in the Global Financial Crisis, after which value stocks outperformed for nine years at more than 6% per year. We outperformed during a challenging period for value stocks, but now we think the wind is at our back and expect future returns to be even better.
Value Spreads Abnormally Wide
SPOTLIGHT ON EUROPE: GLOBAL COMPOUNDERS ON SALE
In 2022, we initiated nine positions, five of them in Europe. This increased our European exposure to 20% of the portfolio, which is in line with the MSCI World’s exposure. An increased exposure to Europe during a year that saw a ground war, an energy crisis, and a collapsing currency may raise some eyebrows. With such a tumultuous macroeconomic backdrop, investors may wonder why one would want more European exposure. While we don’t disagree with these macro concerns, we believe this broad-based macroeconomic fear has created a wonderful opportunity to own good, global businesses, trading at deep discounts.
Macro concerns around Europe are real. However, these concerns have depressed the valuations of many European-listed global businesses. For the five European businesses we added in 2022, less than 50% of revenues comes from Europe on average. In the chart below, we show the portfolio exposure by stock listing and by business revenue. While we have added to Europe, we remain widely diversified across developed economies by both listing and revenues.
Portfolio Revenues are Globally Diversified
Source: FactSet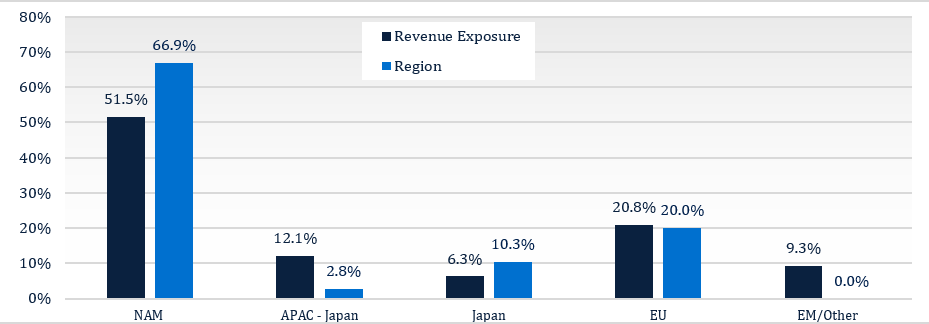
VALUING RESILIENCY
It’s important that the European businesses in the portfolio are more global in nature, but it is equally important that they have flexible business models that can withstand macroeconomic shocks. Because we don’t forecast macroeconomic conditions, it’s critical we own resilient businesses; since we cannot predict the macroeconomic conditions, we must own businesses that can quickly adapt to changing macroeconomic scenarios.
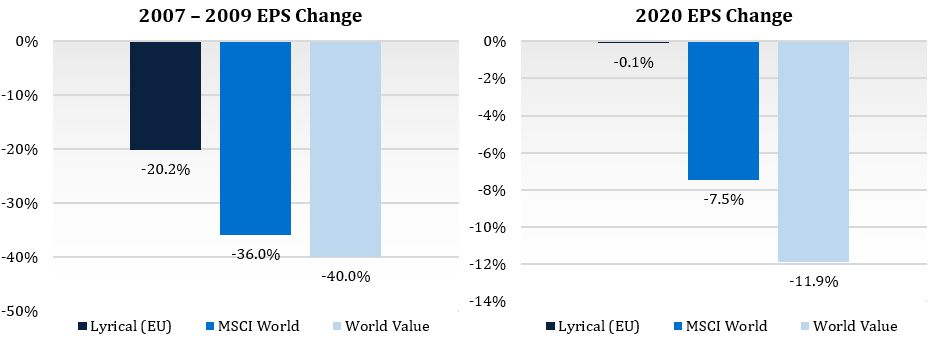
As a result, we favor variable cost and low capital-intensity businesses. Of the portfolio’s exposure to European-listed businesses, 70% is within consumer or business services. Even when times are tough, these businesses can adjust. In the financial crisis in 2008-2009 and during the pandemic of 2020, the earnings for the European businesses (in the current portfolio) fell significantly less than those of the market, as you can see below.
Lyrical European Companies Resilient in the Worst of Times
OWNING COMPANIES THAT GROW IN ANY MACRO, INCLUDING EURONEXT
For example, in 2022 we purchased Euronext (OTCPK:EUXTF), a market exchange business that operates seven local country exchanges across Europe, including the Paris Stock Exchange and the Borsa Italiana. In the chart below, we show the stock price, EPS, and forward P/E for Euronext since the company was spun off from the Intercontinental Exchange (ICE) in 2014. As shown in the middle of the chart, the company has compounded EPS at a 19% annualized rate. Despite this impressive growth, we were able to acquire the shares for only 12x P/E, one of the lowest valuations ever for the business and 50% cheaper than market exchange peers that have grown at a slower rate on average.
Euronext: Cheapest Global Exchange despite Industry-Leading EPS Growth
Source: FactSet. A list of all recommendations is available upon request.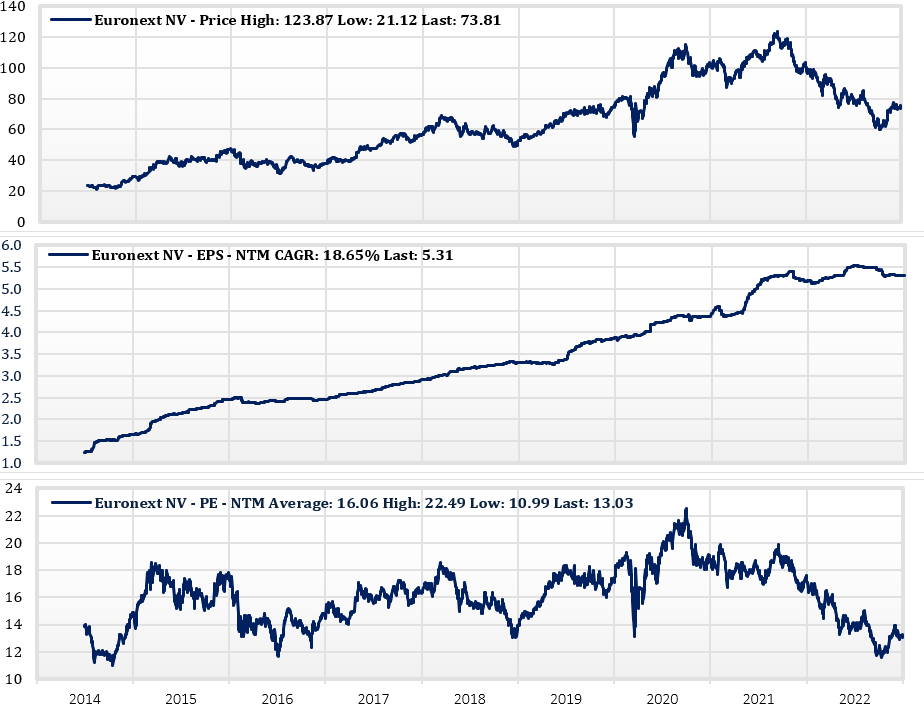
Exchanges are classic network effects businesses, and they are resilient. The exchange that connects the most buyers and sellers of any asset allows for the most accurate pricing, which drives more buyers and sellers to its platform. In Europe, Euronext is the scale exchange. By combining seven local markets into one trading platform, the company has created the deepest liquidity pool in Europe, with a market share above 70% across its footprint. This scale advantage for Euronext, combined with a capital-light business model, drives its operating margin above 50%. The business is highly defensive, as about 60% of Euronext’s revenues are recurring, including fees from licensing their index data for ETFs and fees for providing unique European government bond data. The remaining 40% of revenues are driven by trading, which is countercyclical. During periods of crisis, people tend to trade more. We saw this during COVID when revenues rose 30% in 2020. Beyond being defensive, Euronext is also a business that has grown faster than its underlying GDP.
In fact, in aggregate, the European portfolio companies have organically expanded their topline two percentage points above their local GDP over the past five years.
Over the past five years, Euronext has grown organic revenues around 6% per year, more than three percentage points better than the European economy. As Euronext continues to add services and data offerings and as it continues to consolidate the fragmented European exchange market, we expect organic growth to continue, even if Europe were to enter a prolonged recessionary period. This growth in sales comes with a limited need to grow its relatively small, fixed cost base. As such, we expect the company to continue growing EPS at a double-digit rate.
PUTTING IT TOGETHER: COMPOUNDERS IN THE BARGAIN BIN
In the European region, we’ve put together a portfolio of companies that we believe should succeed no matter what the macroeconomic conditions bring. These companies have already delivered 7% earnings growth since 2007, during a period when Europe has had more than its fair share of turmoil and while the STOXX Europe 600 benchmark grew earnings at just ~1%. Despite this growth and resiliency in the portfolio, the European stocks trade at just 10x 12-month forward earnings.
While the European stocks only make up 20% of the portfolio, the remaining 80% of the portfolio is similarly attractive. The broad global portfolio trades with a forward P/E of 9.4x but has delivered 7.7% EPS growth since 2007, as shown below. And while these stocks are cheap on forward P/E, that only tells part of the story. With their exceptional growth rates, we see the portfolio trading at an average of 4.8x five-year forward earnings, compared with the long-term median multiple for the universe of 9x.
Uncommon Combination of Value and Growth
Source: FactSet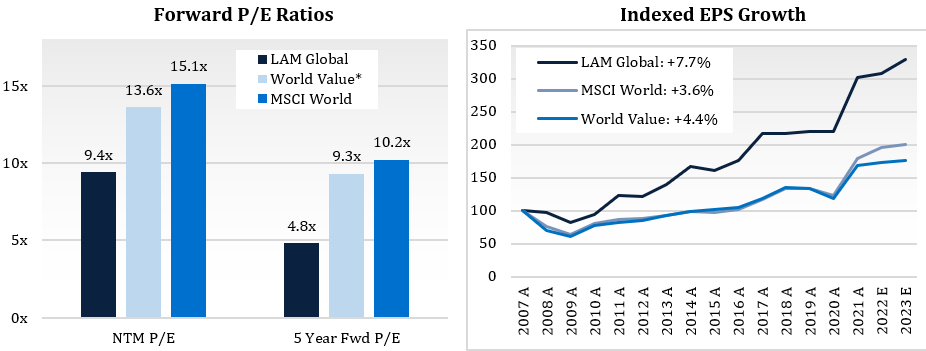
LOOKING FORWARD
We anticipate strong returns on an absolute and relative basis from here. The MSCI World trades for about a 60% premium to the portfolio, and we see the upside to intrinsic value above 80%.
As bottom-up investors, that’s a positive, as it creates opportunities in the cheapest part of the market to find good businesses at bargain prices. Over time the fundamentals should shine through.
Andrew Wellington, John Mullins, and Dan Kaskawits
|
THIS IS NOT AN OFFERING OR THE SOLICITATION OF AN OFFER TO INVEST IN THE STRATEGY PRESENTED. ANY SUCH OFFERING CAN ONLY BE MADE FOLLOWING A ONE-ON-ONE PRESENTATION, AND ONLY TO QUALIFIED INVESTORS IN THOSE JURISDICTIONS WHERE PERMITTED BY LAW. THERE IS NO GUARANTEE THAT THE INVESTMENT OBJECTIVE OF THE STRATEGY WILL BE ACHIEVED. RISKS OF AN INVESTMENT IN THIS STRATEGY INCLUDE, BUT ARE NOT LIMITED TO, THE RISKS OF INVESTING IN EQUITY SECURITIES GENERALLY, AND IN A VALUE INVESTING APPROACH. PLEASE SEE WWW.LYRICALAM.COM/NOTES OR A DISCUSSION OF CERTAIN MATERIAL RISKS OF AN INVESTMENT IN LYRICAL’S STRATEGIES. PAST PERFORMANCE IS NOT NECESSARILY INDICATIVE OF FUTURE RESULTS. LAM – GLOBAL RESULTS ARE UNAUDITED AND SUBJECT TO REVISION, ARE FOR A COMPOSITE OF ALL ACCOUNTS, AND SHOW ALL PERIODS BEGINNING WITH THE FIRST FULL MONTH IN WHICH THE ADVISOR MANAGED ITS FIRST FEE-PAYING ACCOUNT. NET RETURNS INCLUDE A 0.75% BASE FEE. The MSCI World Index is an equity index which captures large and mid cap representation across 23 developed market countries around the world. With 1,517 constituents, index covers approximately 85% of the free float-adjusted market capitalization in each country. The MSCI World Value Index captures large and mid cap securities exhibiting overall value style characteristics across 23 Developed Markets countries around the world. The value investment style characteristics for index construction are defined three variables: book value to price, 12-month forward earnings to price and dividend yield. Notes: All market data is courtesy of FactSet. The Forward P/E Ratios chart compares the weighted average next twelve months P/E ratios as of December 31, 2022 for the LAM-Global composite and the MSCI World Index and the MSCI World Value Index. Five year forward value is the product of five-year forward projected earnings (determined by applying to the latest year of forward projected earnings the median analyst estimate of long-term growth rates, subject to a 17% maximum and a minimum of 10% less the dividend yield) multiplied by the country-specific earnings multiple, plus net cash, plus five times the positive (or minus five times the negative) difference between dividend yield and the median dividend yield of the investment universe. The Indexed EPS Growth chart depicts the historical change in earnings per share of the companies in the LAM Global Value Equity composite as of December 31, 2022 using current composite share holdings as of December 31, 2022. Actual share holdings varied over time. Earnings per share is computed using consensus earnings data per FactSet, which include certain adjustments from reported, GAAP earnings. Periods marked with an “E” include estimated earnings per share. |
Editor’s Note: The summary bullets for this article were chosen by Seeking Alpha editors.
Editor’s Note: This article discusses one or more securities that do not trade on a major U.S. exchange. Please be aware of the risks associated with these stocks.
Be the first to comment