


kasezo/iStock via Getty Images
Price Action Thesis
We present a detailed price action analysis on Lumen Technologies, Inc. (NYSE:LUMN) stock. It’s a commonly-regarded value play but shunned by momentum investors, given its bearish bias. Its price action is also filled with a series of bull/bear traps, allowing nimble investors to capitalize on swing-trading opportunities.
However, LUMN stock remains in negative flow, even though the potential for a sustained reversal remains possible. Notwithstanding, several bull traps creating lower highs have continued to hinder sustained recovery. Therefore, the market has rejected buying momentum from dip buyers convincingly.
Our reverse cash flow valuation analysis suggests that investors could continue to underperform the market if they add at the current levels. However, our price action analysis indicates that a potential short-term rally could ensue, as it’s likely to be at its near-term support.
Therefore, we rate LUMN as a Hold for now. However, we will reassess our rating if we subsequently observe significant developments in its price action.
Still in A Long-Term Downtrend

LUMN price chart (monthly) (TradingView)
LUMN stock has been in a long-term downtrend since the bull trap in 2014 sent it into negative flow (decisive bearish momentum). Furthermore, a series of bull traps over the years have hindered buying momentum from dip buyers. Therefore, those bull traps managed to draw in buying from “value-seeking” investors before forcing steeper sell-offs, creating lower lows.
However, the COVID bottom in March 2020 created a noteworthy bear trap that has since held firmly as LUMN’s long-term support. Moreover, LUMN stock has also failed to break down to lower lows over the past two years, further corroborating the resilience of its long-term support.
However, a series of bull traps post-COVID bottom has continued to hamper its recovery momentum.
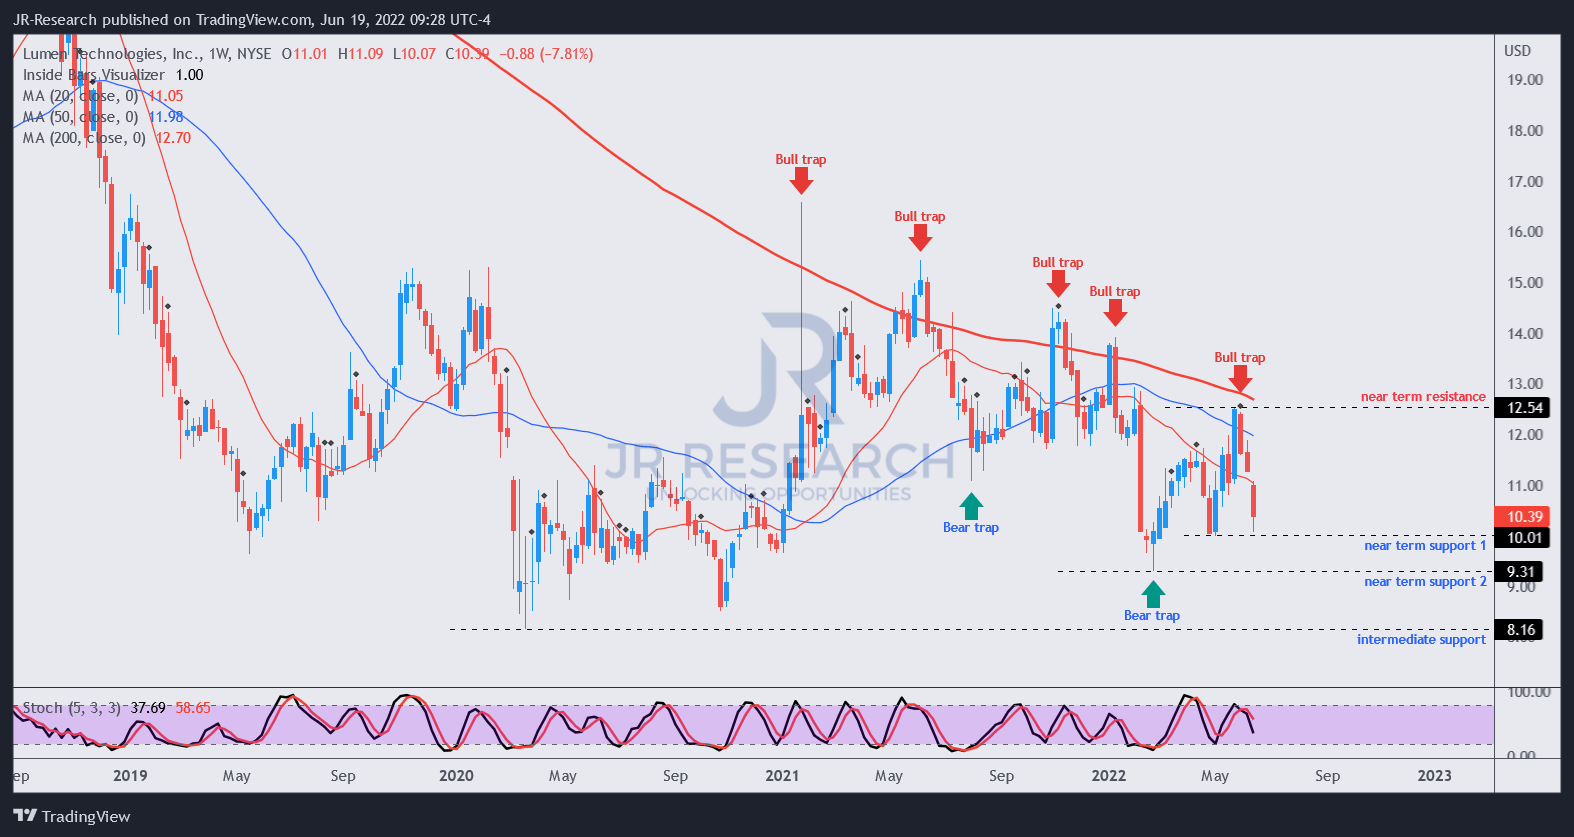
LUMN price chart (weekly) (TradingView)
Moving over to its weekly chart, we can glean the series of bull traps that have dominated its bearish bias. Even though it has held its COVID bottom (marked as intermediate support), the series of lower high bull traps don’t augur well for a sustained reversal in momentum.
The recent rapid liquidation from its May bull trap sent LUMN to “near-term support 1.” Therefore, we believe that the stock could continue to consolidate at the current levels. It’s also defended by “near-term support 2,” which also had a validated bear trap in February (but resolved by May’s bull trap).
Therefore, the price action signals aren’t clear, as we have not observed any bear trap bottoming price action.
But, Valuation Remains A Concern

LUMN valuation metrics (TIKR)
It looks very cheap for a stock that last traded at an NTM normalized P/E of 8x and an NTM FCF yield of 12.46%. But, investors are also reminded to ask themselves why the market has demanded such high FCF yields (5Y mean: 20.89%) to hold LUMN stock. In addition, its secular downtrend seen previously should proffer investors some meaningful clues over its valuations.
However, we also indicated there’s a possibility for a reversal in trend if the COVID bottom holds robustly. Notwithstanding, the series of lower high bull traps are not encouraging.
| Stock | LUMN |
| Current market cap | $10.73B |
| Hurdle rate (CAGR) | 10% |
| Projection through | CQ2’26 |
| Required FCF yield in CQ2’26 | 12.5% |
| Assumed TTM FCF margin in CQ2’26 | 9% |
| Implied TTM revenue by CQ2’26 | $21.83B |
LUMN stock reverse cash flow valuation model. Data source: S&P Cap IQ, author
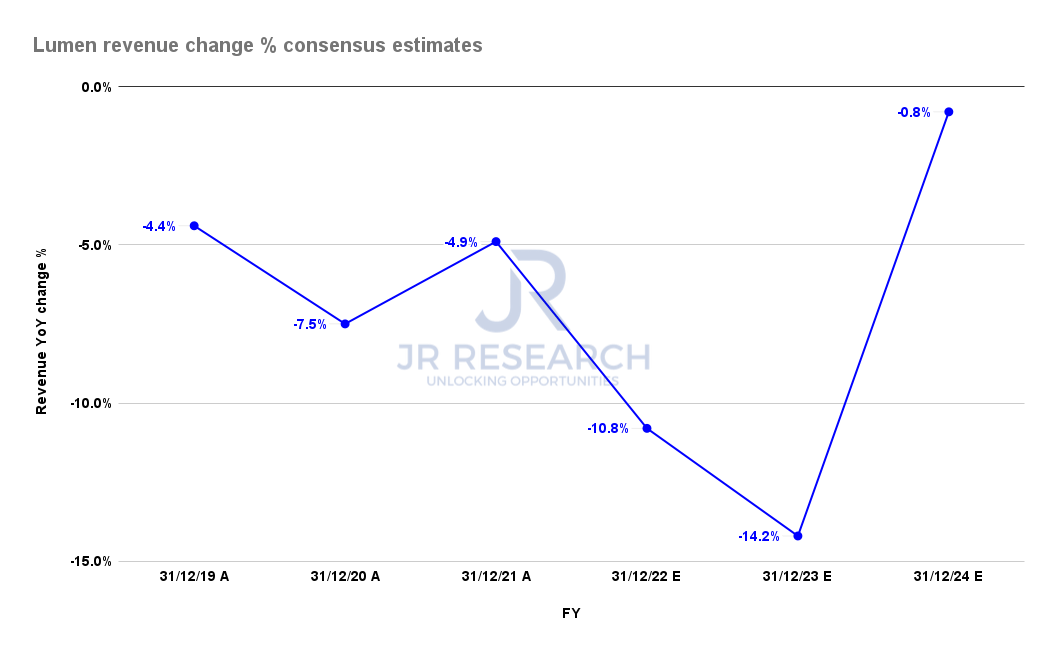
Lumen revenue change % consensus estimates (S&P Cap IQ)
The consensus estimates (generally neutral) suggest that Lumen’s revenue will likely continue falling through FY23 before leveling off in FY24. As a result, Lumen is unlikely to meet our hurdle rate at its current valuation. We also used its current FCF yield of 12.5%, which is much lower than its 5Y mean.
If we were asked to consider a lower hurdle rate than what we require in our model, we would instead move on to another investment opportunity. Therefore, we believe investors adding here could likely lead to continued underperformance against the market.
Is LUMN Stock A Buy, Sell, Or Hold?
We rate LUMN stock as a Hold for now.
Our price action analysis suggests it could be at a near-term bottom, undergirded by its near-term support. Our valuation analysis suggests that adding at the current levels could lead to continued underperformance against the market.
Be the first to comment