


Darren415
This article was first released to Systematic Income subscribers and free trials on Aug 2.
In this article we look at the AGNC Investment Corp. (AGNC) and Annaly Capital Management (NLY) from a preferreds perspective. The two companies are the largest agency-focused mortgage REITs and often mentioned in the same breath. Between them they boast 7 preferreds which can make it difficult for investors to gauge which ones are most attractive at any given time. Apart from looking at yields on offer we highlight which ones can appeal to different types of investors.
Evaluating mREIT Preferreds
There are three key metrics we look at when comparing preferred securities of different agency-focused mREITs: leverage (the lower the better), equity / preferred coverage (the higher the better) and percentage of agency holdings in the portfolio (the higher the better).
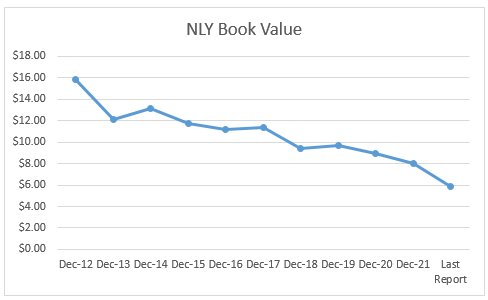
It’s probably obvious but for preferreds shareholders lower leverage is more desirable as lower leverage protects book value. This is because mREIT book value moves are highly asymmetric. Unlike “normal” stocks, a large move in the book value of an mREIT is much more likely to be lower than higher. An agency-focused mortgage REIT is highly sensitive to a deleveraging – something we tend to see pretty regularly – the last time being during the COVID crash. A deleveraging will cause the mREIT to shed assets in order to pay down a portion of its debt, in order to keep leverage from spiking upwards. The following is a book value chart for NLY which shows this asymmetric dynamic with frequent large moves lower and no sharp moves higher. A lower leverage level minimizes the extent of book value drops.
Systematic Income
Equity / preferred coverage is simply a ratio of total stockholders’ equity divided by preferred liquidation preference. It is a measure of how many dollars of equity there is for each dollar of preferreds “outstanding”. A ratio of 5 means there is $5 of equity (i.e. difference between assets and liabilities) for each $1 of preferreds outstanding. The higher the equity / preferred coverage ratio the better.
Finally, a mortgage REIT can hold, broadly speaking, two types of assets: agency MBS or something else. That “something else” is typically more volatile than agency MBS and can include things like non-agency RMBS, MSRs, whole loans, real estate, CLOs and others. Although a lot of mortgage REITs praise assets like MSRs for their interest rate “hedging” ability (which is true) these assets tend to crater during liquidity shocks as they did in 2020. They also become highly illiquid, making it much more difficult for an mREIT to deleverage smoothly.
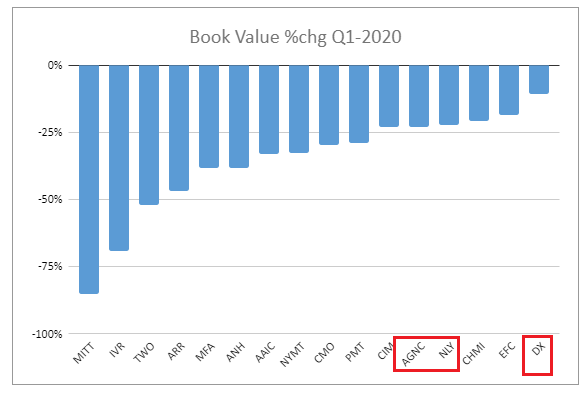
If we look back to how mREIT book values performed over the COVID crash we see that those that held the highest proportion of agencies (highlighted in the chart below) generally fared best. They also did not face margin issues or had to ask their lenders for standstill agreements as a number of credit-oriented mREITs had to do in 2020. For this reason, when looking at the agency mREIT space, we generally prefer to see a higher level of agencies all else equal. However, as all the names in this space (as defined by us at least) have at least a 95% allocation to agencies, this metric is much less of a differentiator and, therefore, less important than the other two.
Systematic Income
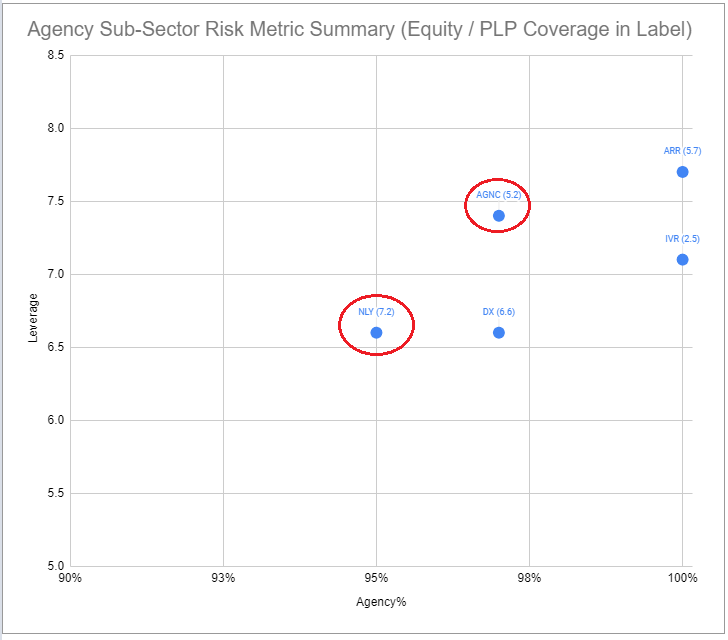
These three metrics are shown in the chart below taken from our service Preferreds Tool. Leverage is on the y-axis, percentage of agencies in the portfolio is on the x-axis and coverage is in the label in parentheses. AGNC and NLY are highlighted.
Systematic Income Preferreds Tool
The agency allocation is pretty similar across the two portfolios. NLY also has lower leverage by close to a full turn and significantly higher coverage at 7.2x vs 5.2x. Therefore, at current metrics, NLY has a stronger credit profile in our view.
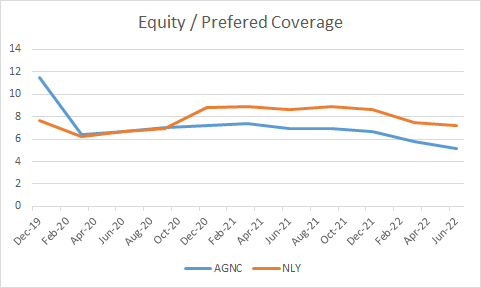
Investors who follow these two names may recall that it wasn’t very long ago that AGNC equity / preferred coverage was actually higher than that of NLY. We plot the evolution of coverage for both names over the last few years. The chart shows that AGNC started off at a significantly higher level which has now moved below that of NLY.
Systematic Income
In our view, this is a reflection of three trends. First, AGNC issued a preferred AGNCP in February of 2020 which pushed its coverage lower.
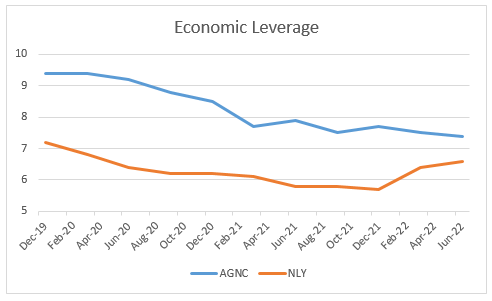
Two, AGNC has tended to run at a higher leverage level which has created a larger book value headwind given the unfavorable agency MBS environment in 2020 as well in 2022.
Systematic Income
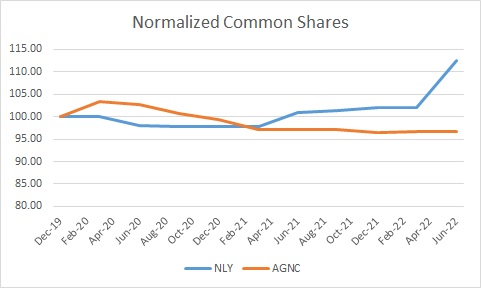
Three, NLY has tended to be more proactive in issuing common shares. Common share issuance supports equity / preferred coverage by injecting additional equity. In fact, NLY has just announced a 100m common share offering which illustrates this trend and will lift its equity / preferred coverage.
Systematic Income
The currently stronger credit profile of NLY as well as these more favorable trends tells us that NLY offers a lower-risk holding for preferreds shareholders than AGNC all else equal.
A Look at the Preferreds
In this section we discuss some of the key differences between the preferreds of these two companies as well as their relative pricing. We also highlight which ones make more sense as holdings for investors with specific views over how the market will develop over the medium term.
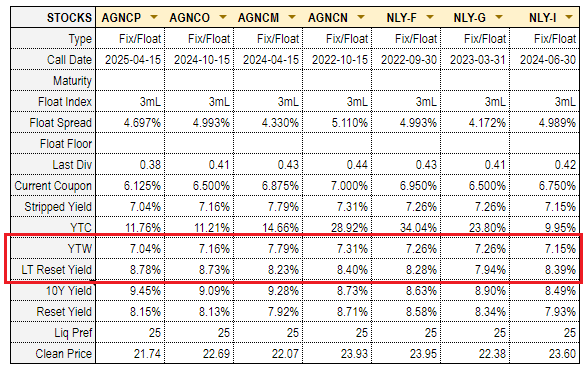
The first thing to say is that there are 4 AGNC preferreds and 3 NLY preferreds as shown in the table below. All 7 preferreds are Fix/Float Libor preferreds. Two of the preferreds will switch to Libor-based floating-rate coupons this year, one will switch in 2023 and the rest in 2024/2025.
As many preferreds investors know full well gauging relative value in the preferreds space is challenging because of different coupon types (i.e. Fixed-rate vs Fix/Float and spread over Libor for Libor-based Fix/Float preferreds) and different first call dates. To make things simpler we like to focus on the Yield-to-Worst or YTW which is the yield of the stock prior to its first call date (in effect, today’s stripped yield) and the LT (long-term) Reset Yield which is the yield of the stock at the long-term expectation of Libor. LT Reset Yield is helpful because it provides an apples-to-apples yield comparison of floating-rate preferreds because it’s done at the same level of Libor. Both of these yields are highlighted in the table below which is an extract from our service Preferreds Tool.
Systematic Income Preferreds Tool
Although all 7 preferreds are Fix/Float in our view it makes sense to separate them into near-term reset preferreds and the rest. The near-term reset preferreds are the (AGNCN) and (NLY.PF) which will reset (i.e. switch to a Libor-based floating-rate coupon) in October and September of this year. Based on expected Libor on these reset dates AGNCN will have a stripped yield of around 8.71% and NLY.PF a stripped yield of 8.58% on their respective first call dates. These estimated stripped yields on the first call date we call reset yields and they are shown in the table above. They are estimated because they are based on Libor forwards i.e. market consensus of what Libor will be on a given date in the future.
What is important to note here is that the reset yields of these two securities are expected to be well above their current stripped yield i.e. their yields will step up significantly – by 1.4% for AGNCN (i.e. 8.71% reset yield – 7.31% stripped yield) and by 1.3% for NLY.PF.
These two preferreds can be attractive for those investors who want to benefit as soon as possible from the recent rise in short-term rates. They are also attractive, in our view, for more tactically oriented investors as we expect both securities to get bid up somewhat because they will feature much higher stripped yields than those securities that have not yet switched to floating-rate coupons and will only do so in the future. Our view here is supported by the fact that both securities have recently begun to outperform their later reset counterparts as the first call date has neared.
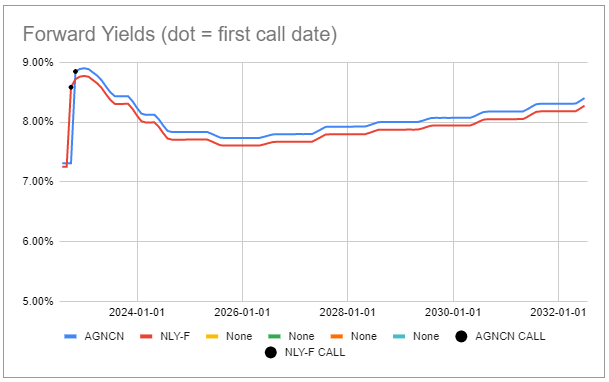
Until very recently these two preferreds traded right in line with each other in yield terms. More recently AGNCN has pulled away a little bit (i.e. it has underperformed in price terms) and now offers a slightly higher yield than NLY.PF after it floats by 0.12%. The chart below shows the forward-yield profile of the two stocks based on the expected path of Libor. While absolute yields may differ from these market estimates, AGNCN will have a higher level than NLY.PF when both have floating-rate coupons in October. In our view, the stronger fundamental credit profile of NLY.PF is worth giving up 0.12% and we prefer NLY.PF between these two securities.
Systematic Income Preferreds Tool
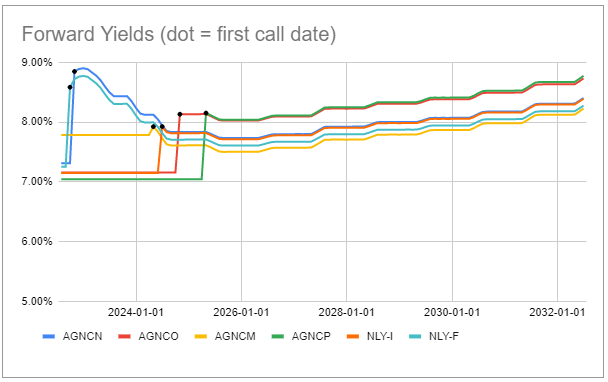
For investors with a longer-term horizon we present the following chart which shows the remaining 5 preferreds along with AGNCN for reference. What we see here is that (AGNCO) (red line below) is expected to share the highest yield profile across all 7 securities with (AGNCP) and it beats AGNCP in having a higher yield leading up to the first call date (i.e. when it floats). Although AGNCO has a comparatively high yield after its call date this comes at the cost of having a very low yield leading up to its first call date. However, investors with a longer-term horizon will more than make up for its low yield leading up to its first call date after the stock floats in 2024. In other words, over time AGNCO will deliver the highest yield in this group of preferreds, barring an unexpected redemption. In the case of these longer-term reset preferreds, we like AGNCO as the yield differential to NLY preferreds is much larger – on the order of 0.4%.
Systematic Income Preferreds Tool
Takeaways
The agency-focused suite of preferreds from AGNC and NLY has a lot to offer investors. Despite a terrible period for agency MBS performance, the equity coverage of both sets of preferreds remains fairly high. We expect the rest of the year and beyond to be a much better environment for agencies given their current cheapness which provides a high margin of safety as well as higher net income levels which will accrue to book value.
For investors looking to benefit from the recent spike in short-term rates we continue to like NLY.PF which will float in about two months and see its stripped yield jump to 8.6% from 7.2%. At that point it should find favor with yield-seeking investors, leading to further potential gains.
For investors happy to play the long game we like AGNCO which will boast the highest stripped yield once all of the 7 preferreds float. This means that over time it will outearn the entire suite though it will take a few years. The yield differential AGNCO offers relative to NLY preferreds over the longer term of around 0.4% is sufficient to compensate for its slightly worse risk profile in our view.
Be the first to comment