

Key Talking Points:
- Equities continue to struggle as bond yields focus on Central Bank policy actions
- DAX 30 finds support in long-term ascending trendline

Recommended by Daniela Sabin Hathorn
Get Your Free Equities Forecast
The DAX 30 regained some positive momentum last week and is now trading again in a tight range near the all-time highs as Friday’s push higher wasn’t enough to break above 14,140. Investors continue to be focused on the bond market as yields steepen their rise, with the US 10-year now topping at 1.601%, its highest level since February 2020.
German and US 10Y Yield Chart (Jun 2020 – Mar 2021)
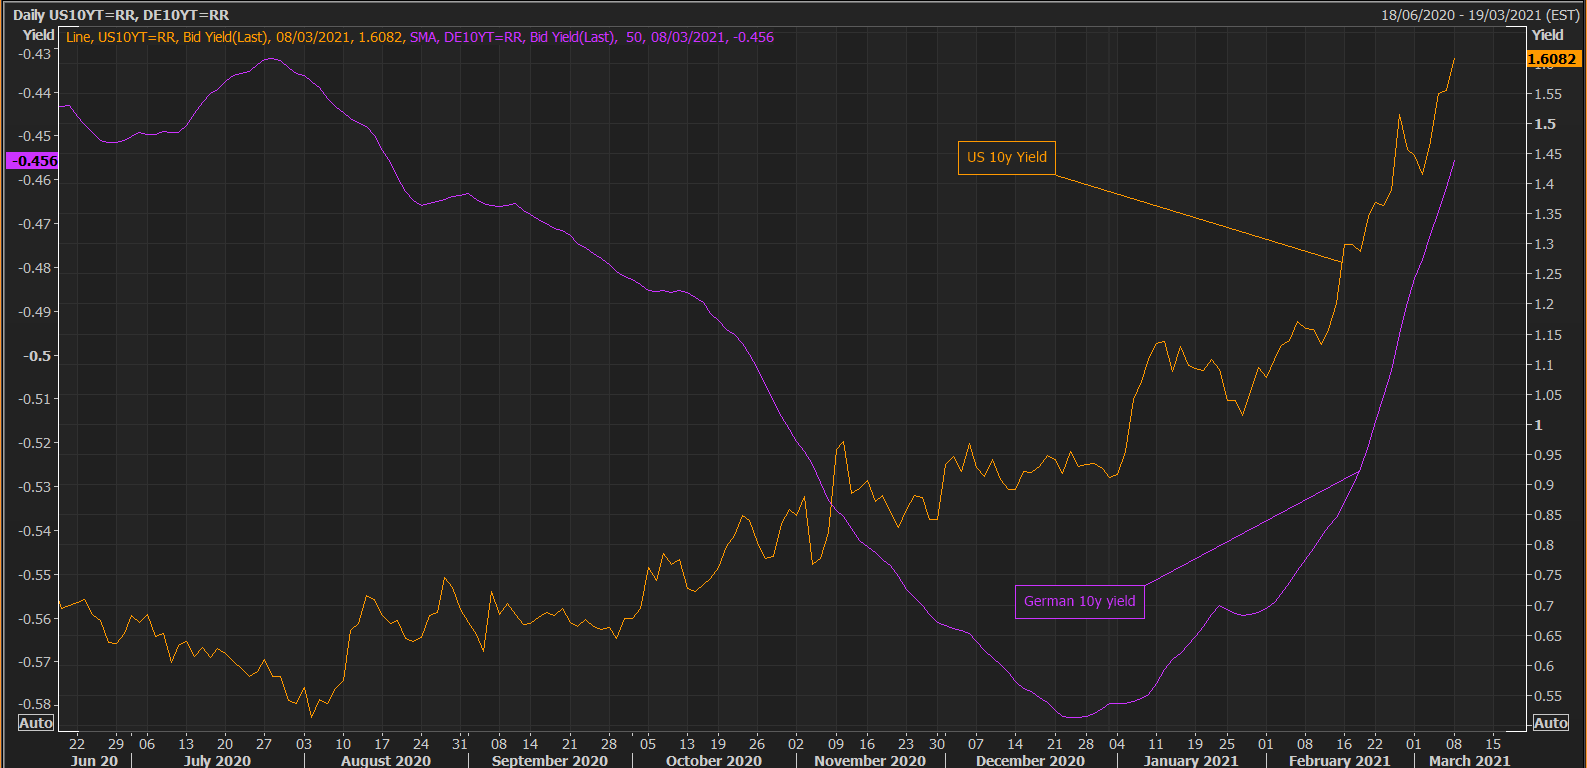
European bonds have also been following suit, with the German 10-year yield back up at -0.45 after reaching a low of -0.58 back in December. Of increased importance this week will be the bond purchase information released by the many central banks, with the ECB release scheduled for today following on from a slowing in purchases in the previous week.
An increase in bond purchases would likely ease investor concerns in the short-term as central banks would be taking action to control the yield curve, but given Jerome Powell’s recent remarks, we might continue to see bond purchases slow this week, pushing yields higher and putting greater pressure on stocks.
DAX 30 Levels
Zooming out on the daily chart we can see how the current price is finding support on a long-term ascending trendline from the March 2020 lows, pointing towards the 13,845 as the immediate support. A break below this area puts the bullish bias at risk, with long-term support expected to hold at 13,400 before a wider correction takes place.
DAX 30 Daily chart

Momentum indicators are showing a neutral stance with bullish bias with the stochastic hovering above the 50 line and the MACD trying to push into positive territory. If we continue seeing the price bounce off the ascending trendline, bullish momentum could build up in a new attempt to break the all-time highs around the 14,140 line.
| Change in | Longs | Shorts | OI |
| Daily | 51% | 23% | 31% |
| Weekly | -32% | 12% | -7% |
Learn more about the stock market basics here or download our free trading guides.
— Written by Daniela Sabin Hathorn, Market Analyst
Follow Daniela on Twitter @HathornSabin
Be the first to comment