

tupungato
Introduction
We review Lloyds Banking Group PLC (NYSE:LYG) after shares again approached their 52-week low this month (July).
We last published research on Lloyds in February 2020, having originally initiated a Buy rating on the stock in April 2019. Compared to the level at our initiation, Lloyds shares have lost 32% (in GBP, after dividends), and are down 27% from their recent peak in January 2022:
|
Lloyds Share Price (Last 5 Years)  Source: Google Finance (14-Jul-22). |
Lloyds’ earnings and valuation have turned out worse than we anticipate, partly due to COVID-19. At our initiation, Lloyds had a mid-teens Return on Tangible Equity (“ROTE”) and was valued at a Price/Tangible Book Value (“P/TBV”) of 1.2x; it is now expected to have a >11% ROTE in 2022 and is valued at a P/TBV of 0.7x:
|
Lloyds Comparison – Current vs. Initiation 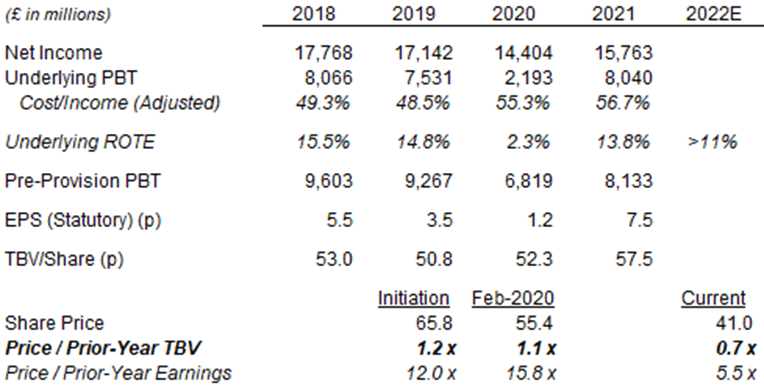 Source: Lloyds company filings. NB. 2021 ROTE benefited from a tax credit; excluding this, ROTE was 11.4%. 2022 ROTE based on guidance and includes moving Restructuring costs “above the line”. |
We believe Lloyds shares now offer a mid-teens annualized return on undemanding assumptions. A ROTE of 8.5% should be sustainable, with tailwinds from rising interest rates and limited credit losses. This should support the current 4.9% Dividend Yield and an upward re-rating from 0.7x to 0.85x P/TBV. Buybacks should help TBV/Share and EPS growth by reducing the share count by an average 4% annually in 2022-25. The upside would be significantly larger if management’s new target of a >12% ROTE after 2025 were to be met, but this is not in our base case
Lloyds Business Overview
Lloyds is the #1 retail bank in the U.K., largely focused on the domestic market, and offering a wide range of products and services to consumers, SMEs as well as corporates and institutions.
Retail Banking has historically contributed nearly two-thirds of Lloyds’ income and profits, and Net Interest Income (“NII”) represented more than two thirds of income in 2021:
|
Lloyds Key Financials by Segment (2021) 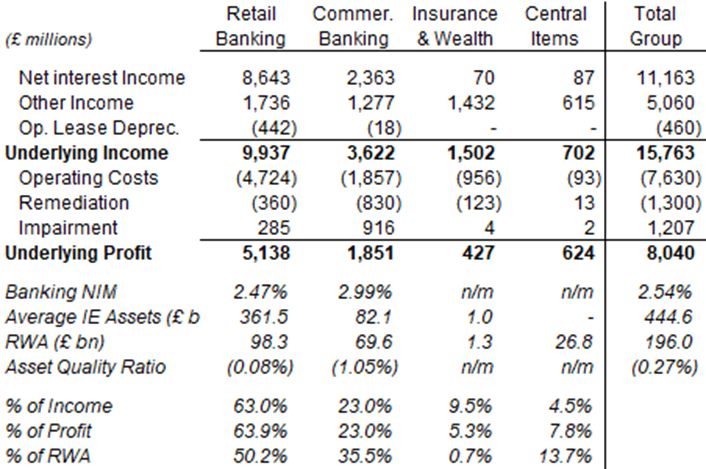 Source: Lloyds results release (2021). NB. Retail Banking and Commercial Banking will each be split into two units in 2022. |
The Insurance & Wealth segment includes Schroders Personal Wealth, a financial planning joint venture with Schroders (OTCPK:SHNWF) formed in 2019, in which Lloyds owns 50.1%.
The current CEO Charlie Nunn took over in August 2021, joining from HSBC (HSBC).
Lloyds Strengths & Weaknesses
Lloyds has the typical strengths of a market-leading retail bank, especially economies of scale and customer loyalty, These give it a large low-cost deposit base and low incremental unit costs, allowing it to provide financial products at competitive prices and superior profit margins relative to peers.
Its weaknesses stem from its narrow franchise, especially when compared to U.S. universal banks like Bank of America (BAC) and JPMorgan (JPM). It lacks wholesale capabilities such as wealth management and capital markets, which means it is much more reliant on lending and has few offsets in a low-rate environment.
U.K. Mortgages represented 61% of Lloyds’ total gross lending at 2021 year-end. This was 3% higher than pre-COVID 2019, after significant declines in balances in Corporate & Other Commercial and Credit Cards:
|
Lloyds Gross Lending By Category (2019-2021) 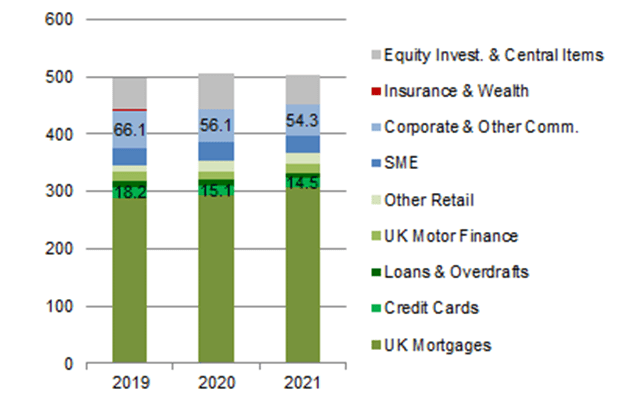 Source: Lloyds annual reports. |
Lloyds has also generated significant income from a “structural hedge” that profits from the rate differential between short-term customer deposits on its balance sheet and longer-term rates offered by markets. In 2021, this generated £2.2bn of gross income and had a nominal balance of £240bn at year-end. The income has been in decline since 2019 even as the nominal balance kept expanding, as maturing balances were replaced with new balances at lower rates.
|
Lloyds Structural Hedge (2017-2021)  Source: Lloyds results releases. |
For context, the Bank of England’s base rate is the most relevant to Lloyds. After being cut to 25 bps in August 2016 (after the Brexit referendum), it had been raised to 75 bps by early 2020, cut to 25 bps again during the COVID-19 pandemic, and has been raised several times during 2022 to a current 1.25%:
|
Bank of England Base Rate (Last 10 Years)  Source: Bank of England website (14-Jul-22). |
Higher interest rates generally help Lloyds’ Net Interest Margin (“NIM”), as rates on its assets typically rise in line with rate hikes, while rates on liabilities typically rise at only 0.5x of rate hikes. However, the multi-year duration of much of its asset base means that the impact of any rate changes takes time to fully materialize.
Lloyds’ ROTE Historically Exceeded 10%
The central assumption in our investment case is Lloyds will be able to sustain a ROTE of 8.5% on average over time.
Lloyds had achieved a much higher ROTE for most of the past decade. ROTE averaged 14% during 2014-19, and averaged 8.0% across 2020-21 as credit reserves were first increased due to COVID-19 and then released:
|
Lloyds Underlying ROTE (2014-26E) 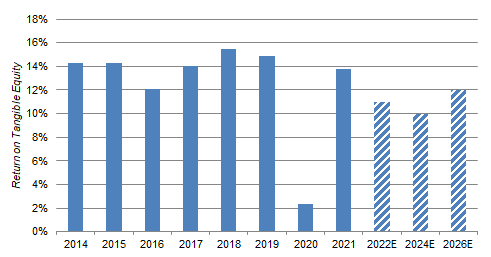 Source: Lloyds annual reports. NB. 2022-26E figures show are minimums (e.g., actual 2022 guidance is >11%). All figures include Other Conduct and Remediation costs. Restructuring costs will be included in ROTE from 2022. |
Looking ahead, ROTE is guided to exceed 11% in 2022, and targeted to exceed 10% from 2024 and to exceed 12% from 2026 (we discuss these in more detail later in the article).
Restructuring costs were not deducted for ROTE calculations before 2022, but ROTE would still have comfortably exceeded 10% for much of the past decade even if these were included. (Restructuring costs averaged £651m in 2014-21, which represents a 1.7 ppt difference over average year-end Tangible Equity of £38.3bn over the same period.)
Because credit reserve provisions are volatile and can distort ROTE in individual years, we show the Pre-Provision Profit Before Tax (“Pre-Provision PBT”) for the same period below. Group Pre-Provision PBT had been stable to growing in most years before COVID-19, fell to £6.44bn in 2020 and has already rebounded to £6.83bn in 2021:
|
Lloyds Pre-Provision PBT (2014-21) 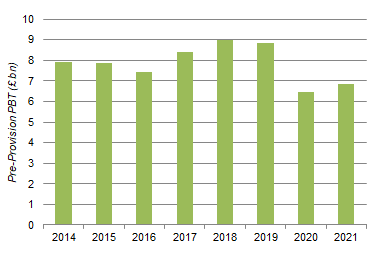 Source: Lloyds annual reports. |
ROTE of 13.8% in 2021 was elevated due to one-off tax credit (worth 2.4 ppt) and reserve releases, but it would still be at 10.6% if we assume a typical Impairment figure (£1.3bn or 29 bps, in line with 2019) and a higher corporate tax rate (25%, due to be implemented in FY24, compared to 19% at present) (on a £38.9bn average Tangible Equity base).
Lloyd’s current valuation implies the market expects a significant permanent deterioration in Pre-provision PBT or credit losses, which we do not believe is likely.
Lloyds Pre-Provision PBT by Segment
Lloyds’ overall Pre-Provision PBT has been relatively stable, with structural challenges in some businesses offset by strong businesses in Retail Banking, and the latter are now also benefiting from rising interest rates.
Pre-Provision PBT for each segment since 2017 is shown below:
|
Lloyds Pre-Provision PBT By Segment (2014-21)  Source: Lloyds annual reports. |
(We have shown restated figures separately in 2019, as there was a restatement related to the change of internal funding charges from LIBOR to SONIA that moved a significant amount of profit from Central Items to Retail Banking. Other restatements tend to be insignificant.)
Retail Banking’s Pre-Provision PBT had been in decline in 2018-20, but at least some of the drivers behind these were one-off or now reversing. Falling margin in U.K. Mortgages, when maturing mortgages are replaced by lower-margin new business, has been the main factor; more recently, the mix has also shifted away from higher-margin Credit Cards (down 20% in 2019-2021) and Motor Finance (down 10% in 2019-21).
Rising interest rates should help stabilize margin in mortgages eventually, though this depends on supply/demand and has not yet happened. Completion margin actually rose to 190 bps in Q4 2020, exceeding back book margins (150 bps at the time), thanks to higher homebuying demand from work-from-home movers and temporary stamp duty relief. However, it fell back to 115 bps by Q4 2021 and stood at just 85 bps in Q1 2022. The declines in Credit Cards and Motor Finance balances have been largely a result of the pandemic – Credit Cards balance rose 4% year-on-year in Q1 2022, and Motor Finance balance should grow again once supply chain issues among automakers have been solved.
Commercial Banking Pre-Provision PBT has been in consistent decline through 2017-21. The decline in 2017-19 was largely due to a fall in non-interest income, attributed to lower client activity and Lloyds reducing low-returning client relationships; the decline in 2019-21 also included a decline in Net Interest Income after Average Interest-Earning Assets fell 10.7% over two years. We believe much of this segment is likely uncompetitive among corporate and institutional clients who have access to the same products from larger international banks.
Insurance & Wealth Pre-Provision PBT has also been in consistent decline since 2018, once we adjust out the one-off impact of changes in insurance assumptions and methodology (which benefited 2019 significantly). Lines such as Longstanding LP&I and Wealth have been in decline through 2017-21, while others like General Insurance peaked in 2019 and have been falling since 2019. We suspect many of these businesses are not competitive against smaller and/or more specialized players, and some like bulk annuities may have been in structural decline.
|
Lloyds Insurance & Wealth Net Income (2017-21) 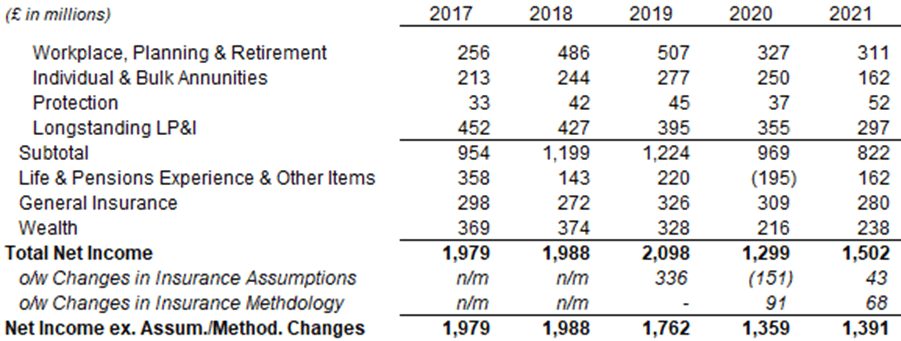 Source: Lloyds results releases. NB. 2019 Wealth Income includes £70m from business transferred to Schroders Personal Wealth in Oct-19. |
While Commercial Banking and Insurance & Wealth have structural challenges, they have become much less important to group earnings over time, falling from 38% of group Pre-Provision PBT in 2017 to 20% in 2021. Their ongoing weakness should be more than offset by strength in Retail Banking, especially with interest rate increases.
Lloyds’ Tailwind From Interest Rates
Lloyds’ income should benefit significantly from rising interest rates. As of 2021 year-end, each 25 bps parallel upward shift in yield curve would be worth approximately £200m of NII in year 1 and £400m by year 3:
|
Lloyds NII Sensitivity to Rates (at 2021 Year-End) 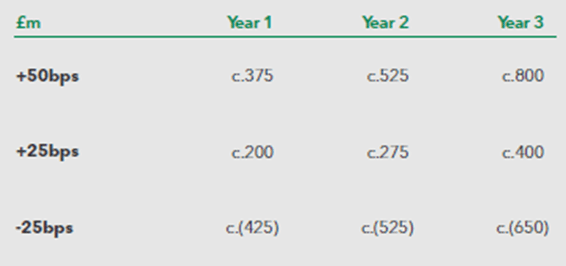 Source: Lloyds results presentation (Q4 2021). |
The £400m benefit would be worth 75 bps in ROTE, based on a £40bn Tangible Equity and a 25% corporate tax rate).
Lloyds’ NIM contracted significantly with the pandemic, due to both lower interest rates and a mix shift away from high-margin areas such as Credit Cards and Motor Finance, Pre-COVID, it continued rising until 2018 and only declined slightly in 2019, as Lloyds kept its loan book flattish in size and optimized the NIM within this size:
|
Lloyds Loan Book & NIM (2014-2022E) 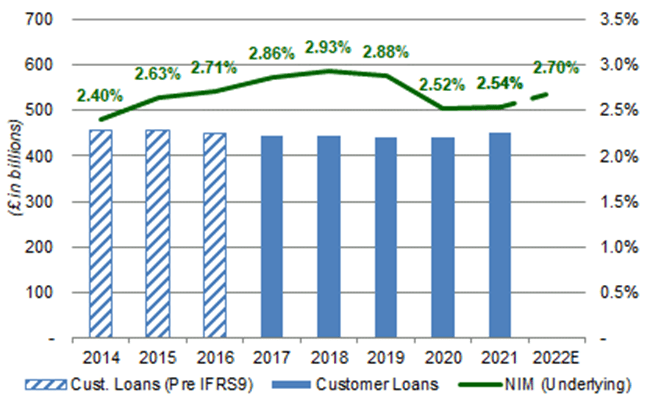 Source: Lloyds company reports. NB. Pre-IFRS9, customer loans were £456bn at 2017 year-end. |
NIM is guided to exceed 2.70% in 2022, and was already 2.68% in Q1 (up 19 bps year-on-year).
We expect rising NIM on a relatively flat loan book and stable non-interest revenues to help keep Lloyds’ Pre-Provision PBT at stable to growing in the next few years. (2021 Pre-Provision PBT already implied a 10.6% ROTE on normalized credit losses, as described above.)
Lloyds’ Credit Losses Should Be Limited
Lloyds’ credit losses should be limited even in the event of an economic downturn.
Lloyds has historically focused on the prime+ part of the market, avoiding subprime and new prime consumers. In U.K. Mortgages, which represented 63.5% of its Gross Lending at 2021 year-end, Loan-To-Value (“LTV”) averaged 42.1% for the entire portfolio and 63.3% for new business. As described above, Lloyds was profitable even in the pandemic year of 2020, when Impairment was £4.25bn, equivalent to 0.6x of its Pre-Provision PBT that year. The 2020 Impairment included a £2.23bn macro-driven reserve build, most (£1.70bn) of which was released as a benefit to the P&L in 2021.
In the event of a prolonged economic downturn, we expect most of the damage to Lloyds to occur in year 1 in the form of a substantial reserve build (similar to that in 2020), but only limited further reserve builds, and thus a solid ROTE in subsequent years.
Lloyds Q1 Results 2021 Outlook
Lloyds is expecting a ROTE exceeding 11% in 2022, ahead of our 8.5% long-term assumption.
ROTE was already 10.8% in Q1 2022, after a 16 bps Asset Quality Ratio (slightly better than cyclical average). Pre-Provision PBT was up 26.0% year-on-year, driven by a 12.2% recovery in Net Income, with costs growing by only 2.6%. Compared to Q1 2019, Net Income was still 7.0% lower and Pre-Provision PBT was 16% lower:
|
Lloyds Key Financials (Q1 2022 vs. Prior Years) 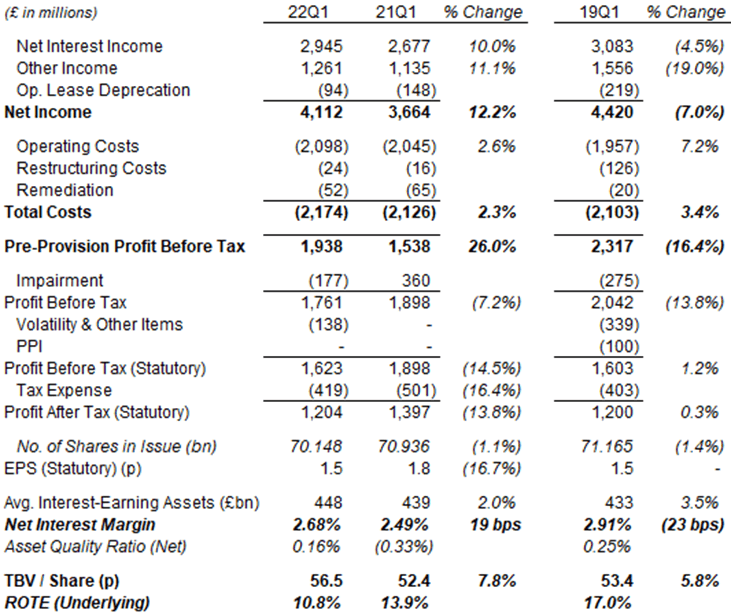 Source: Lloyds annual reports. |
With strong Q1 2022 results, management increased their 2022 outlook to include a NIM exceeding 270 bps (was “exceeding 260 bps”) and a ROTE exceeding 11% (was “around 10%”):
|
Lloyds 2022 Outlook (Updated) 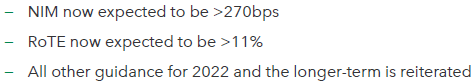 Source: Lloyds results presentation (Q1 2022). |
The 2022 outlook forms part of a medium plan that targets ROTE exceeding 10% by 2024 and exceeding 12% by 2026.
Targeting >12% ROTE By 2026
At Q4 2021 results in February, Lloyds announced their new strategy and targets for the medium-term.
Management expects to deliver a ROTE exceeding 10% by 2024 and one exceeding 12% by 2025. The center piece of this are new strategic initiatives that will deliver £0.7bn of incremental revenues by 2024 and £1.5bn by 2026. Rate increases and existing franchise growth are also expected to help, though mortgage margin pressures will remain a headwind. “Business As Usual” costs are expected to rise to £8.8bn in 2022 but to remain at that level through 2022-24, augmented by some temporary cost investments. Cost/Income Ratio is expected to fall below 50% by 2026:
|
Lloyds Medium-Term Targets  Source: Lloyds results presentation (Q4 2021 NB. Annotations by Librarian Capital. |
As part of its new strategy, Lloyds also announced their 5 strategic pillars:
- Deepen and innovate in consumer relationships
- Innovate and broaden intermediary propositions
- Great a new mass affluent investment offering
- Digital and diversify the SME business
- Targeted expansion in Corporate & Institutional offerings
We are cautious about the new strategy, as they mostly seem to involve merely doing the same things as before but better (with the exception of the new investment offering). This is especially relevant as the new management team lacks a track record in operational excellence: CEO Charlie Nunn spent most of his career as a management consultant, except nine years at HSBC, a bank which has few strengths beyond a highly profitable local monopoly in Hong Kong dating back to British colonial rule. CFO William Chalmers spent 25 years as an investment banker advising financial institutions, but had no operational experience until he took up his role in 2019. Lloyds also lost two senior executives recently, Stephan Noakes, Transformation Director, and Vim Maru, Group Retail Bank Director.
Our base case assumes only an 8.5% ROTE. Should Lloyds manage to reach its targets, it would create a significant upside in the shares far ahead of our base case.
Lloyds Dividend Yield & Valuation
At 41.02p, Lloyds shares are trading at:
- 0.7x P/TBV, relative to Q1 2022 TBV of 56.5p per share
- 6.6x P/E, relative to guided 2022 ROTE of >11% (which implies an EPS of 6.2p)
- 4.9% Dividend Yield, relative to 2022 total dividend of 2.0p
Lloyds has a “progressive and sustainable” dividend policy, which means dividends should grow over time but remain a fraction of what management views as sustainable EPS. Share buybacks have been a regular part of Lloyds’ capital allocation, with £2.0bn of buybacks (equivalent to 6.8% of the current market capitalization) announced in February and expected to be completed by the end of 2022.
However, capital distributions will be limited by Lloyds’ pension deficit, which stood at approx. £5bn at 2021 year-end. Management had agreed in February 2021 to contribute annually to the pension scheme a sum of £800m plus 30% of in-year shareholder distributions (dividends and buybacks) until the pension deficit is closed. (The actual deficit was £7.3bn at 2019 year-end.) On our forecasts, these payments will continue until the end of 2025.
Lloyds Return Forecasts
The key assumptions in our Lloyds forecasts include:
- ROTE to be 11.0% in 2022 and 8.5% thereafter
- Dividends, buybacks and pension contributions to be 94.5% of Net Income
- Dividend Per Share to grow 2.0% annually
- Pension contributions to be £800m plus 30% of dividends and buybacks
- Buybacks to be conducted at 0.8x P/TBV
- P/E to be 10x at 2025 year-end
Our forecasts show a 2025 TBV/Share of 67.08p and an EPS of 5.68p:
|
Lloyds Illustrative Return Forecasts  Source: Librarian Capital estimates. |
With stock at 41.92p, we expect a total return of 52% (13.7% annualized) by 2025 year-end.
Is Lloyds Stock A Buy? Conclusion
We reiterate our Buy rating on Lloyds Bank PLC stock.
Be the first to comment