

Matteo Colombo/DigitalVision via Getty Images
Are you a value-oriented income investor or a growth-oriented income investor? Maybe you’re a bit of both, like many income investors, looking for attractive income vehicles in a variety of styles. Some CEFs that we’ve covered in our articles can help you diversify your portfolio.
Liberty All-Star Equity Fund (USA) is a core equity fund which takes a multi-pronged approach to its investments, using 3 value portfolio managers and 2 growth managers with expertise in different slices of the market:
USA site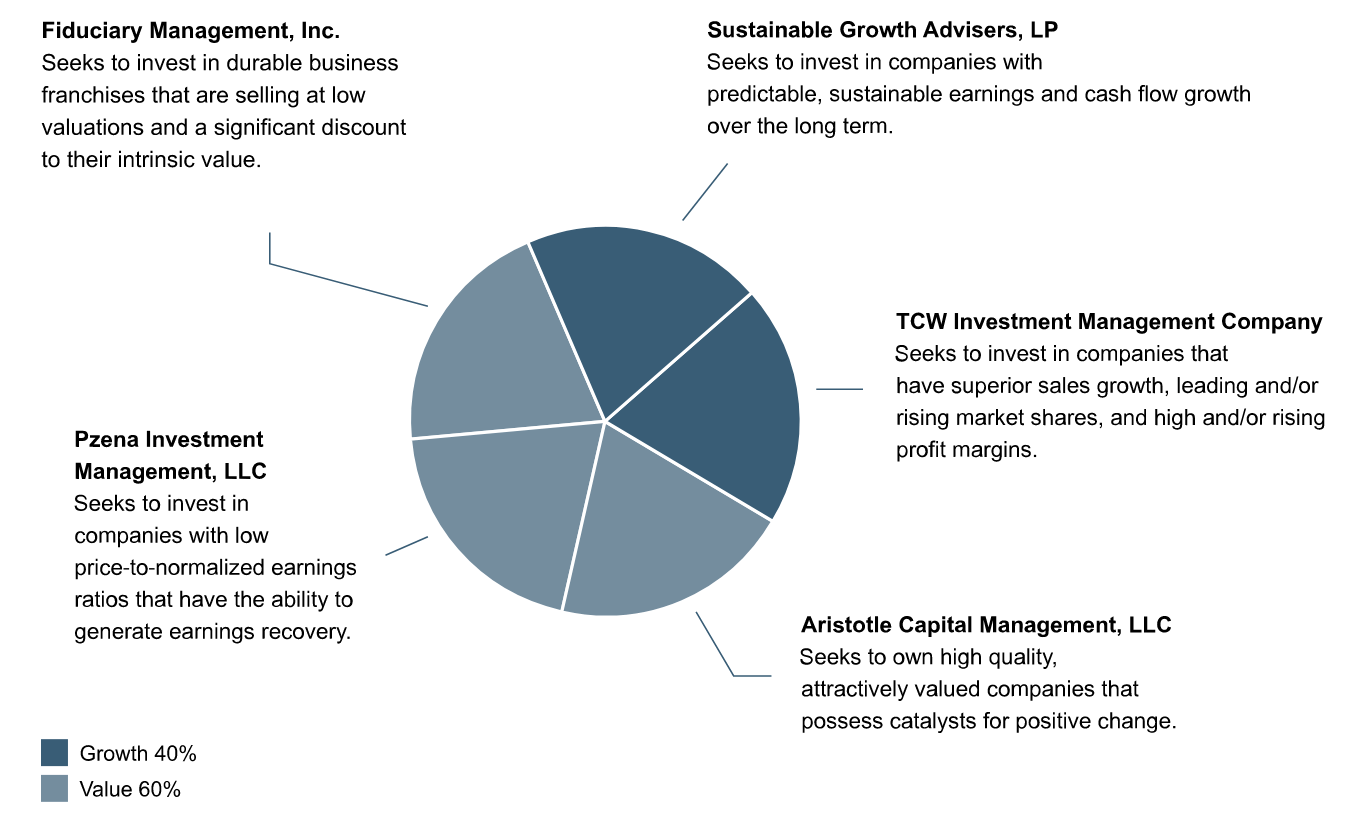
USA’s sister fund, Liberty All-Star Growth Fund (ASG), which is also a closed-end fund, specializes in growth equities, utilizing 3 managers, each focusing on different market cap sizes:
ASG site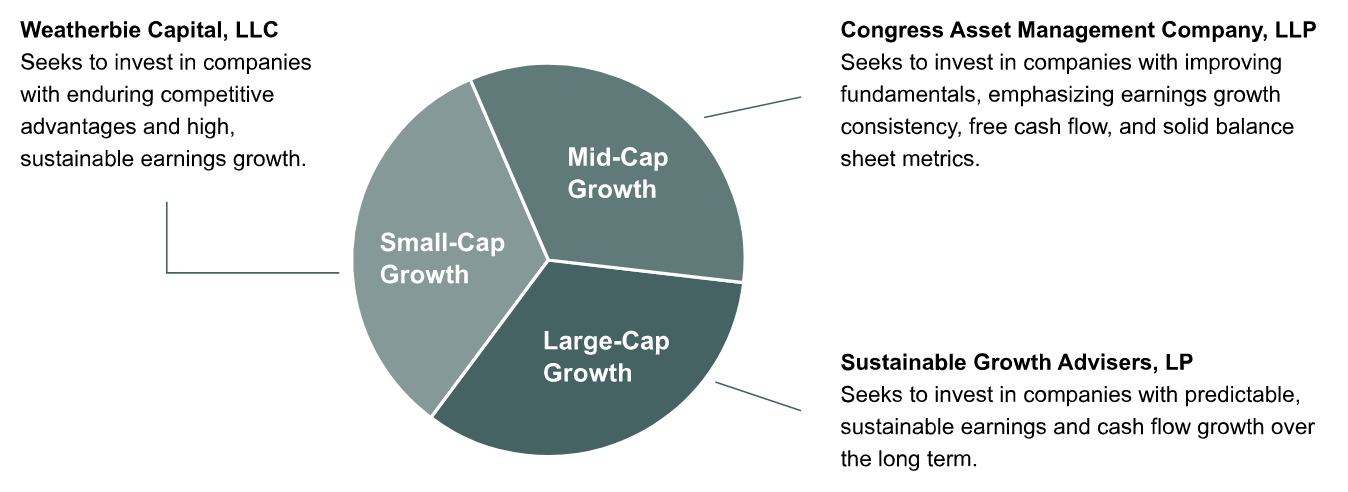
USA is much larger than ASG, with over 4X the amount of assets, at $1.9B, vs. $463M for ASG; and much higher daily volume of 1.36M, vs. 343K for ASG. USA also has 154 holdings, vs. 119 for ASG. Both funds were established in 1986
Hidden Dividend Stocks Plus
Dividends:
Both funds pay quarterly distributions, and have attractive yields.
USA’s policy is to “pay distributions on its shares totaling approximately 10% of its net asset value per year, payable in four quarterly installments of 2.5% of the Fund’s net asset value at the close of the New York Stock Exchange on the Friday prior to each quarterly declaration date. Sources of distributions to shareholders may include ordinary dividends, long-term capital gains and return of capital.” (USA site)
ASG’s distribution policy has the same structure, but is based upon 8% of its net asset value per year, payable in four quarterly installments of 2%.
At their closing 2/18/22 prices, USA yields 10.93%, and ASG yields 8.92%, based upon their most recent distributions. They should go ex-dividend next in April 2022. USA has a 13% 5-year dividend growth rate, while ASG’s is much higher, at 25%:
Hidden Dividend Stocks Plus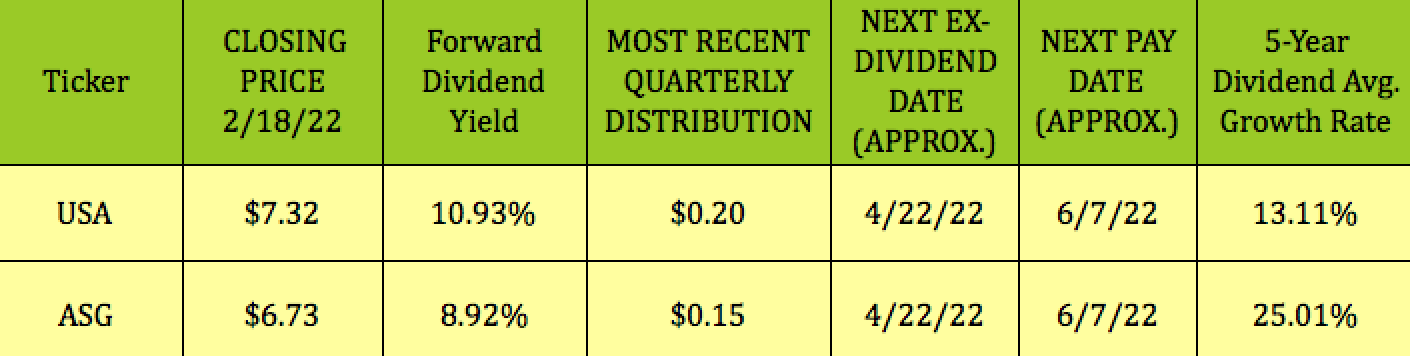
Since they’re based upon a % of NAV, the quarterly payouts can vary a bit for both funds, as you’ll see below.
Taxes:
USA’s 2021 regular quarterly distributions ranged from $.19 to $.21, and were comprised of 68% long term capital gains, 12% Qualified and Non-Qualified Ordinary Dividends, and ~7% Return of Capital.
USA site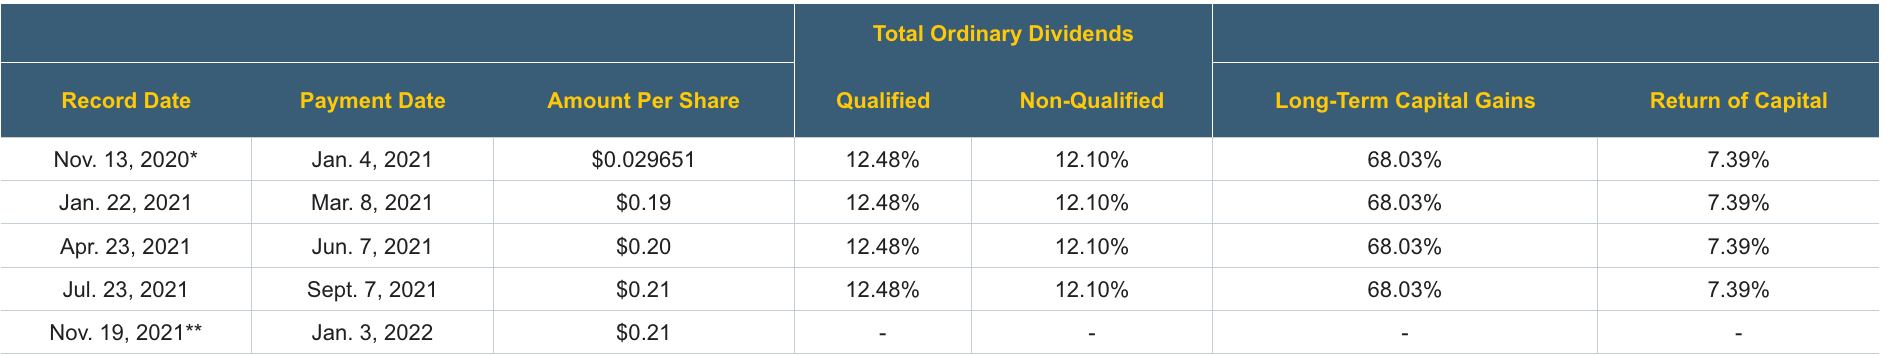
ASG’s 2021 quarterly distributions ranged from $.16 to $.17, plus a $.52 payout, and were comprised of 49% Non-Qualified Ordinary Dividends, 48% Long Term Capital Gains, and ~3% Qualified Dividends:
ASG site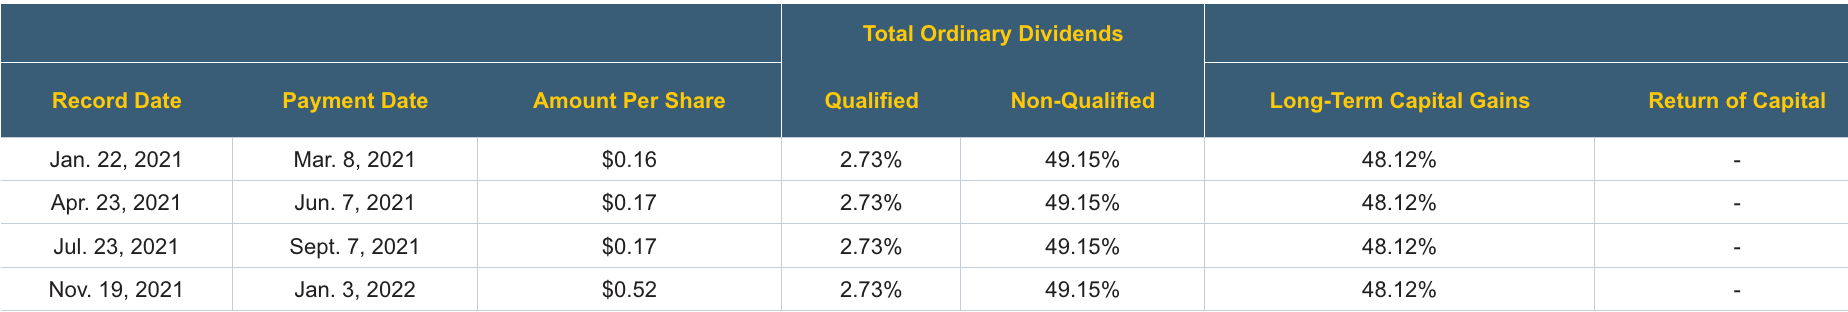
Holdings:
USA’s top sector %s were relatively steady between 10/31/21 and 1/31/22, with Tech moving down slightly from 22.1% to 21.3%, Financials at 17.6%, Consumer Discretionary at 13.6%, and Healthcare dropping from 14.4% to 13.6%.
USA site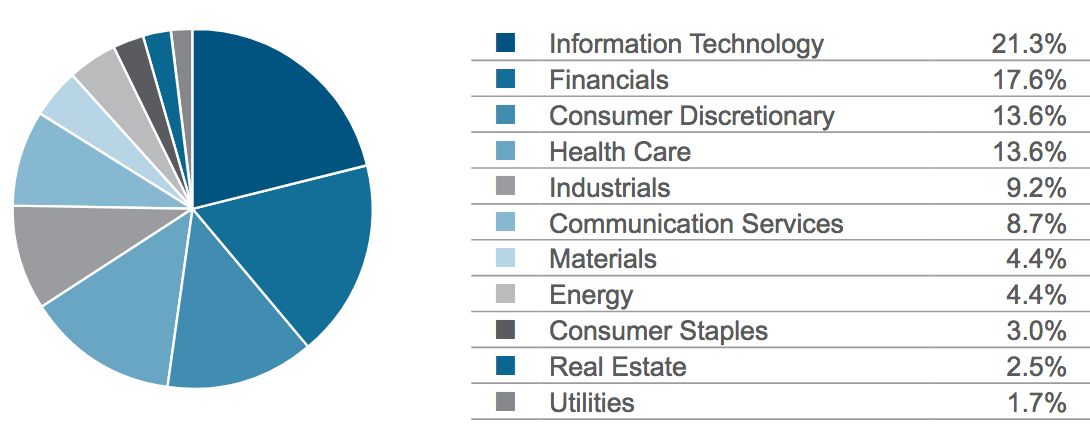
ASG’s heavier Tech weighting dropped from 31.2% to 29.2%; Healthcare dropped from 21.3% to 20.7%; Consumer Discretionary dropped from 13% to 12.4%; and Industrials rising from 12.4% to 12.9%:
ASG site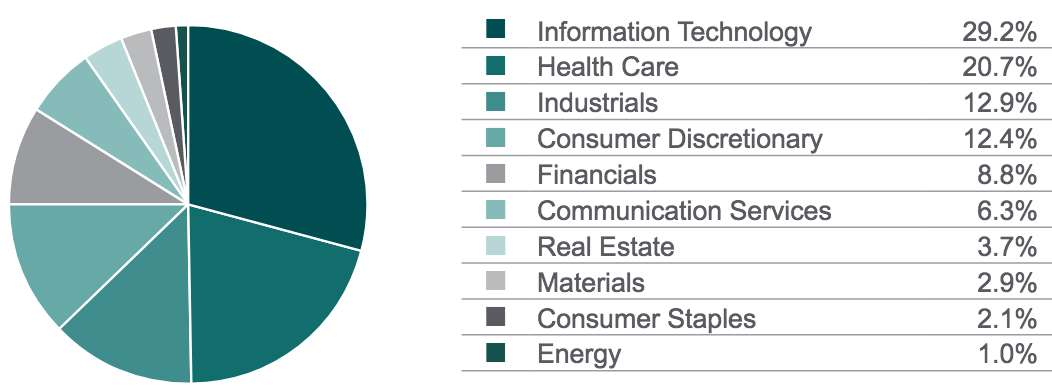
USA’s top 10 holdings, (as of 1/31/22), include large cap, well-known names, and make up ~19% of its portfolio, with slightly higher weightings in Visa (NYSE:V), and UnitedHealth (NYSE:UNH), and Sony (NYSE:SONY) now part of its top 10.
USA site
In ASG’s top 10 holdings, its former #1 holding, Paylocity (NASDAQ:PCTY), dropped off the list, as did Natera (NASDAQ:NTRA) and Progyny (NASDAQ:PGNY), with Hamilton Lane (NASDAQ:HLNE) and Ball (NYSE:BLL) now part of the top group.
ASG site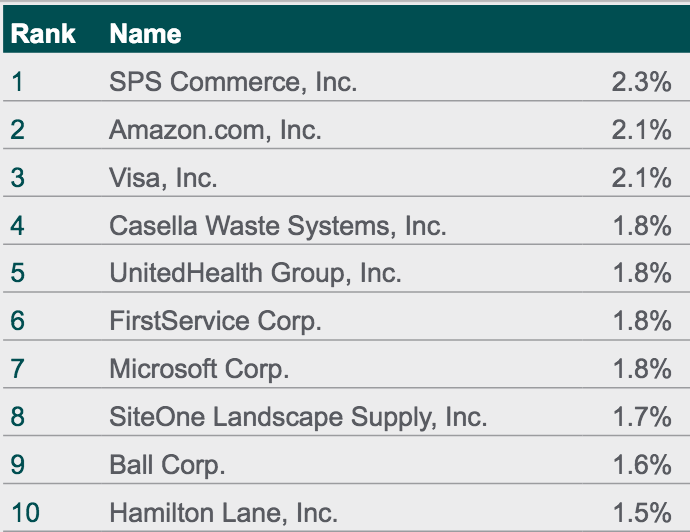
Pricing:
At its 2/18/22 $7.32 closing price, USA was 0.68% below its 2/17/22 NAV/Share of $7.37, cheaper than its average 3.92% premium to NAV, but not as deep a discount as its 3- and 5-year discounts.
ASG has a -1.90% discount to its 2/17/21 NAV/Share of $6.86, which is cheaper than its 1-, 3- and 5-year premiums.
Hidden Dividend Stocks Plus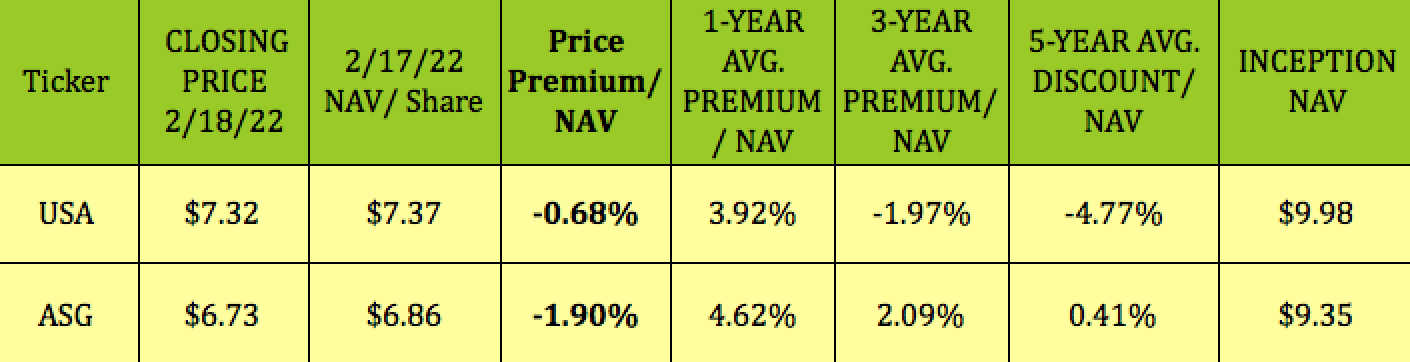
Performance:
USA mostly outperformed the Morningstar US CEF US Equity category on a Price and NAV basis in 2019-2021, but has also gone south in 2022, as it did in 2018.
CEF Connect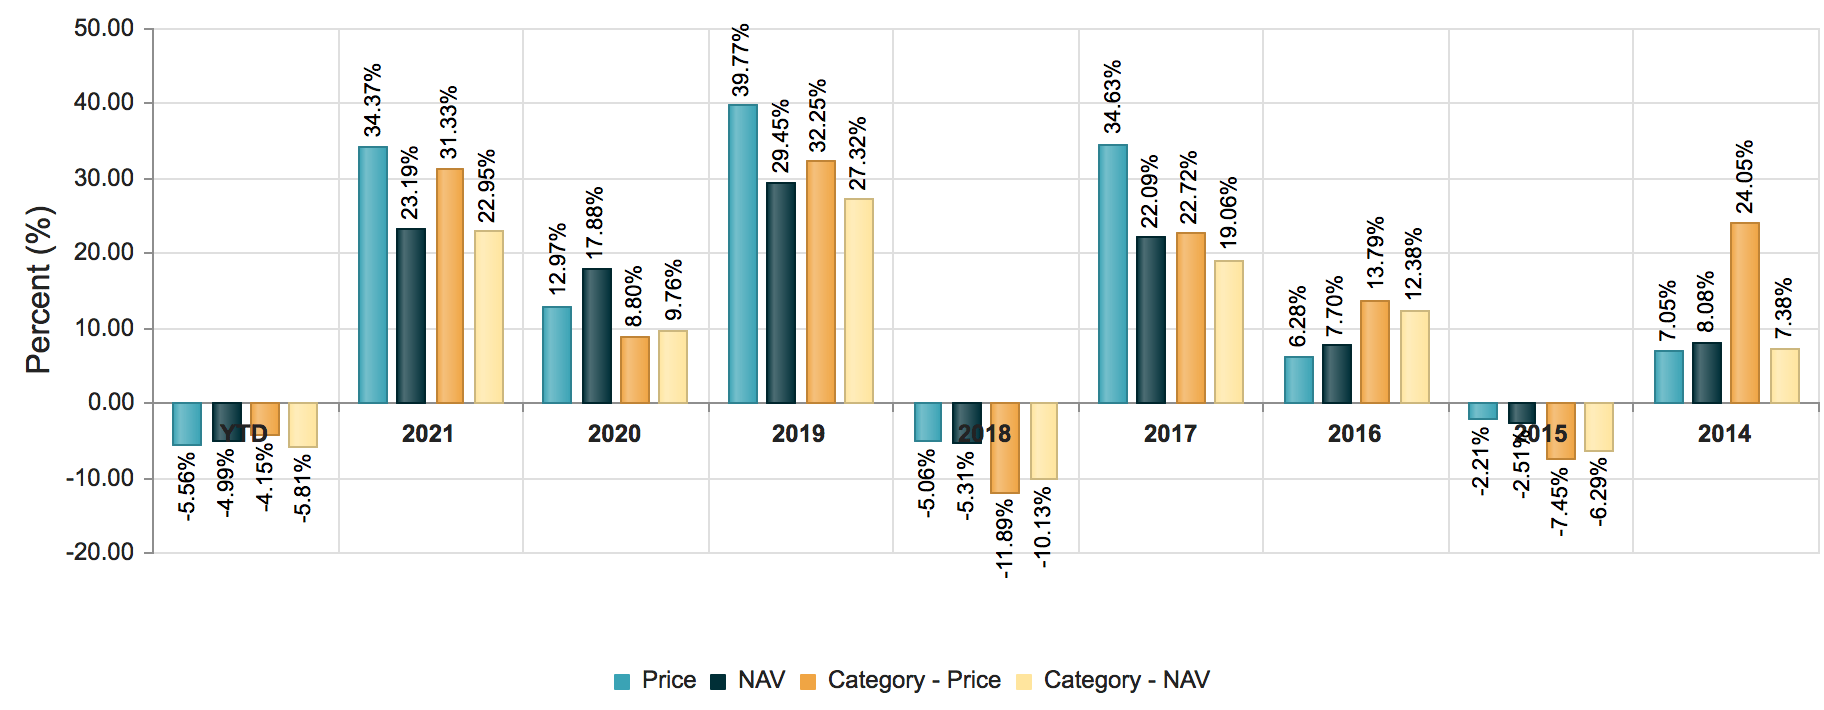
ASG outperformed the category in 2019-2020, but lagged in 2021, and has also had a negative performance so far in 2022, getting dragged down with the Tech sector.
CEF Connect
Indeed, USA’s -12% price performance so far in 2022 is very close to the broad Tech sector’s -11.43% decline. ASG has had an even larger decline, of over 24% in 2022:
Hidden Dividend Stocks Plus
Looking at the Tech sector’s doubling after the 2020 COVID Crash suggests that a pullback was probably due:
YCharts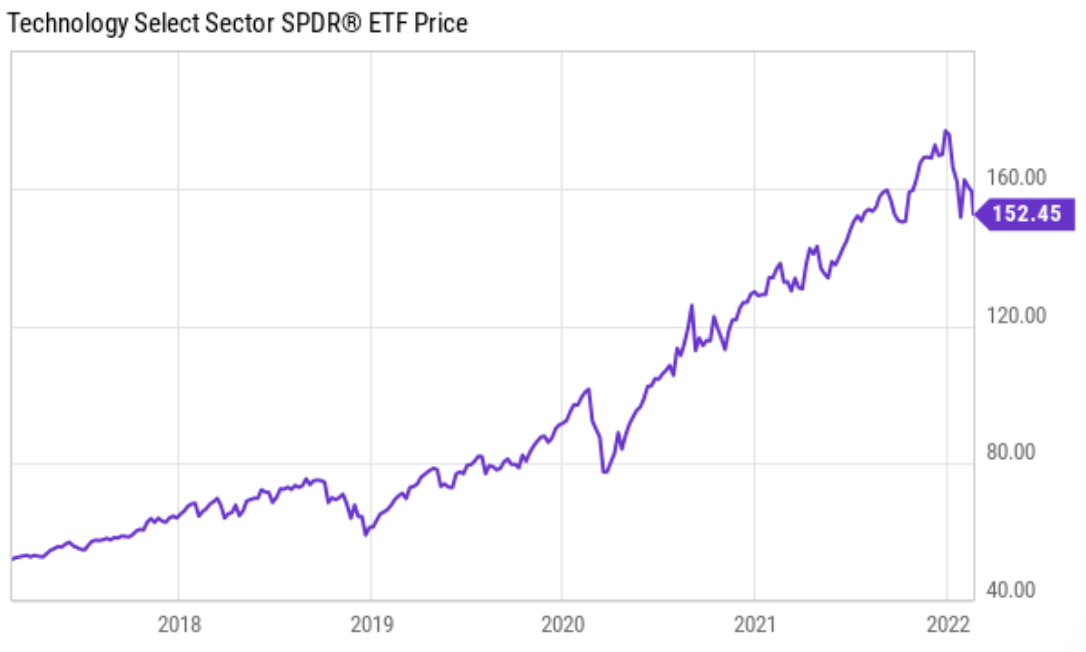
Parting Thoughts:
With rates due to rise, investors have fled the Tech sector due a lower Net Present Value of future earnings in growth stocks, which directly affects ASG more than USA, since it’s a more growth-oriented growth fund than USA.
However, both are taking it on the chin in this environment, and it’ll probably take a while for them to reverse course. We’ll get the 1st Fed rate hike in March, and hopefully there may be some further insights into how many hikes we can expect in 2022, but it’ll probably be a “testing the waters” rate hike program. It’ll be interesting to see how much USA’s managers switch to value stocks during this new era.
All tables furnished by Hidden Dividend Stocks Plus, unless otherwise noted.
Be the first to comment