

Justin Sullivan
We are long-term bullish on Hasbro, Inc. (NASDAQ:HAS), although shares may trade in a rangebound manner for some time to come. As we can see from the long-term chart below, shares are now coming up against long-term support which should at least put a halt to the selling we have seen in recent months. Given how implied volatility has spiked in Hasbro and how implied volatility is trading well north of historical volatility (what we want), we are short iron condors that expire in the October cycle and which are skewed slightly to the upside (overall long delta position). We want that heavy underside resistance to keep Hasbro trading sideways for the next couple of weeks.
We believe at least a halt to the selling (if not a rally) has a good chance of playing itself out here due to the duration of that multi-decade trend line. Remember, the ramifications of recent acquisitions, higher inventory, and possible restructuring has been fully digested by the market at this stage.
Hasbro Long-Term Supporting Trendline (Stockcharts.com)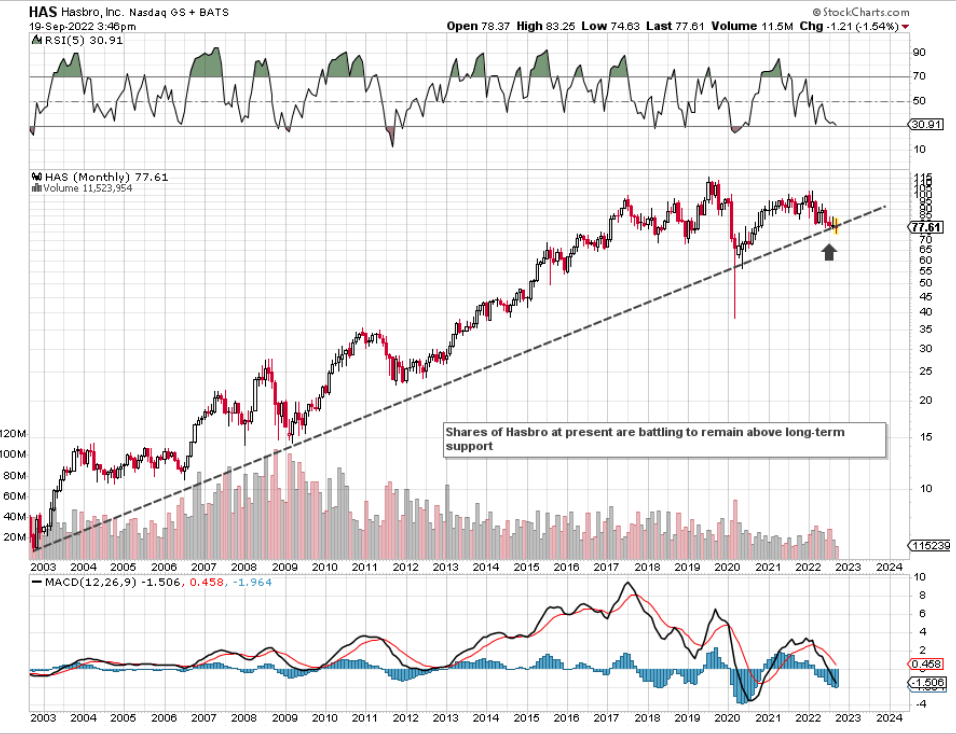
These positions are all about taking advantage of theta decay as well as a potential decline in overall implied volatility. When this decline takes place is another question, but we have placed the odds in our favor for this to happen by not trading this strategy during one of Hasbro’s earnings announcements. Hasbro is next expected to announce its third quarter earnings numbers on the 24th of October. The expiration date for our iron condors is the 21st of October (3 days earlier).
Hasbro Implied Volatility v Historic Volatility (Interactive Brokers)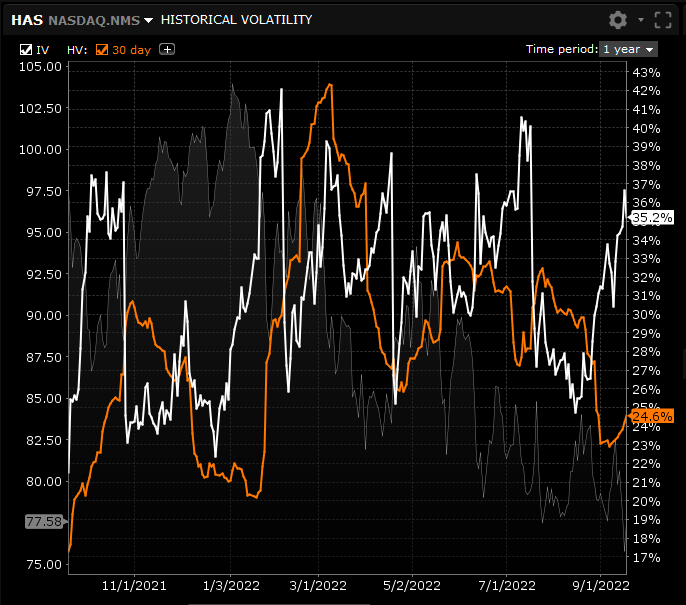
Suffice it to say, it is all about downside protection from our point of view (due to the put spreads being closer to Hasbro’s share price compared to the corresponding call spreads).
Here is why we believe Hasbro remains in solid shape. We will start off with the company’s profitability trends.
Profitability
Hasbro announced an earnings beat in Q2 and full-year guidance was maintained. Although Hasbro is expected to report lower bottom line profitability over the next few years (8%+ average EPS annual growth rate compared to 11%+ over the past 5 years), core profitability has remained elevated as we can see from the company’s margins. Hasbro’s gross margin metric comes in at almost 50% when averaged out over the past four quarters. This compares well with the 51.43% number which is the 5-year average. Furthermore, as we move down the income statement, we see management is making inroads with its costs as Hasbro’s trailing 12-month net income margin of 8.3% compares favorably with the 6.92% average over the past five years.
Suffice it to say, keeping gross margin and net profit margin elevated is crucial during inflationary cycles as it enables Hasbro to continue to generate strong cash flow.
Hasbro Valuation
Despite the above-mentioned forward running bottom-line growth rate, Hasbro’s forward GAAP price-to-earnings ratio comes in at 16.59; a ratio well behind Hasbro’s 5-year average of 25.34. However, since forward earnings expectations are subjective in the best of times, one can instead focus on Hasbro´s assets as well as its sales to demonstrate how this stock remains undervalued. Hasbro´s forward sales and book multiples for example come in at 1.65 & 3.65 respectively. Both of these multiples are approximately 40% lower than Hasbro´s corresponding 5-year averages. Furthermore, the much improved forward cash-flow multiple of 13.5 demonstrate that operating cash flow is expected to be very strong, which in turn should drive the earnings cycle once more.
Balance Sheet
Bears will point to Hasbro’s balance sheet as being a wildcard, but we would beg to differ here. Although long-term debt surpassed $3.7 billion in the company´s most recent reported quarter, the interest coverage ratio came in at 5.6 in the June quarter. Furthermore, despite the sizable amount of goodwill and intangible assets on the balance sheet, Hasbro reported over $3.6 billion of treasury stock on its balance sheet at the end of its most recent second quarter. Treasury stock is stock that has been bought back but has yet to be retired. Suffice it to say, if this number was added to the shareholder equity number ($3.03 billion), ratios such as the debt to equity ratio, for example, would look a whole lot better on paper.
Conclusion
To sum up, Hasbro’s trends with respect to its profitability, valuation, and balance sheet all point to limited downside risk here. Furthermore, shares are now coming up against long-term support and the dividend yield of 3.6%+ remains solid having been paid for 32 consecutive years now. Let’s see how our iron condors turn out. We look forward to continued coverage.
Be the first to comment