

Aslan Alphan/iStock via Getty Images
*Leaven Partners, LP are time-weighted gross cumulative returns (unaudited) provided by our prime broker, Interactive Brokers. Performance data, (net of all fees and expenses), for each partner are provided by Liccar Fund Services. †Trading began on March 16, 2018. Investment Terms and Service Providers
|
Dear Partners,
Fund assets declined by -2.2% in the third quarter and are down -8.5% for the year. The S&P 500 ended the quarter down -4.9%, experiencing quite the volatile ride getting there: up over 9% in July, down -4% in August, and down a sharp -9% in September. Some of the volatility might be explained by the changing views of profit forecasts.
In our last quarterly letter, I briefly mentioned that the consensus estimates for corporate profits appeared to be a bit too sanguine. I referenced a Reuters article[1] that reported, as of June 17, Wall Street expected S&P 500 earnings to grow by 9.6% in 2022, which was up from 8.8% in April and from 8.4% in January. That tune began to change at the end of July and accelerated in August and September, as major players, such as Ford (F), FedEx (FDX), Walmart (WMT), and Nike (NKE), have recently issued profit warnings and/or have withdrawn guidance.
In response, Wall Street has altered its outlook: lowering third-quarter profit growth to 4.6%[2] from 7.2% in early August and slashing full-year profit growth to 4.5%[3].
The halving of profit growth estimates will typically put downward pressure on stock prices—particularly now when the euphoria dissipates and corporate earnings appear to matter once again. The decline in profit growth in some of the hardest hit sectors showed negative momentum in the quarter, as the number of companies that lowered corporate guidance this quarter nearly doubled from the second quarter and is 5 times the number of companies than in the first quarter.[4]
If the Federal Reserve remains staunch in their commitment to combat core inflation, I expect this trend to continue in the near-term as we work off from historic corporate profit margins.[5] There appear to be too many headwinds of rising interest rates, sticky inflation[6], a strengthening dollar, and a tight labor market for corporate America to continue their torrid pace of profit growth.
From a valuation perspective, at the market high in January, the S&P 500’s 12month forward price-to-earnings ratio was over 21. Now it sits just below 16, which is around historical long-term averages. Ceteris paribus, if corporate earnings show continued weakness, expect more pain in the markets.
However, there are signs that the market has bottomed and that stock prices will trend higher from here. A few of the bullish counterarguments are that:
- investor sentiment is extremely low and short positions (i.e., money betting that things continue to go down) are very high— suggesting that the bad news is already priced into the markets,
- inflation has peaked, or is near peaking, and is set to come down quickly suggesting the Federal Reserve will stop raising interest rates soon, and,
- the U.S. economy is still doing reasonably well and that stock market valuations have come back in line to within a normal range—suggesting there is no reason for panic at this point.
Although some of the arguments for why markets have bottomed are compelling, stock market bubbles have behaved similarly, and the life and death of bubbles based on historical precedents should be at the forefront of one’s mind. Until proven otherwise, I think it is sound logic to work from a mental framework that stock market bubbles, although all nuanced and uniquely different, behave predominantly in the same way.
One of the behaviors of bubbles—at their end—is that they have always fallen back to trend. Jeremy Grantham, a co-founder of GMO, has written extensively on bubble behavior. He points out that the three major, as he puts it, super-bubbles in the U.S. (1929, 1972, & 2000) suffered market losses of at least 50% or more.[7] Throw in international bubbles, like Japan in 1989 and the BRICS[8] in 2010, and the outcomes are the same. Jeremy has written that he sees the current environment as another of the great super bubbles and that he expects its death to exhibit the same features as those that have come before it.
With that in mind, based on trend and adjusting for inflation, the line of demarcation for the S&P 500 is around 3,000. As I write, the S&P 500 is around 3,600. If history is a useful guide, it suggests we have another, at least, -17% more to go.[9]
In the aftermath of bubbles, “buying the dip,” which, over the past decade, has worked wonderfully well on the way up, is a gut-wrenching experience on the way down. So far this year, we have experienced 4 rallies in the market (where the S&P 500 rallied by 6% or more) only to make fresh new lows in each instance. This has been seen before. For example, the dotcom bubble burst saw the Nasdaq rally, at least 20% higher in each occurrence, 7 times as it ultimately made its way down -78% from its peak in 2000.[10]
One example of the many excesses that are compounded during the buildup of bubbles that are fuel for the latter collapse is to look at corporate profits and the creative accounting that may come along with it. A way to evaluate this might be to compare the US National Income and Product Accounts (NIPA) to the reported corporate profits after tax of the S&P 500. NIPA is produced by the Bureau of Economic Analysis (BEA) of the Department of Commerce.
Although it is not a strict apples-to-apples comparison, (as the number of companies sampled in the NIPA series is larger than the S&P 500), the trend growth rate is the same for both so the comparison is reasonable.[11] A few key traits here is that S&P 500 profits are more volatile than NIPA profits and that when S&P 500 profits are much higher or lower than NIPA profits, S&P 500 profits will converge to NIPA profits.
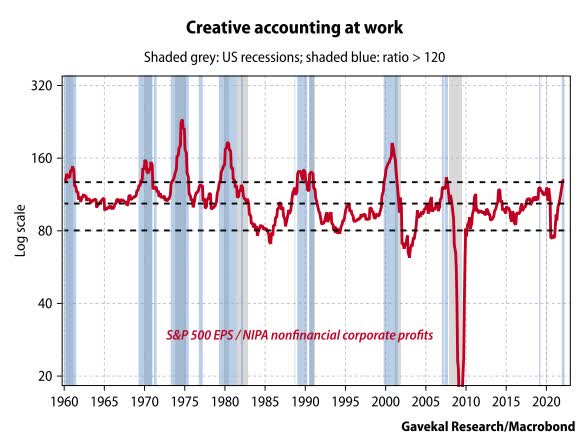
The cause of the divergence and convergence is primarily explained by the degree or level of accruals used by companies in the S&P 500 to derive their income after tax figures for a given period. The BEA, on the other hand, calculates its estimate by adjusting corporate profits after tax with Inventory Valuation Adjustment (IVA) and Capital Consumption Adjustment (CCA).
These adjustments to corporate profits by and large strip out the accrual accounting measures used by corporate America for both depreciation and inventory. In short, the adjustments are made in an attempt to more accurately report profits from current production.
Charles Gave, of Gavekal Research, investigated this divergence and asked if anything can be learned from it. Charles observed that, since 1960, when S&P 500 reported earnings were 20% or more above NIPA profits, a recession followed. Charles also noted that no recession ensued that was not preceded by this observation.[12]
Today we are well above the 20% threshold. In the last 25 years, we have only seen these levels during 2000 & 2008.[13]
This reminds me of the joke about a mathematician, a statistician, and an accountant interviewing for the same job. The interviewer calls in the mathematician first, the interview goes well and for the last question the interviewer asks, “What does two plus two equal?” The mathematician replies, “Four.”
The interviewer says great and then calls in the statistician, and after another good interview he asks the same question, “What does two plus two equal?” The statistician says, “With such a small sample size the answer is four give or take point three percent, but on 9 times out of 10 the answer will be four.”
Satisfied, the interviewer then calls in the accountant and at the end of the interview poses the same question, “What does two plus two equal?” Very suddenly the accountant gets up, locks the door, closes the shades, disconnects the phone, then approaches the interviewer and asks, “What do you want it to be?
The ironic twist is that the spirit of accrual accounting is meant to improve reporting by moving revenues and expenses into periods as they are incurred. However, the application of accrual accounting allows for many degrees of interpretation and so opens the door for human behavior to get in the way of human judgment—which leads to some smudging of the numbers. And smudging is most severe when there is an excessive amount of money to be made. As they say, “make hay while the sun shines”.
When the market is roaring higher it pays well to all those involved to keep a company’s revenues and profits looking good. This behavior has created an earnings cycle. In times of plenty, corporate accounting becomes increasingly aggressive – by pushing the envelope with creative accounting to raise reported revenues and lower reported expenses thereby showing healthy profits. But smudging can only go so far.
Eventually, it becomes too difficult to generate the reported profits that Wall Street and Main Street have come to expect. Of course, some will resort to outright fraud, but for most, once the easy grifting has run its course the jig is up. Companies will disappoint on their reported earnings creating a cascading effect to the downside. This in turn leads companies to “take a bath” in the current period: using creative accounting in the opposite direction to substantially decrease its current profits in order to be able to meet future earnings targets. The cycle then repeats.[14]
The bottom line is that when corporate profits rise above the 20% threshold, those excess profits are being generated by the accountants and will have to be “paid back” in the future in the form of lower reported profits (or losses).
In the quarter, our put option strategy had a positive contribution of +1.0% to overall performance.
In August, following the short-term run-up this summer, I bought additional put options on the Nasdaq and Russell 2000 Growth Indices that expire in 2024. At quarter-end, approximately 8% of fund assets were in the put strategy.[15]
3rd Quarter Contribution
|
Put Options |
+1.01% |
|
Core Holdings |
-4.59% |
|
Cash/Currency Hedge |
+1.39% |
|
Total Return |
-2.20% |
Our currency strategy also had a positive contribution to fund performance, contributing +1.4% in the quarter. Every G10 currency has slipped against the dollar this year, for an average fall of about 15%. Among the G10 currencies, the Japanese yen has seen the greatest devaluation, down over -20% on the year. Near term, there appears to be no abatement, as the U.S. Dollar is up about 7% for the quarter against a basket of currencies and stands near its highest level since May 2002.
Maintaining Discipline
Our core holdings had a negative contribution of -4.59% and are approximately 90% of fund assets. I’m pleased with the performance of our core holdings this year given the environment we are in and I expect the market to reward us in due time!
The goal of any value investor is to understand the difference between price and value—and to maintain a clear head by focusing on value relative to price.
I will continue the core strategy of buying undervalued stocks; they are cheap because the market believes the company to have:
- (A) very unfavorable prospects;
- (B) a likelihood of bankruptcy; and/or,
- (C) a likelihood of poor stock price appreciation.
For these reasons, oftentimes, a stock becomes too cheap, and the result, on average, is that the stock appreciates due to the following:[16]
- The creation of an earning power commensurate with the company’s assets. This may result from:
- General improvement in the industry, and/or
- Favorable change in the company’s operating policies, with or without a change in management. These changes include more efficient methods, new products, abandonment of unprofitable lines, etc.
- A sale or merger, because some other concern is able to utilize the resources to better advantage and hence can pay at least liquidating value for the assets.
- Complete or partial liquidation.
The fundamental problem is that good companies do not invariably equate to good investments. The price you pay matters. Don’t overpay!
In Closing
I am grateful for your participation in Leaven Partners, LP, and that you have entrusted me to manage your assets. I look forward to reporting to you at our next quarter-end.
In the meantime, if there is anything I can do for you, please do not hesitate to contact me.
Sincerely,
Brent Jackson, CFA
|
DISCLAIMER The information contained herein regarding Leaven Partners, LP (the “Fund”) is confidential and proprietary and is intended only for use by the recipient. The information and opinions expressed herein are as of the date appearing in this material only, are not complete, are subject to change without prior notice, and do not contain material information regarding the Fund, including specific information relating to an investment in the Fund and related important risk disclosures. This document is not intended to be, nor should it be construed or used as an offer to sell, or a solicitation of any offer to buy any interests in the Fund. If any offer is made, it shall be pursuant to a definitive Private Offering Memorandum prepared by or on behalf of the Fund which contains detailed information concerning the investment terms and the risks, fees and expenses associated with an investment in the Fund. An investment in the Fund is speculative and may involve substantial investment and other risks. Such risks may include, without limitation, risk of adverse or unanticipated market developments, risk of counterparty or issuer default, and risk of illiquidity. The performance results of the Fund can be volatile. No representation is made that the General Partner’s or the Fund’s risk management process or investment objectives will or are likely to be achieved or successful or that the Fund or any investment will make any profit or will not sustain losses. As with any hedge fund, the past performance of the Fund is no indication of future results. Actual returns for each investor in the Fund may differ due to the timing of investments. Performance information contained herein has not yet been independently audited or verified. While the data contained herein has been prepared from information that Jackson Capital Management GP, LLC, the general partner of the Fund (the “General Partner”), believes to be reliable, the General Partner does not warrant the accuracy or completeness of such information. |
Footnotes[1] “While second-quarter profit growth forecasts have fallen in recent weeks, estimates for the third and fourth quarters and for all of 2022 have held up or risen, according to IBES data from Refinitiv.” https://www.reuters.com/markets/us/investorsworry-that-us-profit-forecasts-are-too-high-2022-06-16/ [2] According to Refinitiv IBES, that is only slightly worse than the median 2.2 percentage point decline ahead of reporting periods historically, suggesting the possibility of more pain to come. [3] As of October 6. This action has reversed quickly as average full year growth estimates were at 7.7% as recent as September 26. [4] Limited to the top four sectors with the largest number of announced lowered corporate guidance in the latest 3 quarters. Source: S&P Global Market Intelligence [5] U.S. corporate profit margins touched levels not seen since the 1950s and 1960s, and nominal profits in Q2 were the highest ever recorded, breaking through $2 trillion. [6] Inflation is at a four-decade high. [7] Entering the Superbubble’s Final Act [8] “The Brics concept, plus acronym, was dreamed up in 2001 by Jim O’Neill, chairman of Goldman Sachs Asset Management. He highlighted the combined potential of non-western powers controlling one quarter of the world’s land mass and accounting for more than 40% of its population.” https://www.theguardian.com/business/2016/mar/27/brics-bubble-burstbrazil-russia-india-china-south-africa [9] A 50% drop from its peak at the end of 2021, puts the S&P 500 at around 2,400. Prices should be adjusted for the historical trend in earnings growth and for inflation, which has been white hot, but an expected range of 2,400 to 3,000 is within reason. [10] Thanks to Dr. Michael Burry for pointing this out on Twitter. [11] https://apps.bea.gov/scb/pdf/national/niparel/2001/0401cpm.pdf [12] Corporate Profits And Creative Accounting – Gavekal Research [13] Levels in 2000 were much higher than today but are currently at around the 2008 levels. [14] For a great read on how the excesses crept into the system from Wall Street to Main Street to Corporate America during the dotcom bubble, check out Maggie Hahar’s book: Bull!: A History of the Boom and Bust, 1982-2004 [15] Versus a total allocation of 6% at the end of 2Q. [16] Graham, B., & Dodd, D. L. (2009). Security analysis: Principles and technique. New York: McGraw-Hill. |
Editor’s Note: The summary bullets for this article were chosen by Seeking Alpha editors.
Be the first to comment