

bodnarchuk
Introduction
Colorado Springs-based Gold Resource (NYSE:GORO) released the third quarter of 2022 results on November 1, 2022.
Note: This article is an update of my article published on October 10, 2022. I have followed GORO on Seeking Alpha since March 2014.
1 – Investment thesis
Gold Resource is producing from one single mine called the Don David Gold mine in Mexico, which is a significant risk factor that you should consider when investing in this small company. The company acquired a controversial project in Michigan called the Back Forty project.
GORO Map Presentation (GORO Presentation)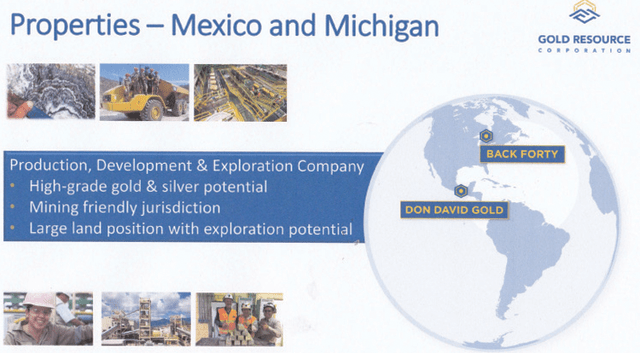
For those interested in the Back Forty project, I recommend reading my recent article published on October 10, 2022, where I discuss the Back Forty project and the different issues attached to this controversial project.
GORO Back Forty Project (GORO August Presentation)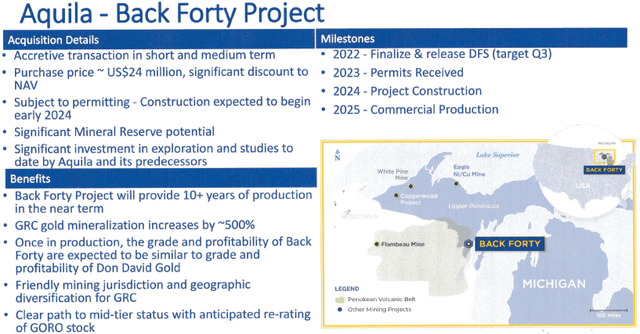
Note: Assuming the project is approved, the company expects to start construction in 2024 and achieve commercial production in 2025.
Thus, I do not recommend investing in a large dollar amount for the long term but recommend holding a small core position while trading short-term LIFO at about 50% of your long position.
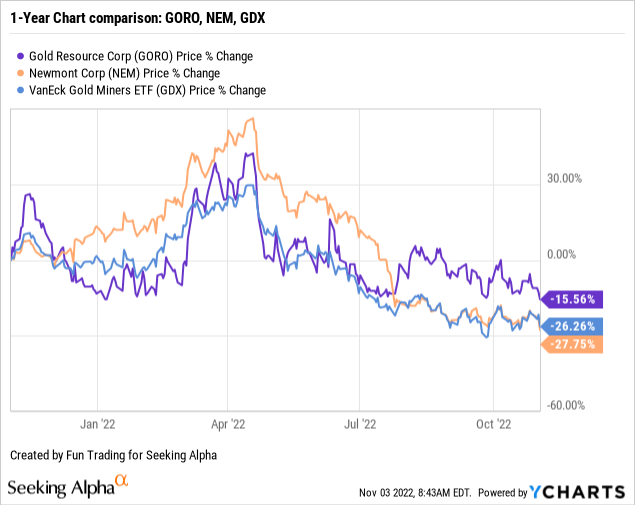
2 – Stock performance
Let’s compare GORO to Newmont Corporation (NEM) and GDX. We can see that GORO is down 16%, outperforming NEM and GDX.
Gold Production For The Third Quarter Of 2022
1 – The gold/silver ratio?
The gold and silver ratio for the third quarter of 2022 is 87.8:1 for Gold Resource. Below are the two historic charts describing the quarterly production of Ag and Au equivalent.
GORO Quarterly Production Gold and Silver history (Fun Trading)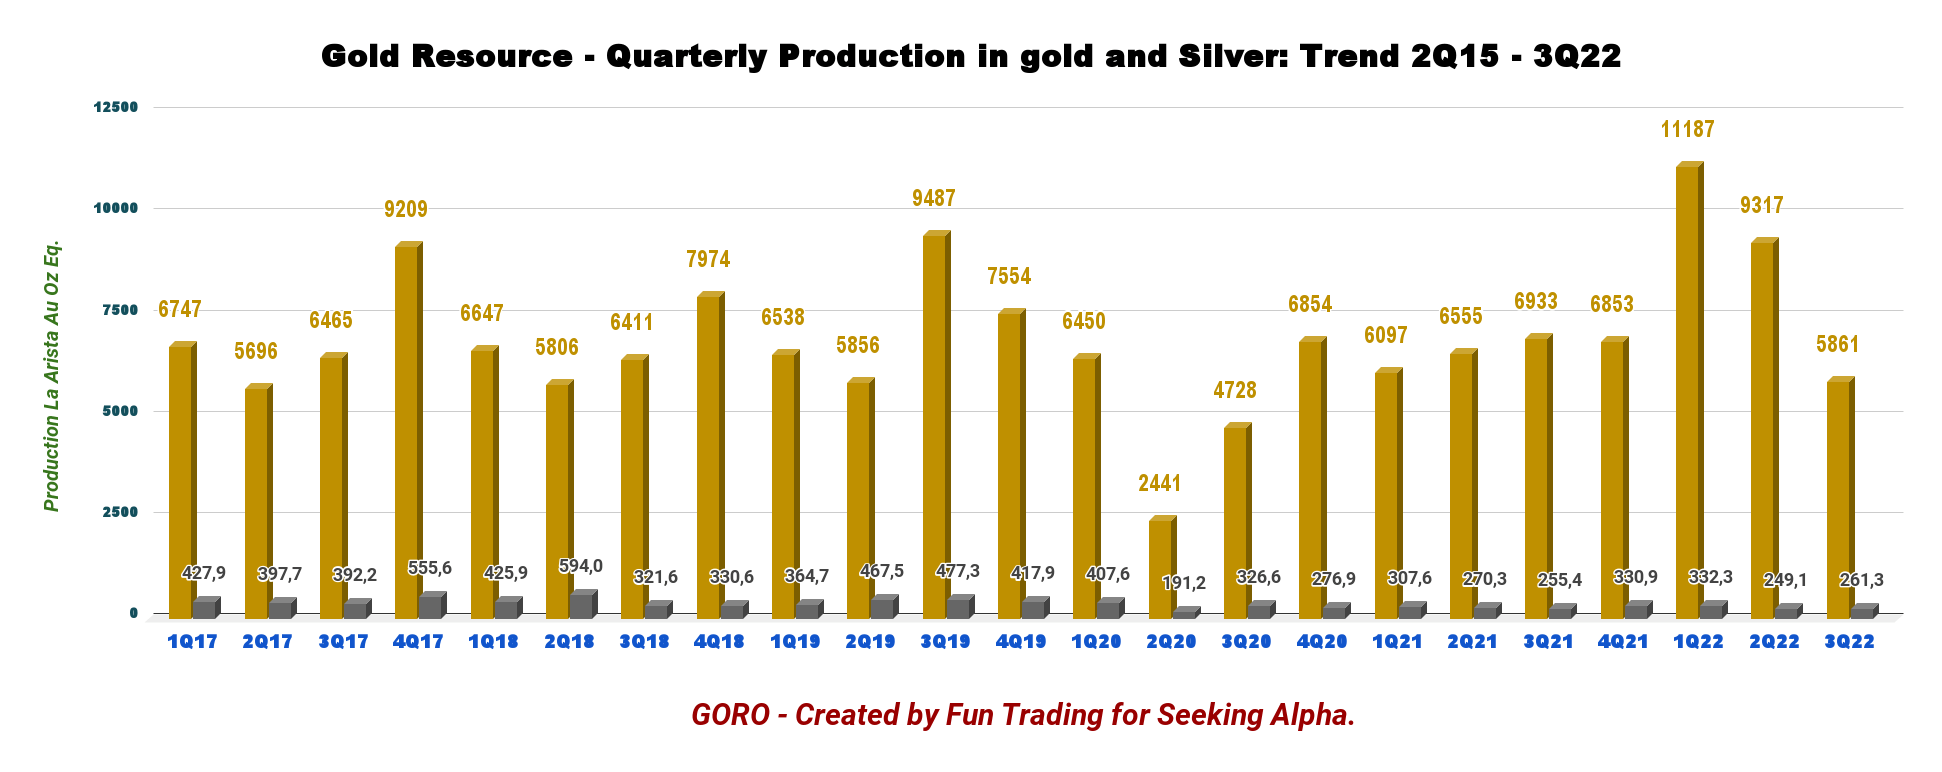
Warning: The 10-Q is not clear about what has been produced and what has been sold. The company indicates only the Production GEO sold, and I had to estimate the GEO produced.
2 – Quarterly production in a few charts
GORO Quarterly GEO Production history (Fun Trading)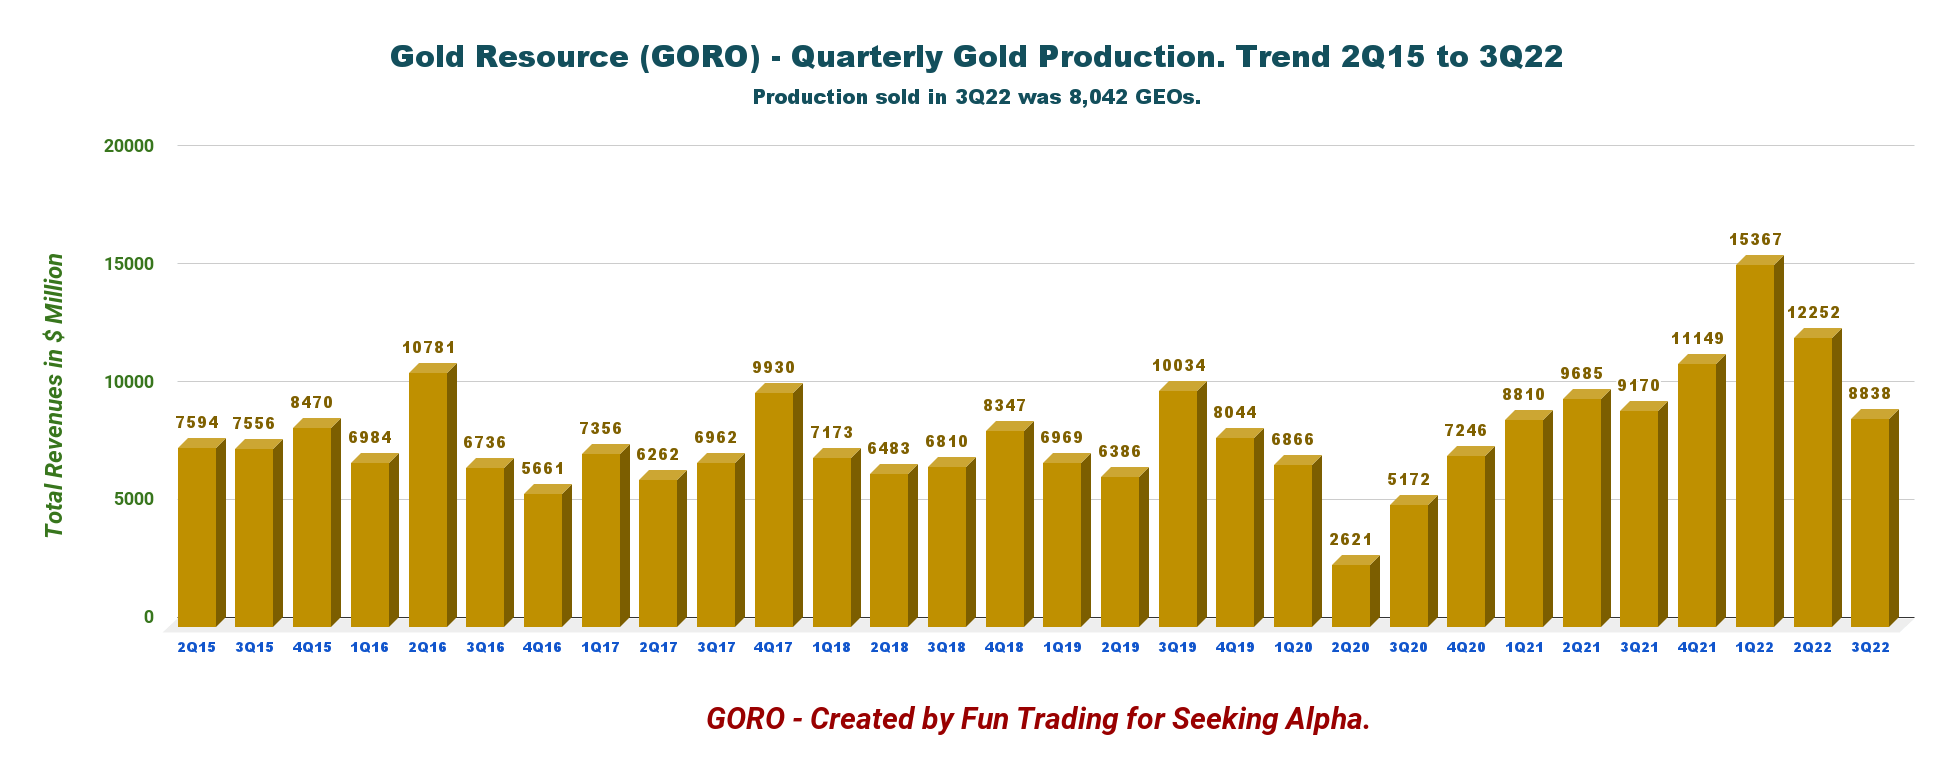
Gold equivalent produced is estimated at 8,838 GEOs based on the ratio 87.8:1. The Gold equivalent production has been calculated based on 5,861 Au ounces and 261,256 Ag ounces.
The company has indicated it sold 8,042 GEOs in 3Q22.
The company said that while exploration was temporarily slowed to address safety improvement opportunities, work focused on infill drilling with encouraging results from the Arista and Switchback vein systems. It was a disappointing production well below the two preceding quarters. However, the 2022 production and cost guidance is unchanged.
CEO Allen Palmiere said in the conference call:
During the third quarter, we took additional measures at DDGM to address ground support and ventilation issues. The disciplined approach had a temporary impact on production volumes, mine development and exploration. With that said, we are still on track to meet 2022 production and cost guidance. We will always put our people and safety first at the temporary cost of production.
Detailed history, including Copper, Lead, and Zinc.
GORO Quarterly Metals production history (Fun Trading)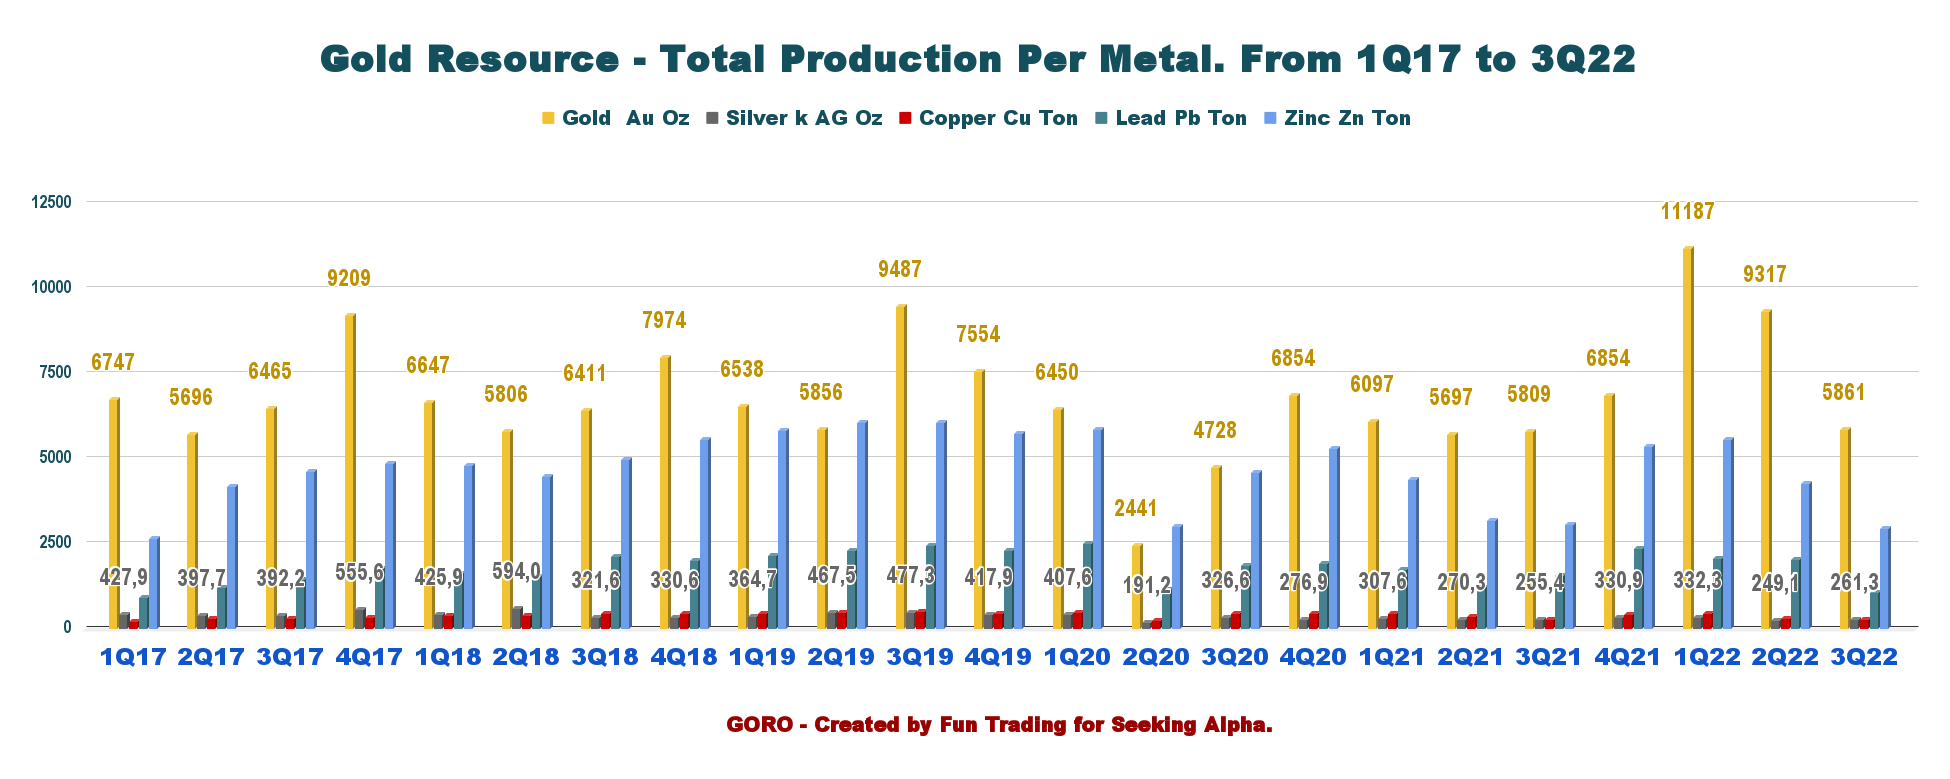
The gold price was $1,627 per ounce, and the silver price was $18.54 per ounce.
During the third quarter, GORO processed ore at an average rate of 1,361 TPD compared with 1,353 TPD in 3Q21. The average gold grade g/t was 1.98 in 3Q22 compared to 2.68 g/t in 3Q21.
Gold Resource sold (with gold and silver as co-products) 8,042 Au Eq, including 2,564 Au Eq. Oz (silver) and 5,478 Au Oz in 3Q22.
The company also produced copper (282 tonnes), lead (1,056 tonnes), and zinc (2,943 tonnes) at its Mexican mines.
Below are the historical details of the metals produced.
| Detailed Production | 3Q21 | 4Q21 | 1Q22 | 2Q22 | 3Q22 |
| Gold Au Oz | 5,809 | 6,854 | 11,187 | 9,317 | 5,861 |
| Silver K AG Oz | 255.4 | 330.9 | 332.3 | 249.09 | 261.26 |
| Copper Cu Ton | 268 | 413 | 431 | 303 | 282 |
| Lead Pb Ton | 1,550 | 2,345 | 2,073 | 2,020 | 1056 |
| Zinc Zn Ton | 3,059 | 5,349 | 5,562 | 4,282 | 2943 |
Source: Fun Trading
4 – All-in sustaining costs or AISC/GEO (co-product)
The AISC per GEO in the third quarter of 2022 was $1,831 per ounce, well below the 3Q21 of $1,031 per GEO. It was a huge jump due to the impact of lower co-product credits due to lower base metal prices.
GORO Quarterly AISC history (Fun Trading)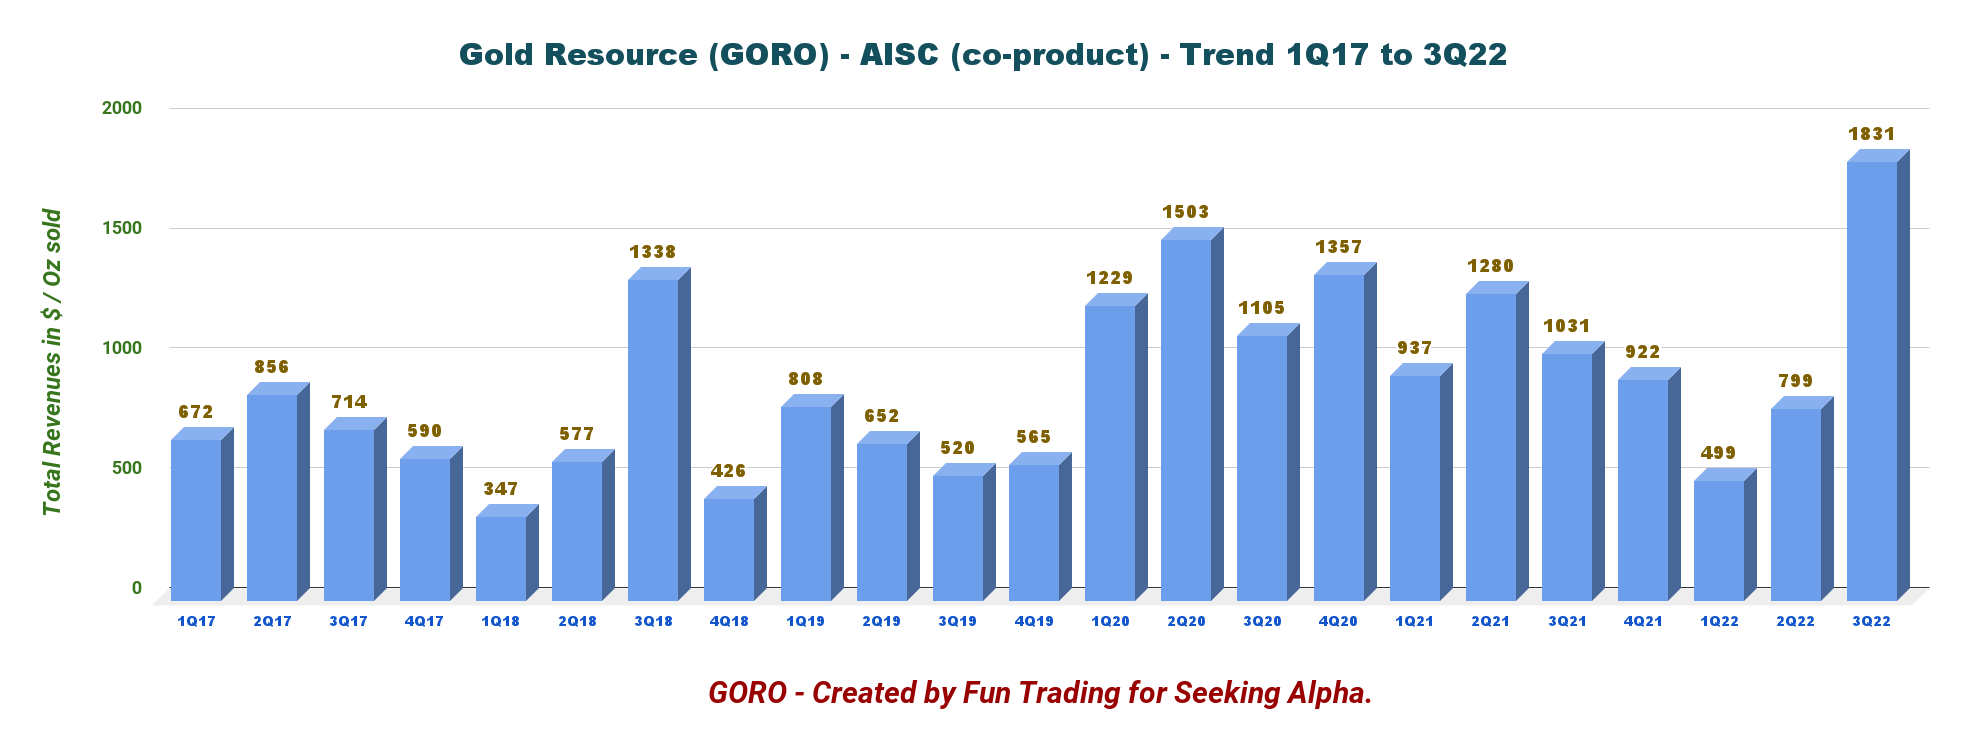
Balance Sheet And Production In 3Q22. The Raw Numbers
| Gold Resource | 3Q21 | 4Q21 | 1Q22 | 2Q22 | 3Q22 |
| Total Revenues in $ Million | 29.03 | 38.06 | 45.42 | 37.06 | 23.87 |
| Net Income in $ Million | 1.53 | 2.69 | 4.02 | 2.67 | -9.73 |
| EBITDA $ Million | 7.61 | 15.32 | 15.55 | 13.88 | -3.34* |
| EPS diluted in $/share | 0.02 | 0.04 | 0.05 | 0.03 | -0.11 |
| Cash from operating activities in $ Million | 5.74 | 12.91 | 4.23 | 7.98 | -4.30 |
| Capital Expenditure in $ Million | 5.88 | 5.39 | 5.95 | 4.57 | 3.60 |
| Free Cash Flow in $ Million | -0.14 | 7.52 | -1.72 | 3.41 | -7.90* |
| Cash and short-term investments (+Au/Ag bullion) $ Million | 30.10 | 34.3 | 31.18 | 33.34 | 22.53* |
| Long-term Debt in $ Million | 0 | 0 | 0 | 0 | 0 |
| Quarterly Dividend per share in $ | 0.01 | 0.01 | 0.01 | 0.01 | 0.01 |
| Shares outstanding (diluted) in Million |
74.90 |
77.91 |
88.62 |
88.79 |
88.39 |
Source: Company 10-Q and from personal files.
* Estimated by Fun Trading
Balance Sheet Discussion
1 – Revenues were $ million in 3Q22
GORO Quarterly Revenues history (Fun Trading)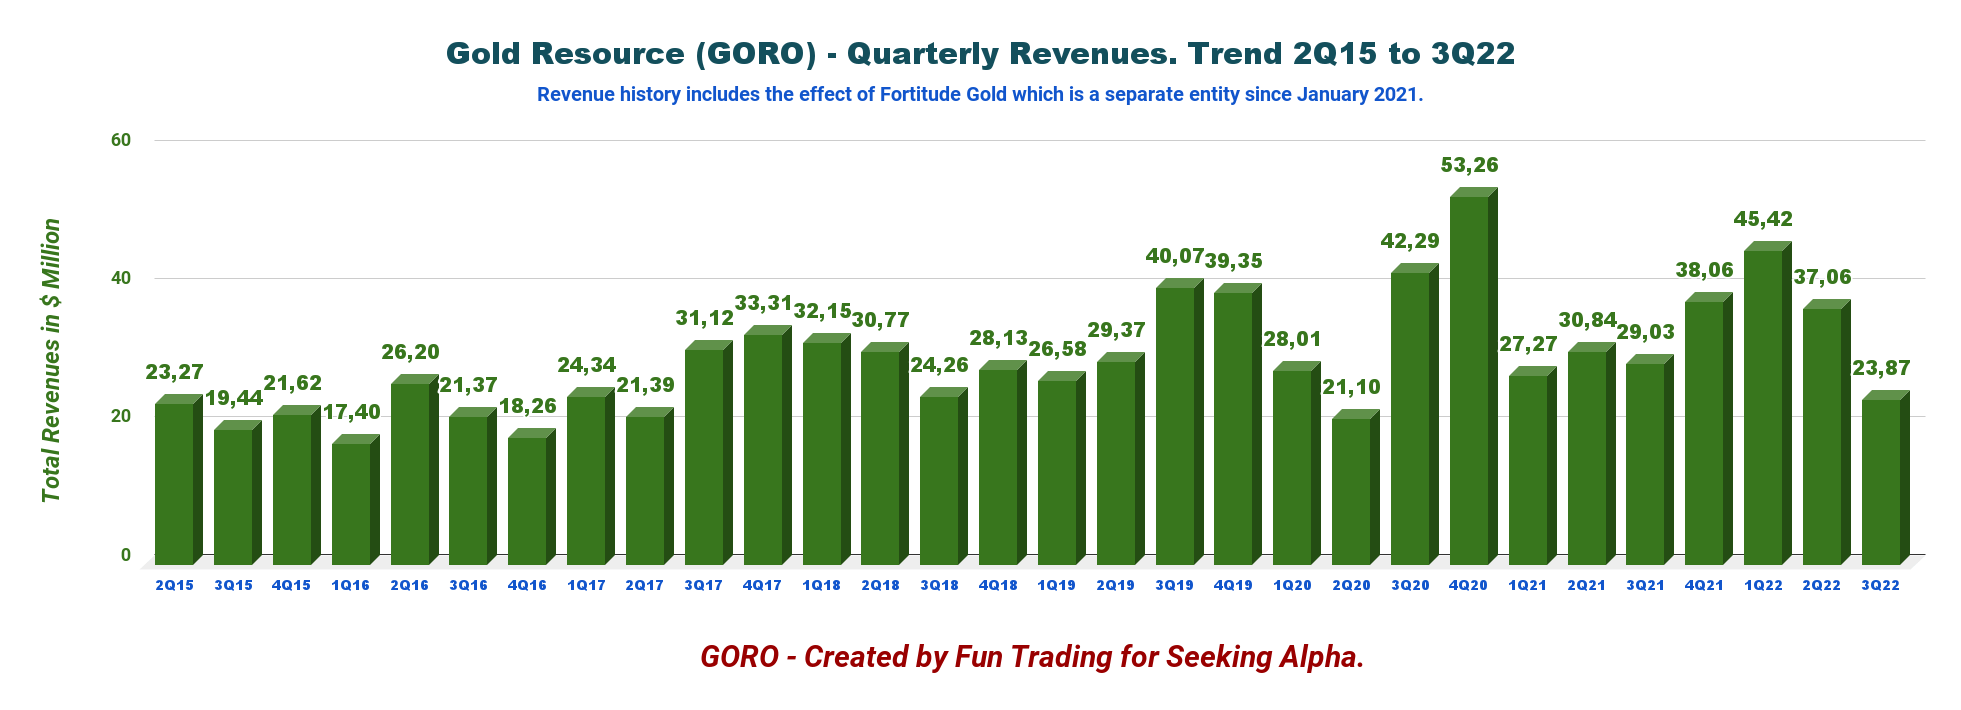
Note: Fortitude (OTCQB:FTCO) was spun-off in 4Q20.
The gold and silver producer reported a loss per share of $0.11 on revenue of $23.87 million compared with an income of $0.02 on revenue of $29.03 million in the last year’s third quarter (please look at the table above for more financial details).
Note: GORO’s Mexican assets are also called the Don David Gold Mine complex.
The company posted a net loss of $9.73 million during the third quarter compared to an income of $1.53 million a year ago. It was not a good quarter overall.
After by-product credits, Don David Gold Mine’s total cash cost was $1,103 per gold equivalent ounce sold. All-in-sustaining costs were $1,831 per gold equivalent ounce sold.
COO Alberto Reyes said in the conference call:
we are on track to meet guidance for the year. However, we must mention some of the headwinds we faced this quarter that impacted our production. Our Mexican operation experienced a lower throughput compared to the two previous quarters. As the hurricane season moved in, Oaxaca received an unusual share of rain slightly impacting crushing activities.
Alberto Reyes also said that the low production in 3Q22 due to technical issues had been resolved, and we should expect better output in 4Q22.
Furthermore, the processing plant needed to implement changes to the regrind circuit causing gold and copper recoveries to go down. Those changes have been adjusted and recoveries are back to normal. On the mining front, Phase 1 of the ventilation system was completed, but the Phase II, the vent shaft connecting level 22 to Level 27 experienced adverse ground conditions delaying its completion until Q4.
2 – Gold Resource’s free cash flow is estimated at $ million in 3Q22
GORO Quarterly Free cash flow history (Fun Trading)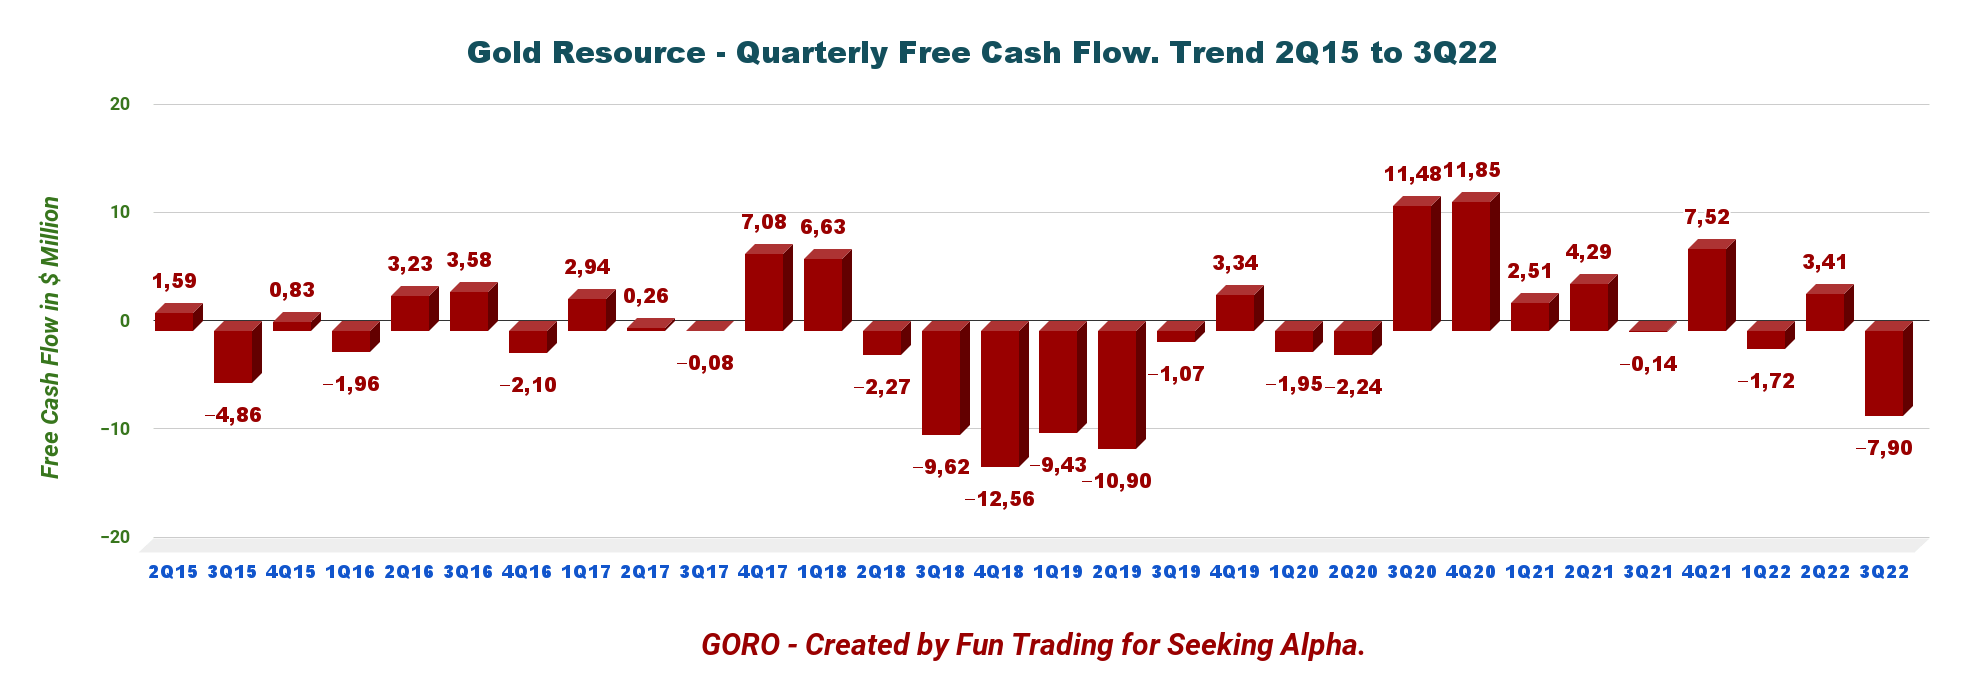
The company estimated free cash flow for Q3 is a loss of $7.90 million, and the trailing 12-month free cash flow was $1.31 million.
Gold Resource pays a yearly dividend of $0.04 per share or a dividend yield of 2.63%, covered by free cash flow.
3 – Cash is now $22.53 million, and the company has no debt
Gold Resource has a good cash position of $22.53 million in 3Q22 and no long-term debt. However, assuming the company gets all permits for the Back Forty project, it will have to secure financing for its completion, and the debt profile will probably change.
GORO Quarterly Cash versus debt history (Fun Trading)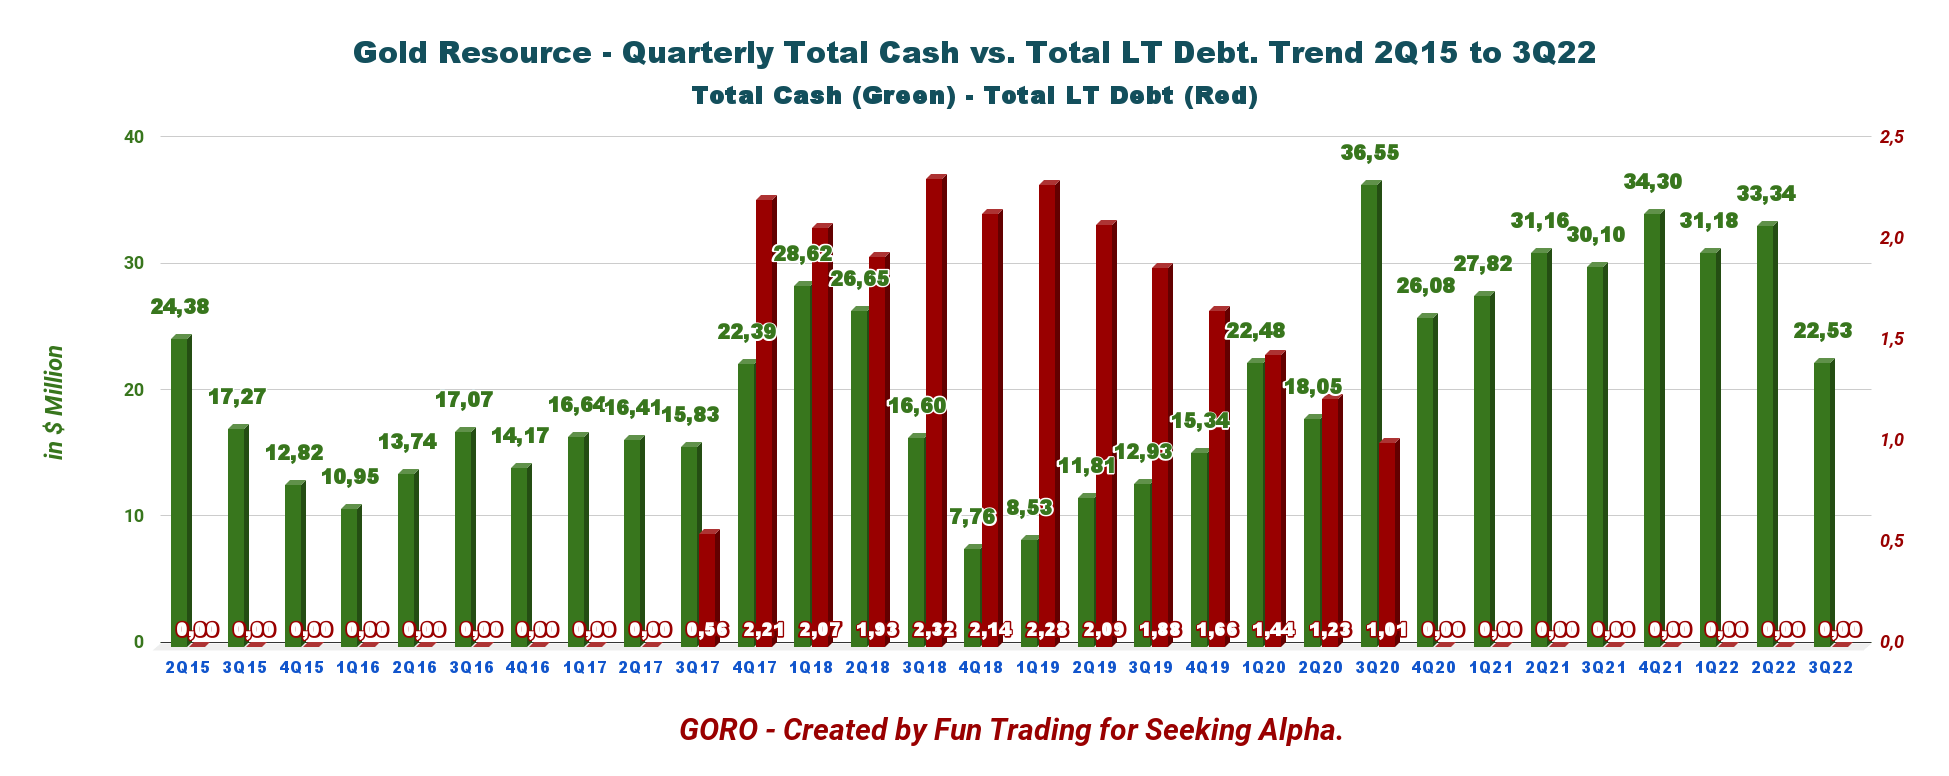
CFO Kim Perry said in the conference call:
Cash in 2022 has declined due to $16 million in tax payments made for both 2021 and 2022, a $14 million investment in capital projects and nearly $7 million investment in the Back Forty project, a $1.7 million investment in Maritime Resource Corporation and nearly $3 million distributed in dividends.
4 – Guidance 2022 (unchanged in 3Q22) – Payable production of 24K-26K Au Oz and 900K-1,000K Ag Oz. The company reiterated 2022 production and cash guidance.
GORO 2022 Guidance (GORO Presentation)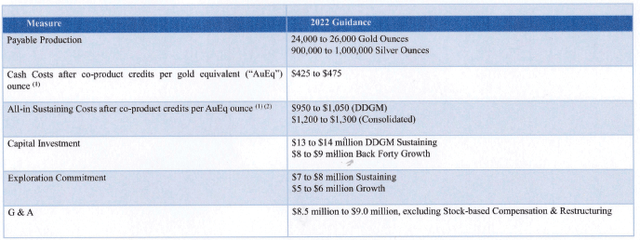
Technical Analysis (Short Term) and Commentary
GORO TA Chart short-term (Fun Trading StockCharts)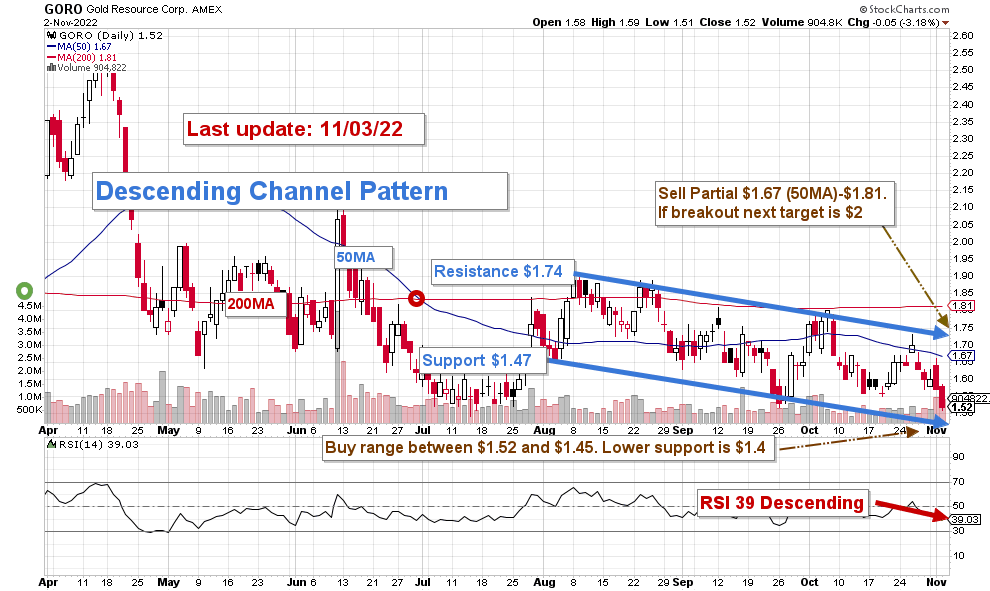
Note: The chart has been adjusted for the dividend.
GORO forms a descending channel pattern with resistance at $1.74 and support at $1.47. Descending channel patterns are short-term bearish in that a stock advances lower within a channel. However, they often form within longer-term uptrends, which favor an accumulation strategy.
The short-term trading strategy is to sell between $1.67 and $1.81, about 50% of your position, and wait for a retracement between $1.52 and $1.45 to buy back gradually.
After the FED’s decision to hike interests by 75-point yesterday and potentially in December, GORO could fall further and reach its lower support at around $1.40.
As I regularly recommend to my subscribers in my marketplace, “The Gold and Oil Corner,” I firmly suggest trading short-term LIFO for about 50% of your long-term position to take advantage of the volatility and unforeseen events.
Watch the gold price and the Fed like a hawk.
Note: The LIFO method is prohibited under International Financial Reporting Standards (IFRS), though it is permitted in the United States by Generally Accepted Accounting Principles (GAAP). Therefore, only US traders can apply this method. Those who cannot trade LIFO can use an alternative by setting two different accounts for the same stock, one for the long term and one for short-term trading.
Warning: The TA chart must be updated frequently to be relevant. It is what I am doing in my stock tracker. The chart above has a possible validity of about a week. Remember, the TA chart is a tool only to help you adopt the right strategy. It is not a way to foresee the future. No one and nothing can.
Author’s note: If you find value in this article and would like to encourage such continued efforts, please click the “Like” button below as a vote of support. Thanks.
Be the first to comment