

Stephen Lam
Introduction
Salesforce, Inc. (NYSE:CRM) is an extensive software service company focusing on marketing for small businesses and enterprise corporations. With stable fundamentals and near-perfect timing for market entries, CRM stock may be ready for some profit-taking over the long run. There is one concern about how the CEO and CFO have been selling off stock recently.
Fundamentally stable over the long run
Ratios
Salesforce represents a company with a solid fundamental news story with a growing current and quick ratio over the last five years.
|
Unnamed: 0 |
2018 |
2019 |
2020 |
2021 |
2022 |
|
Period |
FY |
FY |
FY |
FY |
FY |
|
Current ratio |
0.917 |
0.949 |
1.075 |
1.235 |
1.049 |
|
Quick ratio |
0.836 |
0.823 |
0.951 |
1.114 |
0.931 |
|
Cash ratio |
0.251 |
0.237 |
0.279 |
0.349 |
0.251 |
Source: Financial Modelling Prep
Growth
Outside of these not-so-strong growth indicators for both revenue and net income growth, it is positive to say that the stock price has doubled in the last five years. This proves that some of these fundamental metrics cannot be relied upon but needs to be overlaid with many other types of analysis.
|
Unnamed.: 0 |
2018 |
2019 |
2020 |
2021 |
2022 |
|
Period |
FY |
FY |
FY |
FY |
FY |
|
Revenue growth |
0.249 |
0.267 |
0.287 |
0.243 |
0.247 |
|
Gross profit growth |
0.251 |
0.276 |
0.308 |
0.229 |
0.231 |
|
Ebit growth |
2.671 |
1.269 |
-0.445 |
0.532 |
0.204 |
|
Net income growth |
-0.290 |
7.707 |
-0.886 |
31.317 |
-0.645 |
Source: Financial Modelling Prep
Enterprise
As you can see here, the stock price has nearly doubled in the last four years. Market capitalization has also more than doubled at the same time.
|
Unnamed: 0 |
2018 |
2019 |
2020 |
2021 |
2022 |
|
Symbol |
CRM |
CRM |
CRM |
CRM |
CRM |
|
Stock price |
121.920 |
164.530 |
170.400 |
213.470 |
210.390 |
|
Number of shares |
714.919 M |
751 M |
829 M |
908 M |
955 M |
|
Market capitalization |
87.163 B |
123.562 B |
141.262 B |
193.831 B |
200.922 B |
Source: Financial Modelling Prep
Technical analysis shows near perfect timing for investment
Fibonacci
As you can see with the declining Fibonacci trend line, the current stock price of Salesforce has broken through this trend line. This could mark a near-perfect timing for an excellent entry of positions to take an upward-moving stock price.
fibonacci sales force (custom platform)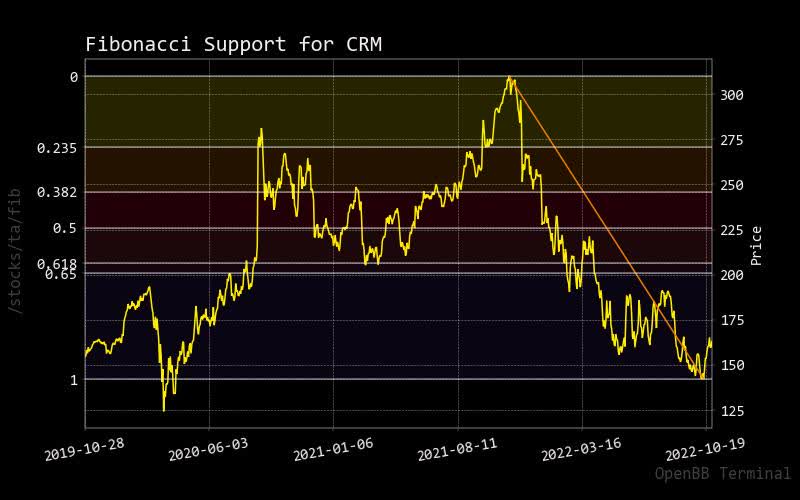
Bollinger Bonds
As you can see in the Bollinger bands, the Salesforce stock price has quickly increased while the upper guide is trying to keep up. One needs to calculate how long this uptrend will be sustainable but based on solid fundamentals, it could be long-term.
bollinger salesforce (custom trading platform)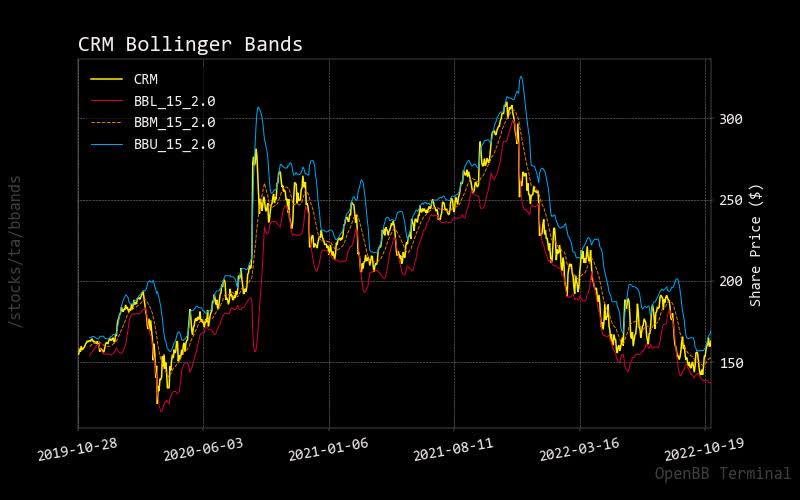
MACD
As CRM stock price approaches the zero line, it confirms near-perfect timing to take positions like the Fibonacci trend line. Also, the compressed MACD yellow line shows that the decline is not as steep as other stocks in this software sector.
macd crm (custom platform)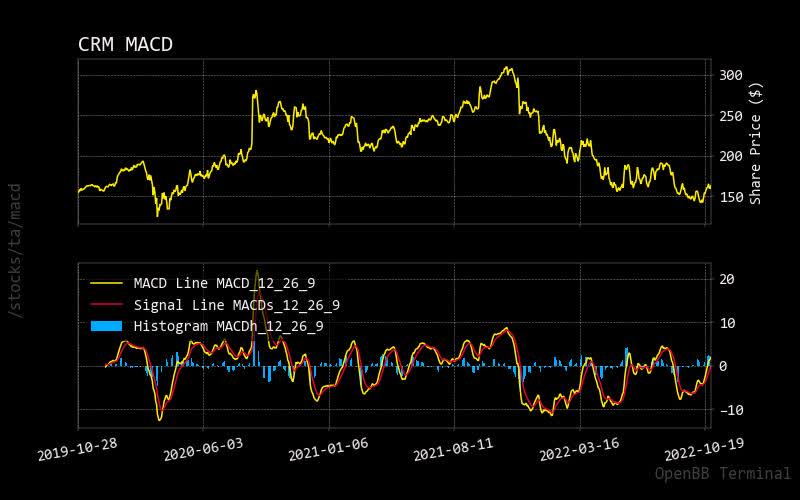
RSI
As this relative strength indicator shows, the current Salesforce stock price is pushing toward overbought. Looking at the history of this trend, it only lasts for a short time, meaning the stock price uptrend might be more temporary. However, if there is no fear of missing out on trading, Salesforce stock price should increase slowly but still outperform the average American major stock indices.
rsi salesforce (custom platform )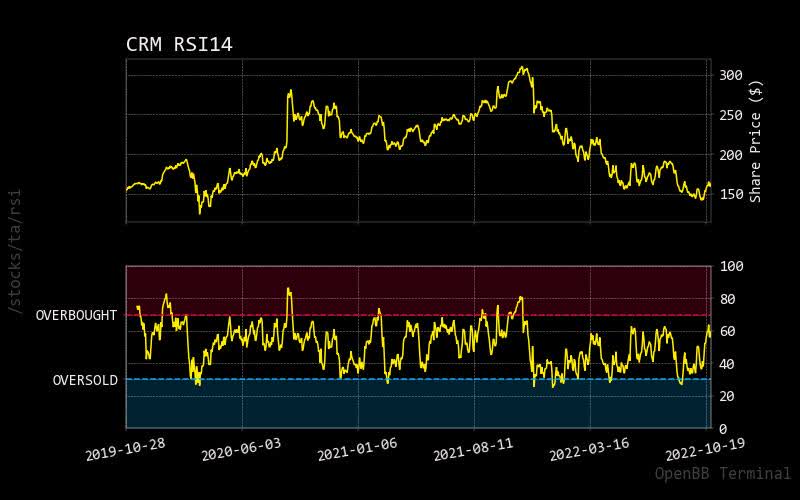
Prediction via AI
Monte Carlo
This Monte Carlo simulation shows many trending predictive paths to show an expected stock price increase over the long run. Judging from the right side of the current price of the normalized distribution chart, the anticipated stock price increase should be reasonable. It also shows that the predicted stock price would move up, nonetheless.
montecarlo salesforce (custom platform)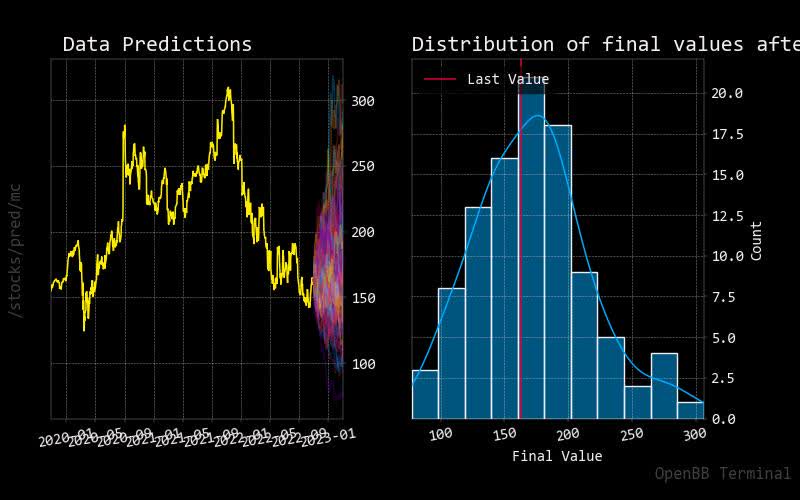
Regression
The regression red line is forecasted over the next 30 days and shows a solid uptrend to confirm the Monte Carlo simulation and normalized distribution. This will convince any short-term trader that Salesforce may be a stock worth holding.
regression salesforce (custom platform)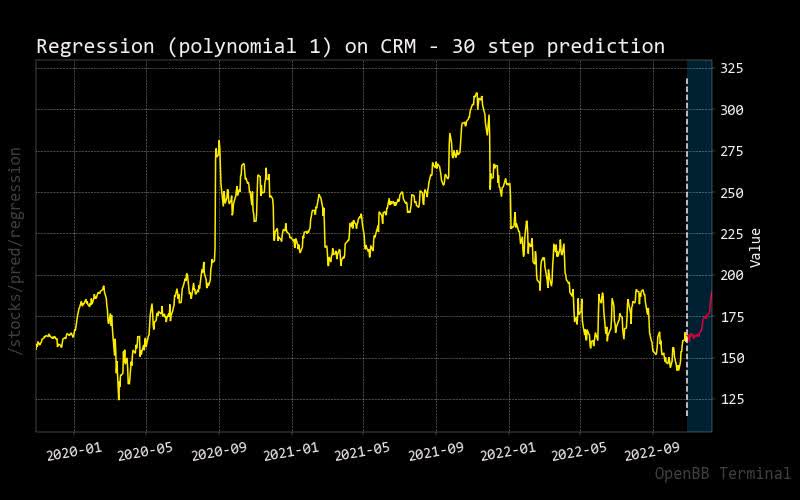
Risk should be low despite insider selling of CEO
Price vs. Short Volume
As hinted in this report, there appears to be more short selling against the total volume traded. Would it be related to the number of shares sold off by the CEO over the last few weeks?
short salesforce (custom platform)
Insider
Insider Stats
Although there are solid fundamentals and technicals with confirmation in artificial intelligence, it should be quite concerning to see contradictory moves of both the CFO and CEO selling off stock last month. What does this tell you? What do they know that we don’t?
|
Unnamed: 0 |
X |
Filing Date |
Trading Date |
Ticker |
Insider |
Title |
Trade Type |
Price |
Quantity |
Owned |
Delta Own |
Value |
|
0 |
D |
2022-10-28 16:33:06 |
2022-10-27 |
CRM |
Benioff Marc |
Chair, Co-CEO |
S – Sale+OE |
$161.39 |
-2,300 |
27,761,368 |
0% |
-$371,190 |
|
1 |
D |
2022-10-27 17:24:53 |
2022-10-26 |
CRM |
Benioff Marc |
Chair, Co-CEO |
S – Sale+OE |
$161.51 |
-2,300 |
27,761,368 |
0% |
-$371,472 |
|
2 |
D |
2022-10-26 17:16:33 |
2022-10-25 |
CRM |
Benioff Marc |
Chair, Co-CEO |
S – Sale+OE |
$164.26 |
-2,300 |
27,761,368 |
0% |
-$377,797 |
|
3 |
D |
2022-10-25 18:50:10 |
2022-10-24 |
CRM |
Weaver Amy E |
Pres, CFO |
S – Sale+OE |
$160.25 |
-510 |
31,893 |
-2% |
-$81,728 |
|
4 |
D |
2022-10-25 18:46:13 |
2022-10-24 |
CRM |
Taylor Bret Steven |
Vice Chair of the Board, CEO |
S – Sale+OE |
$160.25 |
-612 |
1,134,630 |
0% |
-$98,073 |
|
5 |
D |
2022-10-25 18:43:07 |
2022-10-24 |
CRM |
Tallapragada Srinivas |
Pres, Chief Engineering Office |
S – Sale+OE |
$160.25 |
-560 |
50,228 |
-1% |
-$89,740 |
|
6 |
D |
2022-10-25 18:39:56 |
2022-10-24 |
CRM |
Reddy Sundeep G. |
EVP, Chief Accounting Officer |
S – Sale+OE |
$160.25 |
-653 |
1,037 |
-39% |
-$104,643 |
|
7 |
D |
2022-10-25 18:36:27 |
2022-10-24 |
CRM |
Millham Brian |
Pres, COO |
S – Sale+OE |
$160.25 |
-329 |
7,002 |
-4% |
-$52,722 |
|
8 |
D |
2022-10-25 18:32:52 |
2022-10-24 |
CRM |
Hyder Brent |
Pres, Chief People Officer |
S – Sale+OE |
$160.25 |
-781 |
6,016 |
-11% |
-$125,155 |
|
9 |
D |
2022-10-25 18:30:11 |
2022-10-24 |
CRM |
Harris Parker |
Co-Founder, CTO |
S – Sale+OE |
$160.25 |
-560 |
1,975,692 |
0% |
-$89,740 |
Source: Open Insider
Insider Activity
Once again, U.S. investors should be questioning why the CEO has been selling off so much stock in the last few weeks. It contradicts all of the analysis done in this report.
|
Date |
Shares Traded |
Shares Held |
Price |
Type |
Option |
Insider |
Trade |
|
2022-10-21 |
1,115.00 |
50,788.00 |
nan |
Buy |
No |
Benioff Marc |
1115.0 |
|
2022-10-23 |
526.00 |
6,271.00 |
160.25 |
Sell |
No |
Benioff Marc |
-526.0 |
|
2022-10-23 |
255.00 |
6,016.00 |
160.25 |
Sell |
No |
Benioff Marc |
-255.0 |
|
2022-10-23 |
653.00 |
1,037.00 |
160.25 |
Sell |
No |
Benioff Marc |
-653.0 |
|
2022-10-23 |
329.00 |
7,002.00 |
160.25 |
Sell |
No |
Benioff Marc |
-329.0 |
|
2022-10-23 |
612.00 |
900,172.00 |
160.25 |
Sell |
No |
Benioff Marc |
-612.0 |
|
2022-10-23 |
510.00 |
31,893.00 |
160.25 |
Sell |
No |
Benioff Marc |
-510.0 |
|
2022-10-23 |
560.00 |
95,155.00 |
160.25 |
Sell |
No |
Benioff Marc |
-560.0 |
|
2022-10-23 |
560.00 |
50,228.00 |
160.25 |
Sell |
No |
Benioff Marc |
-560.0 |
|
2022-10-23 |
427.00 |
27,763,241.00 |
159.22 |
Sell |
No |
Benioff Marc |
-427.0 |
|
2022-10-23 |
932.00 |
27,762,309.00 |
160.3 |
Sell |
No |
Benioff Marc |
-932.0 |
|
2022-10-23 |
2,300.00 |
27,763,668.00 |
80.99 |
Buy |
No |
Benioff Marc |
2300.0 |
|
2022-10-23 |
941.00 |
27,761,368.00 |
161.07 |
Sell |
No |
Benioff Marc |
-941.0 |
|
2022-10-24 |
421.00 |
27,763,247.00 |
162.56 |
Sell |
No |
Benioff Marc |
-421.0 |
|
2022-10-24 |
490.00 |
27,762,757.00 |
163.6 |
Sell |
No |
Benioff Marc |
-490.0 |
|
2022-10-24 |
818.00 |
27,762,429.00 |
164.7 |
Sell |
No |
Tallapragada Srinivas |
-818.0 |
|
2022-10-24 |
571.00 |
27,761,368.00 |
165.46 |
Sell |
No |
Harris Parker |
-571.0 |
|
2022-10-24 |
2,300.00 |
27,763,668.00 |
80.99 |
Buy |
No |
Weaver Amy E |
2300.0 |
|
2022-10-25 |
2,300.00 |
27,763,668.00 |
80.99 |
Buy |
No |
Taylor Bret Steven |
2300.0 |
|
2022-10-25 |
281.00 |
27,763,387.00 |
159.5 |
Sell |
No |
Millham Brian |
-281.0 |
|
2022-10-25 |
742.00 |
27,762,645.00 |
160.17 |
Sell |
No |
Reddy Sundeep G. |
-742.0 |
|
2022-10-25 |
263.00 |
27,762,382.00 |
161.21 |
Sell |
No |
Hyder Brent |
-263.0 |
|
2022-10-25 |
270.00 |
27,762,112.00 |
162.49 |
Sell |
No |
Hyder Brent |
-270.0 |
|
2022-10-25 |
681.00 |
27,761,431.00 |
163.3 |
Sell |
No |
Benioff Marc |
-681.0 |
|
2022-10-25 |
63.00 |
27,761,368.00 |
163.94 |
Sell |
No |
Tallapragada Srinivas |
-63.0 |
Source: BusinessInsider
Price Target
Many market research analysts were hoping for a higher stock price target that CRM would achieve. Instead, Salesforce has declined but not as much as other comparable stocks in the same sector. When will Salesforce bottom out to build back momentum for a long-term uptrend as it has in the last five years?
target salesforce (custom platform)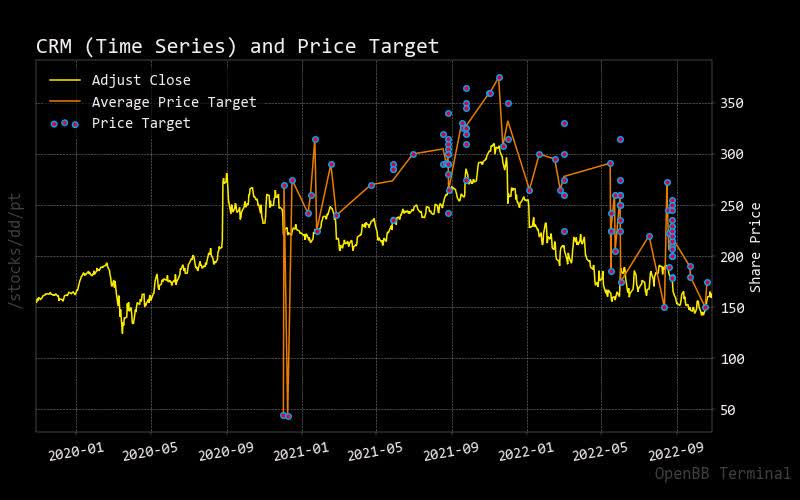
Sustainability
Salesforce is interested in something other than becoming a green-friendly company with its underperforming sustainability rating.
|
Unnamed: 0 |
Value |
|
Social score |
6.39 |
|
Peer count |
105 |
|
Governance score |
4.46 |
|
Total esg |
13.18 |
|
Highest controversy |
2 |
|
ESG performance |
UNDER_PERF |
|
Percentile |
6.62 |
|
Peer group |
Software & Services |
|
Environment score |
2.34 |
Source: Yahoo Finance
Recommendation
With CRM solid and robust guidance estimates, it’s no wonder you see these strong buy ratings.
|
Interval |
RECOMMENDATION |
BUY |
SELL |
NEUTRAL |
|
One month |
BUY |
15 |
1 |
10 |
|
One week |
BUY |
14 |
3 |
9 |
|
One day |
STRONG_BUY |
16 |
0 |
10 |
Source: Trading View
Conclusion
Despite selling off stock by the CEO and CFO recently, CRM stock has proven itself over the long run. With stable fundamentals and the near-perfect timing for market entries, CRM would get a substantial rating but instead only receives a general buy rating. It would be wise for upper management to explain the selling activity among its executives to boost this rating to enhance confidence in this stock.
Be the first to comment