

risamay/iStock via Getty Images
LCNB Corp.’s (NASDAQ:LCNB) loan growth will most probably revert to the historical average soon, which will support earnings through the end of 2023. Further, the margin will likely slightly expand in response to the strong surge in market interest rates. Overall, I’m expecting LCNB to report earnings of $1.77 per share for 2022 and $1.84 per share for 2023. The company is currently offering a high forward dividend yield of over 5%. Further, the year-end target price suggests a high upside from the current market price. Based on the total expected return, I’m adopting a buy rating on LCNB Corp.
Ohio’s Economy to Keep Loan Growth at a Normal Level
The loan book declined by 0.5% in the second quarter of 2022, resulting in loan growth of only 0.3% for the first half of the year. Going forward, loan growth will likely increase to the historical norm of the low-to-mid-single-digit range. Economic factors will likely play a key role in loan growth normalization. LCNB serves customers and businesses in Southwest and South-Central Ohio. Further, the loan book is concentrated in commercial real estate loans, which made up 66% of total loans at the end of June 2022. As a result, the economic activity in Ohio is directly linked to LCNB’s loan growth. As indicated by the coincident economic activity index, the state’s economy is doing quite well.
Federal Reserve Bank of Philadelphia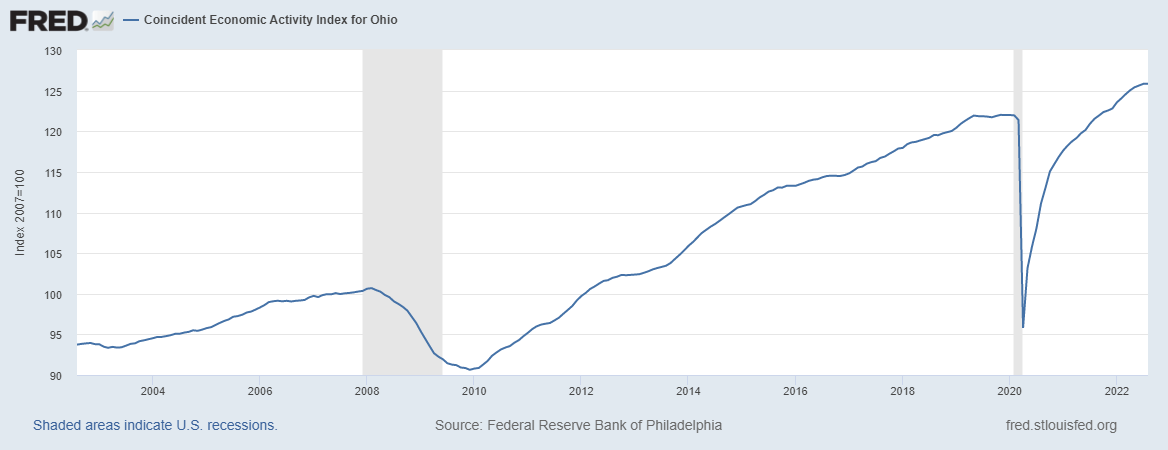
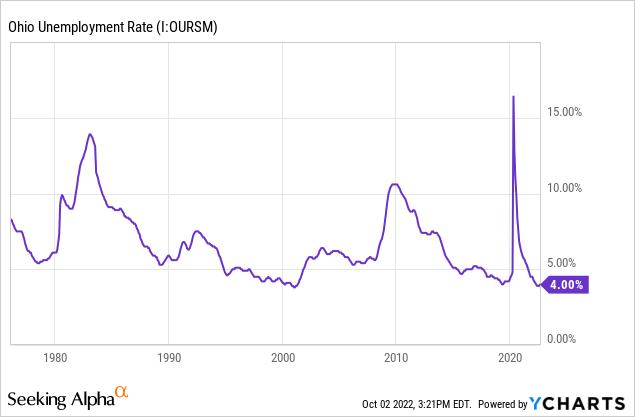
Further, the state’s unemployment rate is near multi-decade lows, which again bodes well for loan growth.
Considering these factors, I’m expecting the loan portfolio to increase by 0.75% every quarter till the end of 2023. Meanwhile, I’m expecting other balance sheet items to grow mostly in line with loans. The following table shows my balance sheet estimates.
| FY18 | FY19 | FY20 | FY21 | FY22E | FY23E | |
| Financial Position | ||||||
| Net Loans | 1,195 | 1,239 | 1,294 | 1,364 | 1,388 | 1,430 |
| Growth of Net Loans | 41.3% | 3.8% | 4.4% | 5.4% | 1.8% | 3.0% |
| Other Earning Assets | 274 | 214 | 253 | 337 | 345 | 355 |
| Deposits | 1,301 | 1,348 | 1,455 | 1,629 | 1,684 | 1,735 |
| Borrowings and Sub-Debt | 103 | 46 | 28 | 16 | 37 | 38 |
| Common equity | 219 | 228 | 241 | 239 | 209 | 220 |
| Book Value Per Share ($) | 18.3 | 17.4 | 18.6 | 19.3 | 18.4 | 19.4 |
| Tangible BVPS ($) | 13.0 | 12.6 | 13.8 | 14.3 | 13.0 | 14.0 |
|
Source: SEC Filings, Author’s Estimates (In USD million unless otherwise specified) |
Limited Margin Expansion Likely
The average earning-asset yield appears only moderately rate-sensitive. As mentioned in the 10-Q filing, most commercial real estate loans are based on adjustable rates with adjustment rates ranging from 1 to 10 years. At the same time, the deposit beta is quite high because the deposit book is heavy on interest-bearing deposits that reprice frequently, namely Negotiable Order of Withdrawal, Money Fund deposits, and Savings accounts. These deposits made up 58% of total deposits during the second quarter of the year.
Due to the combination of loan and deposit betas, the net interest margin is barely rate-sensitive. The results of the management’s interest rate sensitivity analysis given in the 10-Q filing show that a 200-basis points hike in interest rates can boost the net interest income by only 1.99% over twelve months.
2Q 2022 10-Q Filing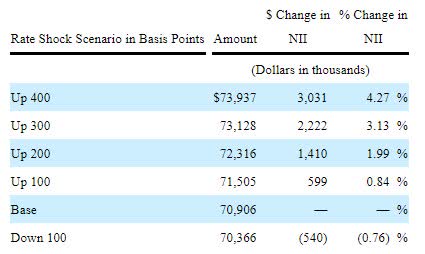
Considering these factors, I’m expecting the margin to increase by five basis points in the second half of 2022 and another five basis points in 2023.
Normalized Provisioning Likely Through the end of 2023
LCNB’s non-performing loans dropped to 0.04% of total loans by the end of June 2022 from 0.25% at the end of June 2021. Meanwhile, the allowance level remained stable during this one-year long period. In my opinion, the heightened inflation environment can increase the non-performing loan level in the coming quarters. However, non-performing loans are unlikely to surpass last year’s level.
Around 89% of total loans were backed by real estate at the end of June 2022. Therefore, the portfolio’s credit risk is somewhat low. However, commercial real estate loans have uncomfortably high loan-to-value ratios. As mentioned in the 10-Q filing, LCNB generally originates commercial real estate loans with a 75% to 85% maximum loan-to-appraised-value ratio.
Considering these factors, I’m expecting the net provision expense to return to the historical norm in the next year and a half. I’m expecting the net provision expense to make up around 0.04% of total loans (annualized) in every quarter till the end of 2023, which is the same as the average from 2017 to 2019.
Expecting Earnings per Share to Grow by 7%
The anticipated loan additions and slight margin expansion will likely drive earnings in the next year and a half. On the other hand, provision normalization will restrict earnings growth. Overall, I am expecting earnings to be flattish this year. However, earnings per share will likely grow by 7% because the number of outstanding shares has declined following share buybacks. For 2023, I’m expecting earnings to grow by 4% to $1.84 per share. The following table shows my income statement estimates.
| FY18 | FY19 | FY20 | FY21 | FY22E | FY23E | |||||
| Income Statement | ||||||||||
| Net interest income | 48 | 54 | 56 | 57 | 60 | 64 | ||||
| Provision for loan losses | 1 | 0 | 2 | (0) | 1 | 1 | ||||
| Non-interest income | 11 | 12 | 16 | 16 | 14 | 14 | ||||
| Non-interest expense | 41 | 44 | 46 | 48 | 49 | 52 | ||||
| Net income – Common Sh. | 15 | 19 | 20 | 21 | 20 | 21 | ||||
| EPS – Diluted ($) | 1.24 | 1.44 | 1.55 | 1.66 | 1.77 | 1.84 | ||||
|
Source: SEC Filings, Earnings Releases, Author’s Estimates (In USD million unless otherwise specified) |
||||||||||
Actual earnings may differ materially from estimates because of the risks and uncertainties related to inflation, and consequently the timing and magnitude of interest rate hikes. Further, a stronger or longer-than-anticipated recession can increase the provisioning for expected loan losses beyond my estimates.
LCNB is Offering a High Dividend Yield
LCNB has a long-standing tradition of increasing its dividend in the last quarter of the year. Given the earnings outlook, it’s likely that the company will maintain the dividend trend this year and the next. Therefore, I’m expecting the company to increase its dividend by $0.01 per share in the fourth quarters of 2022 and 2023. As a result, LCNB Corp. is offering a high forward dividend yield of 5.4%. The dividend appears secure due to the following two reasons.
- The earnings and dividend estimates suggest a payout ratio of 46% for 2023, which is below the last five-year average of 49%.
- LCNB’s total capital ratio stood at 12.4% at the end of June 2022, which is above the minimum regulatory requirement of 10.5%. Therefore, there will be no pressure on the dividend payout from capital adequacy requirements.
Adopting a Buy Rating
I’m using the historical price-to-tangible book (“P/TB”) and price-to-earnings (“P/E”) multiples to value LCNB Corp. The stock has traded at an average P/TB ratio of 1.28 in the past, as shown below.
| FY18 | FY19 | FY20 | FY21 | Average | ||
| T. Book Value per Share ($) | 13.0 | 12.6 | 13.8 | 14.3 | ||
| Average Market Price ($) | 18.7 | 17.4 | 14.8 | 17.5 | ||
| Historical P/TB | 1.44x | 1.38x | 1.07x | 1.22x | 1.28x | |
| Source: Company Financials, Yahoo Finance, Author’s Estimates | ||||||
Multiplying the average P/TB multiple with the forecast tangible book value per share of $13.0 gives a target price of $16.6 for the end of 2022. This price target implies a 4.6% upside from the September 30 closing price. The following table shows the sensitivity of the target price to the P/TB ratio.
| P/TB Multiple | 1.08x | 1.18x | 1.28x | 1.38x | 1.48x |
| TBVPS – Dec 2022 ($) | 13.0 | 13.0 | 13.0 | 13.0 | 13.0 |
| Target Price ($) | 14.0 | 15.3 | 16.6 | 17.9 | 19.2 |
| Market Price ($) | 15.9 | 15.9 | 15.9 | 15.9 | 15.9 |
| Upside/(Downside) | (11.8)% | (3.6)% | 4.6% | 12.8% | 21.0% |
| Source: Author’s Estimates |
The stock has traded at an average P/E ratio of around 11.8x in the past, as shown below.
| FY18 | FY19 | FY20 | FY21 | Average | ||
| Earnings per Share ($) | 1.24 | 1.44 | 1.55 | 1.66 | ||
| Average Market Price ($) | 18.7 | 17.4 | 14.8 | 17.5 | ||
| Historical P/E | 15.0x | 12.0x | 9.5x | 10.5x | 11.8x | |
| Source: Company Financials, Yahoo Finance, Author’s Estimates | ||||||
Multiplying the average P/E multiple with the forecast earnings per share of $1.77 gives a target price of $20.9 for the end of 2022. This price target implies a 31.9% upside from the September 30 closing price. The following table shows the sensitivity of the target price to the P/E ratio.
| P/E Multiple | 9.8x | 10.8x | 11.8x | 12.8x | 13.8x |
| EPS 2022 ($) | 1.77 | 1.77 | 1.77 | 1.77 | 1.77 |
| Target Price ($) | 17.4 | 19.1 | 20.9 | 22.7 | 24.5 |
| Market Price ($) | 15.9 | 15.9 | 15.9 | 15.9 | 15.9 |
| Upside/(Downside) | 9.5% | 20.7% | 31.9% | 43.0% | 54.2% |
| Source: Author’s Estimates |
Equally weighting the target prices from the two valuation methods gives a combined target price of $18.8, which implies an 18.2% upside from the current market price. Adding the forward dividend yield gives a total expected return of 23.6%. Hence, I’m adopting a buy rating on LCNB Corp.
Be the first to comment