

Editor’s note: Seeking Alpha is proud to welcome Chronos Investments as a new contributor. It’s easy to become a Seeking Alpha contributor and earn money for your best investment ideas. Active contributors also get free access to SA Premium. Click here to find out more »
Sergei Chuyko
Introduction
KraneShares Global Carbon Strategy ETF (NYSEARCA:KRBN) tracks the IHS Markit’s Global Carbon Index, which gives a broad coverage of the global cap-and-trade carbon allowance market. This is also known as the Compliance Carbon Market (CCM), which is based on government-led impositions on specific industries or sectors of the economy. The index currently covers the major carbon allowance markets: European Union Allowances (EUA), California Carbon Allowances (CCA), the Regional Greenhouse Gas Initiative (RGGI), and United Kingdom Allowances (UKA). The reason for the focus on the above-mentioned markets is simply because of their relatively high liquidity, which allows replicability of the index by funds such as KRBN.
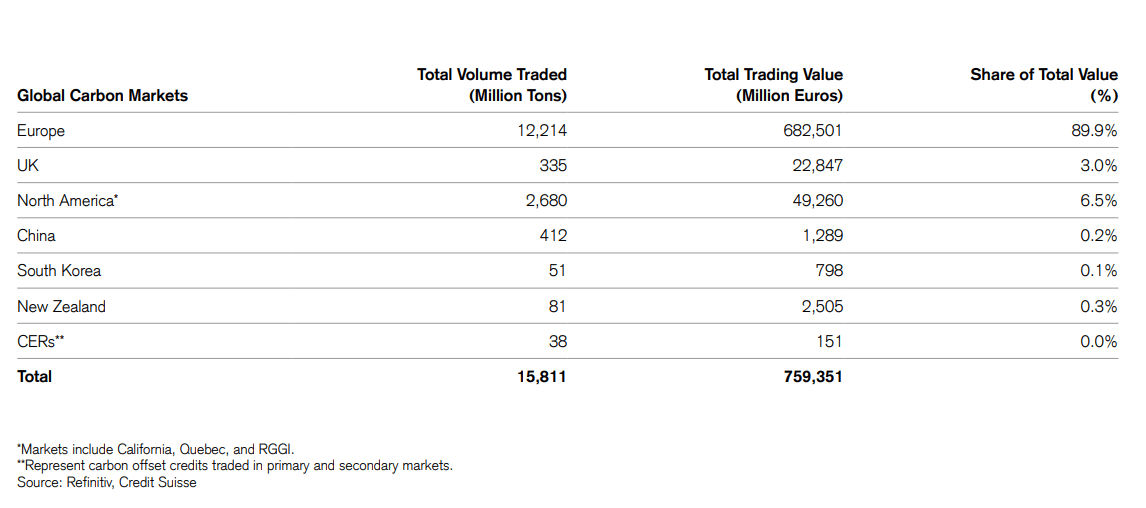
In fact, as the graphs below from Credit Suisse’s report “The Beginning of The Big Carbon Age,” at the end of 2021, the carbon market value was highly concentrated, with the EUA representing roughly 57% of the total CCMs. Furthermore, more than 95% of trading volume was concentrated among the top 3 markets.
Global Compliance Carbon Market Value (Credit Suisse) Global Compliance Trading Value and Trading Volume (Credit Suisse)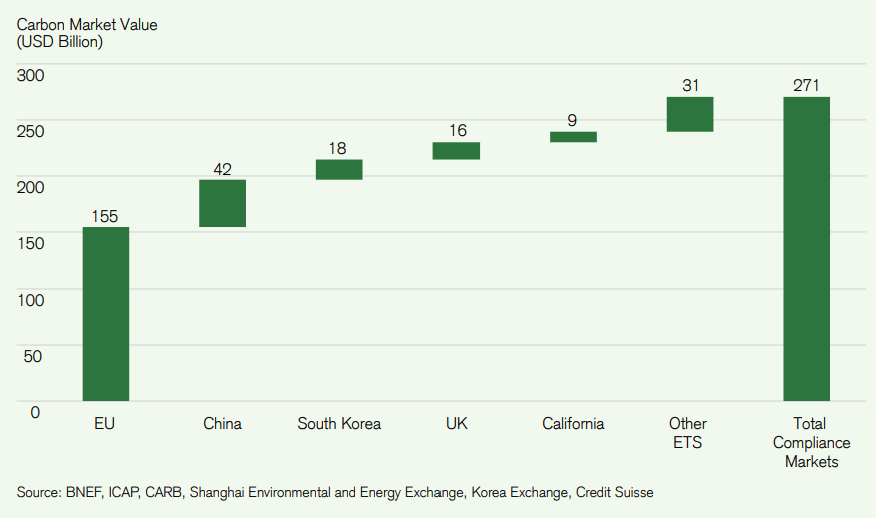
These cap-and-trade mechanisms are usually accessible to retail investors through the future’s market. However, aside from the EUA these can be relatively illiquid and risky if the investor doesn’t have the means to diversify across markets. Another way to get exposure to carbon credits is to invest in companies that either generate or trade carbon credits. Still, indirect exposure through individual companies implies an additional set of risks related to the company’s financials. To have a direct exposure to the carbon credit market, with the benefit of diversification, the best way is to invest in an ETF best way is to invest in an ETF such as KRBN.
Current Prices
EU carbon permits have experienced significant growth in the past years, as shown in the graph below, reaching a peak of about €95/ton in August 2022, in the midst of the Russia-Ukraine war. The European energy crisis is indeed affecting the volatility of carbon prices and their outlook, at least in the near future. As reported by Reuters, analysts have lowered their expectations for 2023 prices from about €80/ton to €70/ton, largely due to the REPowerEU policy currently under discussion. If passed, the EU will sell a larger amount of allowance to raise €20 billion, which would help finance its transition away from Russian fossil fuels. However, the same analysts maintain forecasts for 2025 at an average price of €101/ton, which would represent a growth in excess of 30% relative to current prices.
EU Carbon Permits Price (Trading Economics)
Finally, although there was some speculation on the EU temporarily suspending the cap-and-trade system during the crisis, these have been dispelled by regulators and experts in the sector, as S&P Global reported.
KRBN Allocation
Some information on the KraneShares Global Carbon Strategy ETF (KRBN) before talking about the allocation:
- created on the 30th July 2020,
- expense ratio of 0.78%,
- annual distribution frequency,
- total net assets as of 31/10/2022: $766,916,721
The KraneShares Global Carbon Strategy ETF is largely invested in the EUA and the CCA, which together account for more than 80% of holdings, this reflects of course the IHS Markit’s Global Carbon Index weights, which in turn are a result of the difference ETSs markets sizes, as mentioned above. This can be seen in the figure below, published on the KraneShares website.
KRBN Allocation (KraneShares)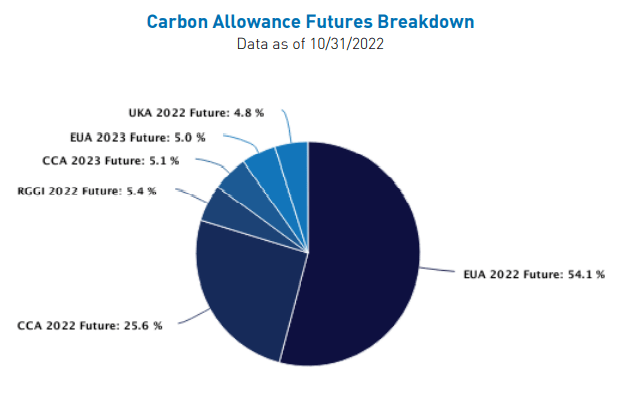
KRBN Risks and Potential upside
Because more than half of the fund is invested in the EUA, the fund is largely exposed to the euro, as the figure below shows. In the current environment this can indeed represent a risk to the fund, since the euro has been experiencing some significant depreciation in the past year due to the region’s very high inflation. If this trend continues, the fund could be penalized. However, the dollar has been appreciating relative to other currencies, which might provide some hedge.
Another risk that the fund faces, as the whole carbon credit market, is that of changes in government regulations and market appetite. In fact there are three main factors that drive prices in cap-and-trade mechanisms:
- Government policy;
- Reduction/increase of supply of credits;
- Growing interest from institutional investors.
The first two points are somewhat interconnected, since the amount of credits available in the compliance market depends on government regulations, with some fluctuations given by investors who purchase credits to use them or sell them at a later stage. These market participants, however, have a relatively low impact on the price of credits, at least for now. Furthermore, as we are seeing during the global energy crisis, and especially the European one, governments are reluctant to abolish these systems. I believe this reluctancy can be understood with three main points:
- They provide good long-term incentives for the economy to become less polluting and stimulate the productivity of companies as they are pushed to maintain or grow output while creating less emissions;
- Carbon credits are today an additional revenue stream for governments, which tends to be difficult to change once achieved;
- As in the case of the EU, the compliance markets are often the result of international efforts and as such tend to be more difficult to change or eliminate.
On the effect of institutional investors on the price of carbon credits, today this is still negligible but can grow hand-in-hand with the market. In fact, the size of the overall CCM is under $300 billion – which is insignificant compared the roughly $61 trillion managed by institutional investors in 2020.
KRBN Currency Exposure (KraneShares)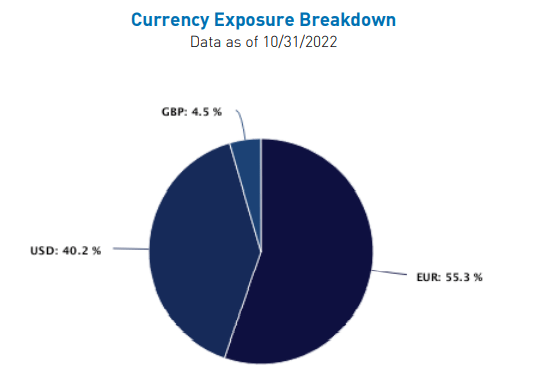
Conclusion
While I see a relatively high volatility in the price of carbon credits in the near future, I think that they could potentially experience a significant upside for investors willing to stay for the long run. As seen before, even considering the recent volatility the price forecast for 2025 for EU carbon credits remains at €101/ton, significantly higher than the current levels. Given the weight this market alone has on KRBN, the price of the ETF will also gain from this increase. Furthermore, countries with a cap-and-trade mechanism in place are continuing to increase the scope of industries covered by such regulations, which would lead to an increased demand for credits and liquidity of the market. Investments in carbon credits can provide a source of uncorrelated returns compared to traditional asset classes, which can spur demand from the investors’ side and be a further driver for price appreciation.
Investors who seek to enter the carbon credits market should enter the market through KRBN as it represents the easiest way to have direct exposure without sacrificing the diversification across markets.
Be the first to comment