Sundry Photography
Investment Thesis
Knight-Swift Transportation (NYSE:KNX) will benefit from increasing freight demand, e-commerce expansion, less-than-truckload shipments, and Intermodal. KNX can provide an excellent return from covered call premiums and dividends even if the stock does not move much.
Knight-Swift Transportation
Knight-Swift Transportation is by far the largest full-truckload carrier in the United States. About 71% of revenue derives from its asset-based trucking business, with full-truckload making up 58% of the total top line and less-than-truckload at 13%. Intermodal accounts for 8% of the company. Knight’s intermodal operations use the Class-I railroads for the underlying movement of its shipping containers and include drayage. The remainder of the revenue reflects various services offered to shippers and third-party truckers, including insurance, equipment maintenance, and equipment leasing.
knight-swift.com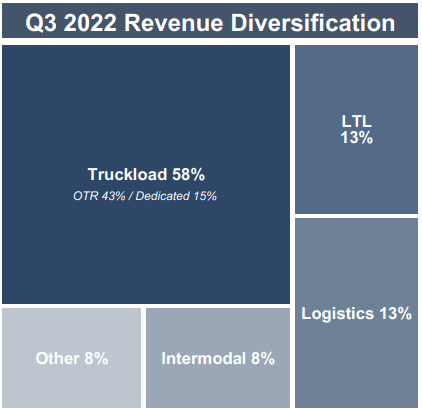
KNX’s top five customers generated 29% of its revenue, one of which is rumored to be Walmart (WMT). KNX derives a significant advantage over other trucking firms through the scale and reach of its national network of freight and logistics terminals. This network often allows KNX to complete truckload shipments to virtually any destination in the contiguous U.S. without relying on third parties (or freight brokerage), which adds cost. KNX’s size allows it to improve employee retention and the driver’s quality of life through its service routes and time away from home. They can provide access to concentrations of trailers in all 48 states. It maximizes supply chain efficiencies, has a very high barrier to entry, and allows KNX to operate trailers at what may very well be the industry’s lowest operating cost per mile. These trailer pools offer customers flexibility in loading and unloading trailers based on their labor availability as opposed to unloading or loading when the truck arrives and the driver is waiting. Since the electronic log mandate nearly four years ago, most loads accrue additional charges to the shipper if not unloaded in two hours when a driver is waiting.
Rail transport typically holds a significant cost advantage over trucking due to greater labor and fuel efficiency. But truck transport typically offers faster delivery times, often making it the mode of choice for more time-sensitive shipments of finished goods in the rapidly growing e-commerce realm. A potential rail workers’ strike would increase profits for trucking companies.
KNX has annual sales above $7.2B with 27.9K employees. They are 94.7% owned by institutions with 6.3% short interest. Their return on equity is 13.4%, and they have a 10.5% return on invested capital. Free cash flow yield per share is 10.8%, and their buyback yield per share is 3.8%. The price-to-book ratio is 1.2. Their Piotroski F-score is 8 indicating a strong company.
Domestic Freight Demand to Grow by 50%
Below is what I have gathered from the November 22, 2021 article published by the Bureau of Transportation Statistics.
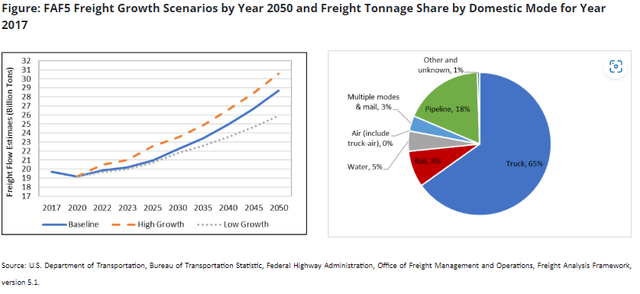
Today, the U.S. Department of Transportation’s Bureau of Transportation Statistics (BTS) and Federal Highway Administration (FHWA) released a new version of freight flows forecast data from the Freight Analysis Framework, the most comprehensive, publicly available national-level dataset of freight movement in the U.S.
New long-term projections released today show that, between 2020 and 2050, U.S. freight activity will grow by fifty percent in tonnage to 28.7 billion tons and double in value to $36.2 trillion (in 2017 dollars). Trucks now represent the predominant freight carrier model and are expected to remain so. Trucks currently carry 65 percent of U.S. freight tonnage. Published FAF5 forecasts provide a range of future freight demands representing three different economic growth scenarios, through 2050, by various modes of transportation. A complete update of the FAF is produced every five years.
KNX is Gaining Profits from Cost-related Acquisition Synergies, LTL, Intermodal Plus New Growth Verticals
In 2017, Knight Transportation and Swift Transportation merged, making Knight-Swift the largest asset-based full-truckload carrier. The MME and AAA Cooper acquisitions in 2021 were another turning point, placing the company into the LTL shipping sector. Management continues to prove its ability to handle acquisitions and gain cost synergies.
Trucking companies are experiencing higher fuel costs, driver wages, and equipment costs. But freight rates and fuel surcharges have increased to counteract the cost increases. Many small trucking firms are expected to downsize over the next year, freeing up drivers and easing pressure on KNX’s wage growth. Driver pay is KNX’s most significant expense, typically consuming around 30% of revenue.
KNX enjoyed excellent demand, strong contract pricing tailwinds, and solid expansion for the truck brokerage and intermodal units. A key growth driver was extremely tight industry capacity, which boosted the firm’s pricing power. Increased e-commerce is still driving incremental truck demand.
Contract rates and retail end-market demand are easing. The supply/demand balance will moderate in 2023 as the temporary rush to restock post-pandemic low inventory levels is winding down. Freight rates are expected to head toward previous averages. It seems customers are moving back toward just in time instead of just in case.
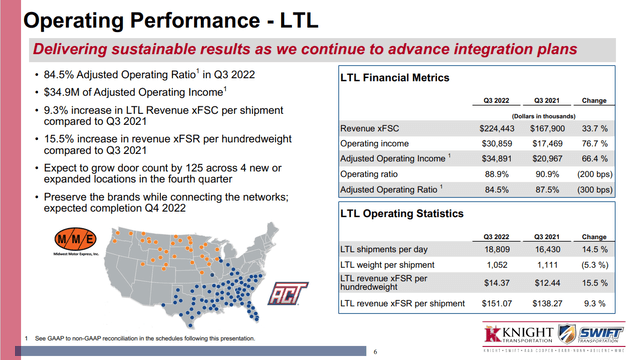
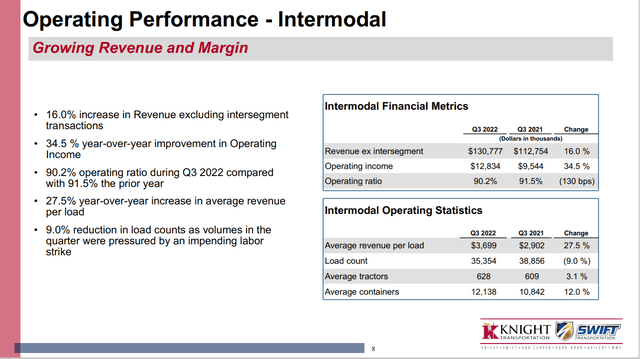
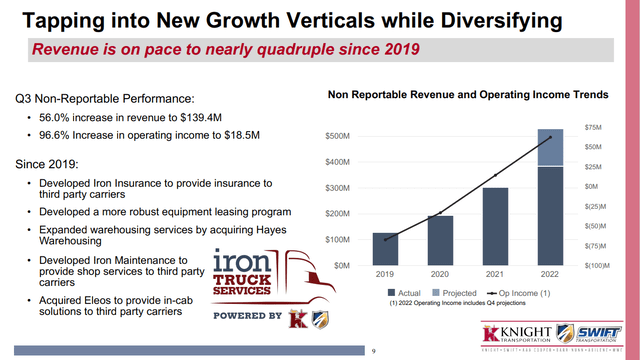
However, KNX shows substantial revenue and profit growth from its Less Than Truckload, Intermodal, and New Growth Verticals, as seen in the charts below. LTL revenue grew 33.7% to $224M in Q3 of 2022 versus Q3 of 2021.
Intermodal revenue grew 16% to $130M in Q3 of 2022 versus Q3 of 2021.
New Growth Verticals’ revenue is set to nearly quadruple since 2019.
Balance Sheet Flexibility
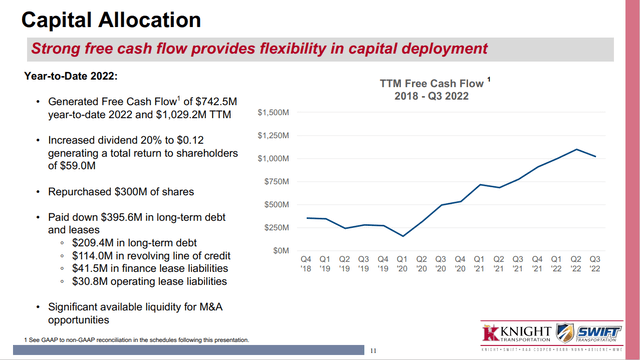
KTX’s balance sheet is in good shape, with a debt-to-EBITDA ratio of 1.1. They are projected to generate over $1B in free cash flow in 2022. This provides flexibility for mergers, acquisitions, organic investment, dividends, and stock buybacks. Year-to-date, KNX used cash to increase their dividend to shareholders by 20%, repurchased $300M worth of shares, and paid down $396M in long-term debt and leases. Since the 2017 Knight Swift Merger, KNX has invested $1.6B in acquisitions.
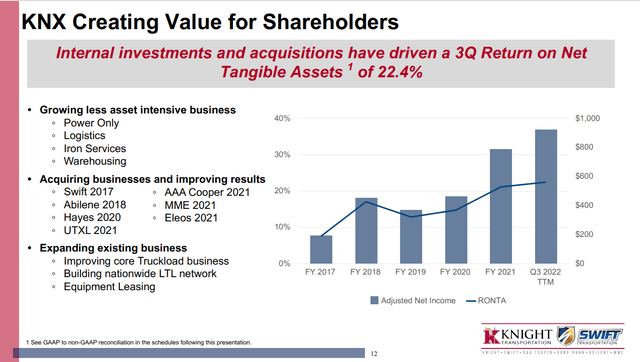
Internal investments are also creating value for shareholders.
Good Technical Entry Point
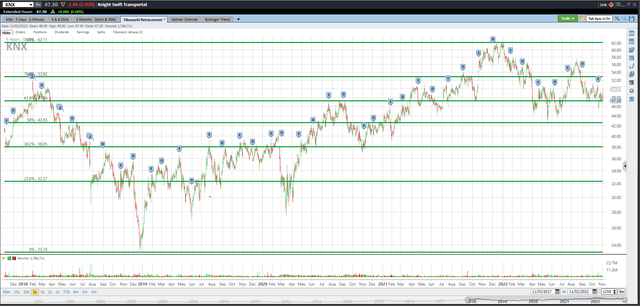
I’ve added the green Fibonacci lines, using the high and low of the past five years for KNX. It’s interesting to note how the market pauses or bounces off these Fibonacci lines. They can be one clue as to where the stock price may be headed. KNX is at the 61.8% Fibonacci retracement level but could go lower. However, I believe that KNX will trade near the 76.4% Fibonacci level of $52.92 by May for the reasons in this article.
The nine most accurate analysts have an average one-year price target of $56.44, indicating a 19% potential upside from the November 2nd closing price of $47.30 if they are correct. Their ratings are mixed with seven buys, one hold, and one sell. Analysts are just one of my indicators, and they are not perfect, but they are usually in the ballpark with estimates. They often seem a bit optimistic, so I suspect prices may end up lower than their one-year targets to be on the safe side.
Trend in Earnings Per Share, P/E Ratio, and Net Profit Margin
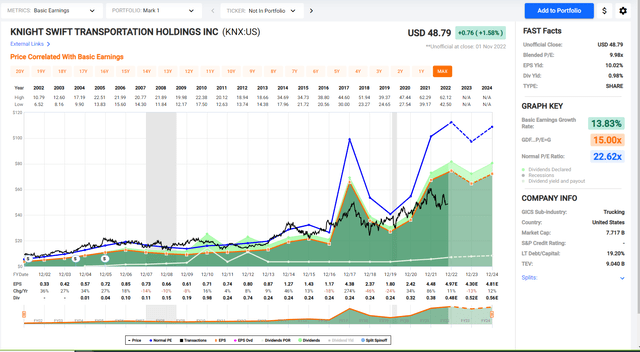
The black line shows KNX’s stock price for the past twenty years. Look at the chart of numbers below the graph to see that KNX earnings grew from $1.80 in 2019 to $2.42 in 2020 and $4.48 in 2021, and they are projected to earn $4.97 in 2022 and $4.30 in 2023.
The P/E ratio for KNX is currently at 10, but the average ratio over the past ten years is 17. I don’t think the P/E will rally back to 17 anytime soon. If KNX earns $4.30 in 2023, the stock could trade at $55.90 if the market assigns only a 13 P/E ratio.
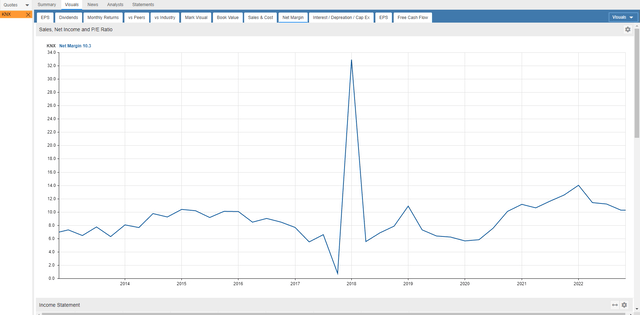
The net profit margin trend has improved since 2013 when it was below 8%. This metric is not at all-time highs but is off the lows and stabilizing above 10%.
Sell Covered Calls
My answer to uncertainty is to sell covered calls on KNX six months out. KTX closed at $47.30 on November 2nd, and May’s $50.00 covered calls are at or near $4.10. One covered call requires 100 shares of stock to be purchased. Selling a May covered call will allow the investor to collect dividends in December and March at $0.12 each. The stock will be called away if it trades above $50.00 on May 19th. It may even be called away sooner if the price exceeds $50.00, but that’s fine since capital is returned sooner.
The investor can earn $410 from call premium, $24 from dividends, and $270 from stock price appreciation. This totals $704 in estimated profit on a $4,730 investment, which is a 27.4% annualized return since the period is 198 days.
If the stock is below $50.00 on May 19th, investors will still make a profit on this trade down to the net stock price of $42.96. Selling covered calls and collecting dividends reduces your risk.
Takeaway
KNX is profiting from cost-related acquisition synergies, LTL, Intermodal, and New Growth Verticals. Demand for its services is increasing. Even if KNX’s stock price only moves from $47.30 to $50.00 by May 19th, a 27.4% potential annualized return is possible, including covered call premiums and dividends.


Be the first to comment