

ipopba
Today, I am looking at Kinsale Capital Group (NYSE:KNSL), a $5.1 B market cap company offering specialty insurance products for allied health, healthcare, entertainment, public sector, and life sciences entities. This stock popped up in two of my screeners, so it occupies two spots in my 202-stock strong watchlist for July.
About the business
Kinsale specializes in the excess and surplus (E&S) market, which means that they write coverages for hard-to-place small and mid-sized business risks. Kinsale focuses on small accounts to ensure strong pricing and maintains absolute control over underwriting and claims management processes. According to the latest IR presentation, Kinsale is the only publicly-traded pure-play E&S company in the US. It is quite a young company, founded only in 2009 and trading on the stock exchange (NYSE) since 2016. It has only 0.8% E&S market share, while Lloyds (LYG) rules with 19.4% and Berkshire Hathaway (BRK.B) (BRK.A) follows with 5.4%.
Kinsale uses a proprietary platform to support the underwriting process and utilizes its wholly-owned broker Aspera.
The product portfolio is presented below.
Kinsale product portfolio (Company’s IR presentation)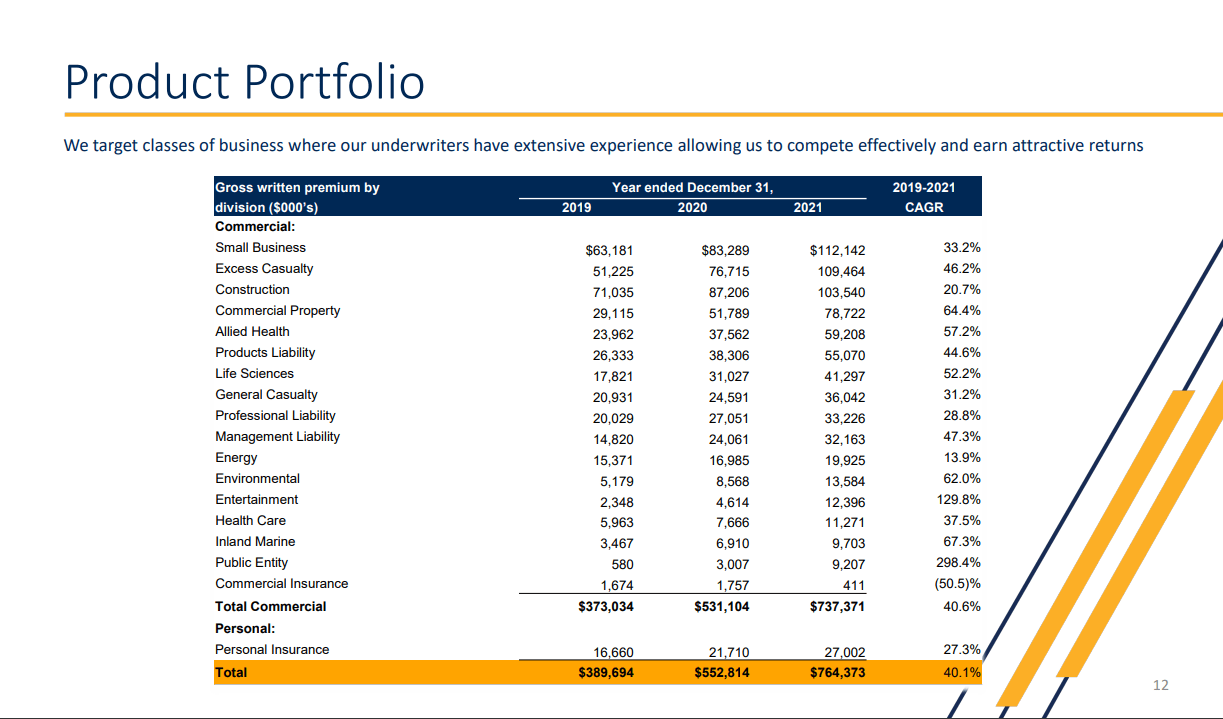
Two divisions that experienced triple-digit growth between 2019 and 2021 have been Public Entity (298% CAGR) and Entertainment (nearly 130% CAGR), which can be explained by the pandemic exposure of these sectors.
The peer group for Kinsale consists of the companies seen below ordered by the EPS growth rate for the last 5 years (data from Finviz), following the list of peers provided in the Kinsale investors’ presentation.
Kinsale peer group (Finviz – selection of stocks taken from company’s IR presentation)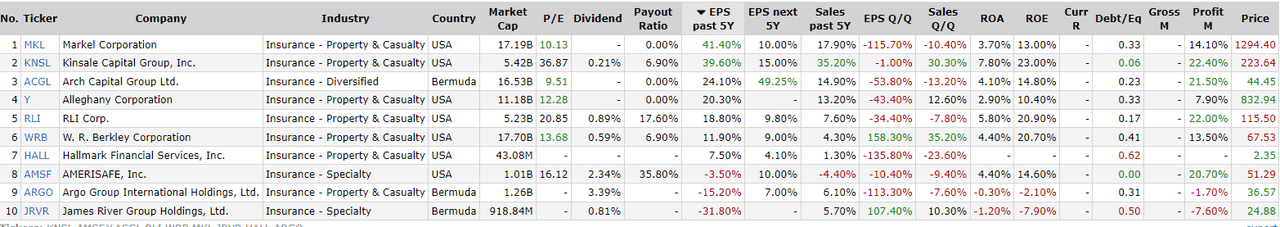
Kinsale has performed very well in comparison to its peers: besides the second-highest EPS 5-year CAGR (39.6%), it has had the best growth in Sales for the last 5 years (35.2% CAGR) and it’s expected to grow at the pace of 15% for the next 5 years. Kinsale has also the highest ROA and ROE of the group (7.8% and 23%, respectively).
According to data presented by the company, amongst the same group of peers, Kinsale is also the most profitable in the terms of combined ratio (the loss ratio added to the expense ratio, the lower result the better).
Combined ratio comparison with peers (Company’s IR presentation)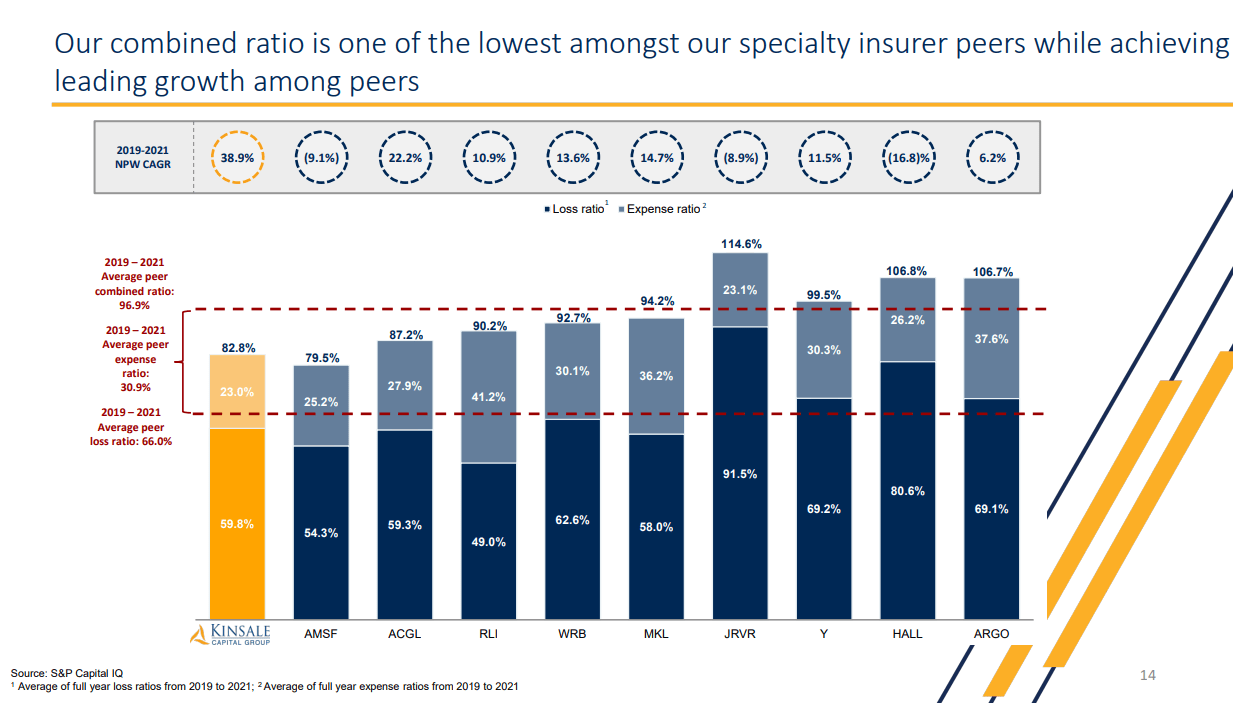
Overall, Kinsale is a growth story in a niche business, with a mind-blowing CAGR of gross written premiums, net operating earnings, and shareholders’ equity.
Growth rates (Company’s IR presentation)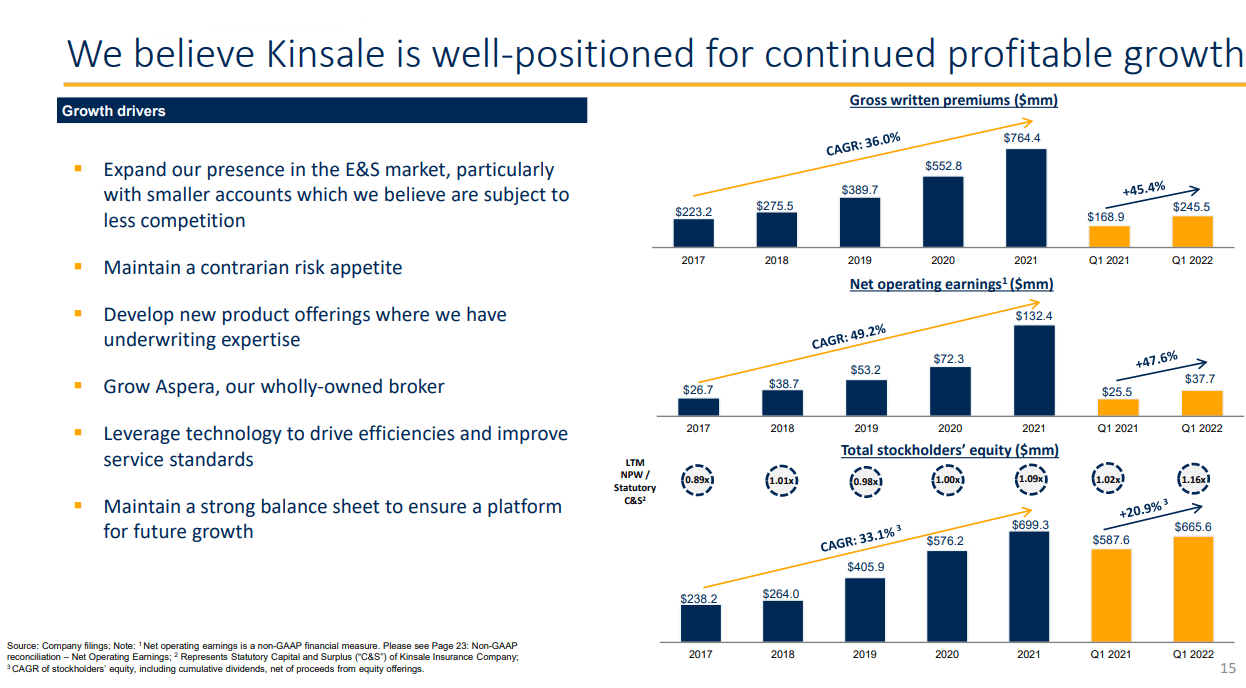
On top of that, they pay a quarterly dividend of $0.13 per share (forward yield of 0.25%).
Technical outlooks
The technical setup for KNSL is looking very inviting. Starting from the monthly chart, its potential upward trend is indicated by the monthly MACD moving above the signal line – moreover, both MACD and the signal are in the positive territory. You can also see on the second pane from the bottom that the CIDI (Composite Index Divergence Indicator – CIDI is based on RSI and two moving averages of RSI) is above both slow (orange) and fast (green) moving averages and has an upward direction. At the same time, the fast MA is crossing above the slow MA, which can mean a stronger duration of an uptrend.
Kinsale monthly chart (TradingView)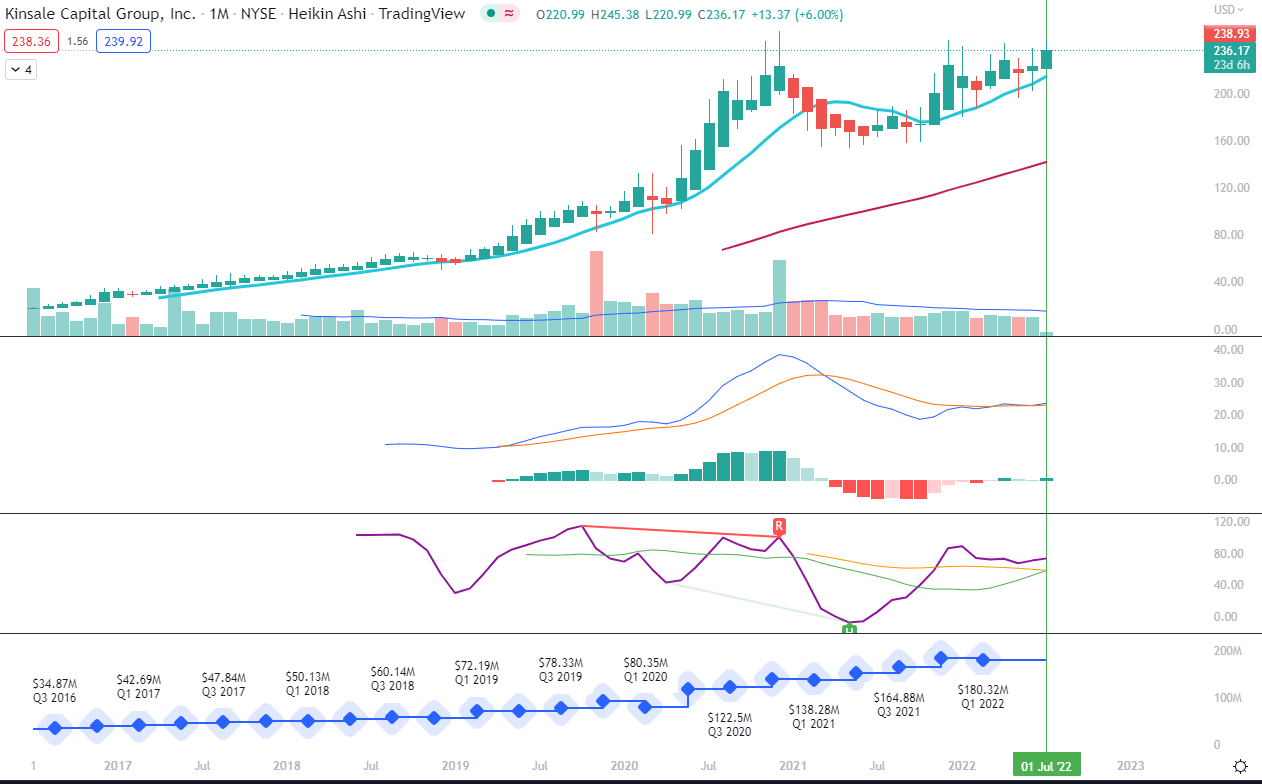
If we move now to the weekly chart, we can also appreciate the Super Trend indicator (chains of red or green pluses above or below the moving averages on the chart), which I use as a trend continuation indicator to avoid choppiness. This line itself gained an uptrend around the end of March (yellow circle). On the lower half of the screenshot, we can see that weekly MACD is now crossing above the signal while CIDI has also crossed above both moving averages.
Kinsale weekly chart (TradingView)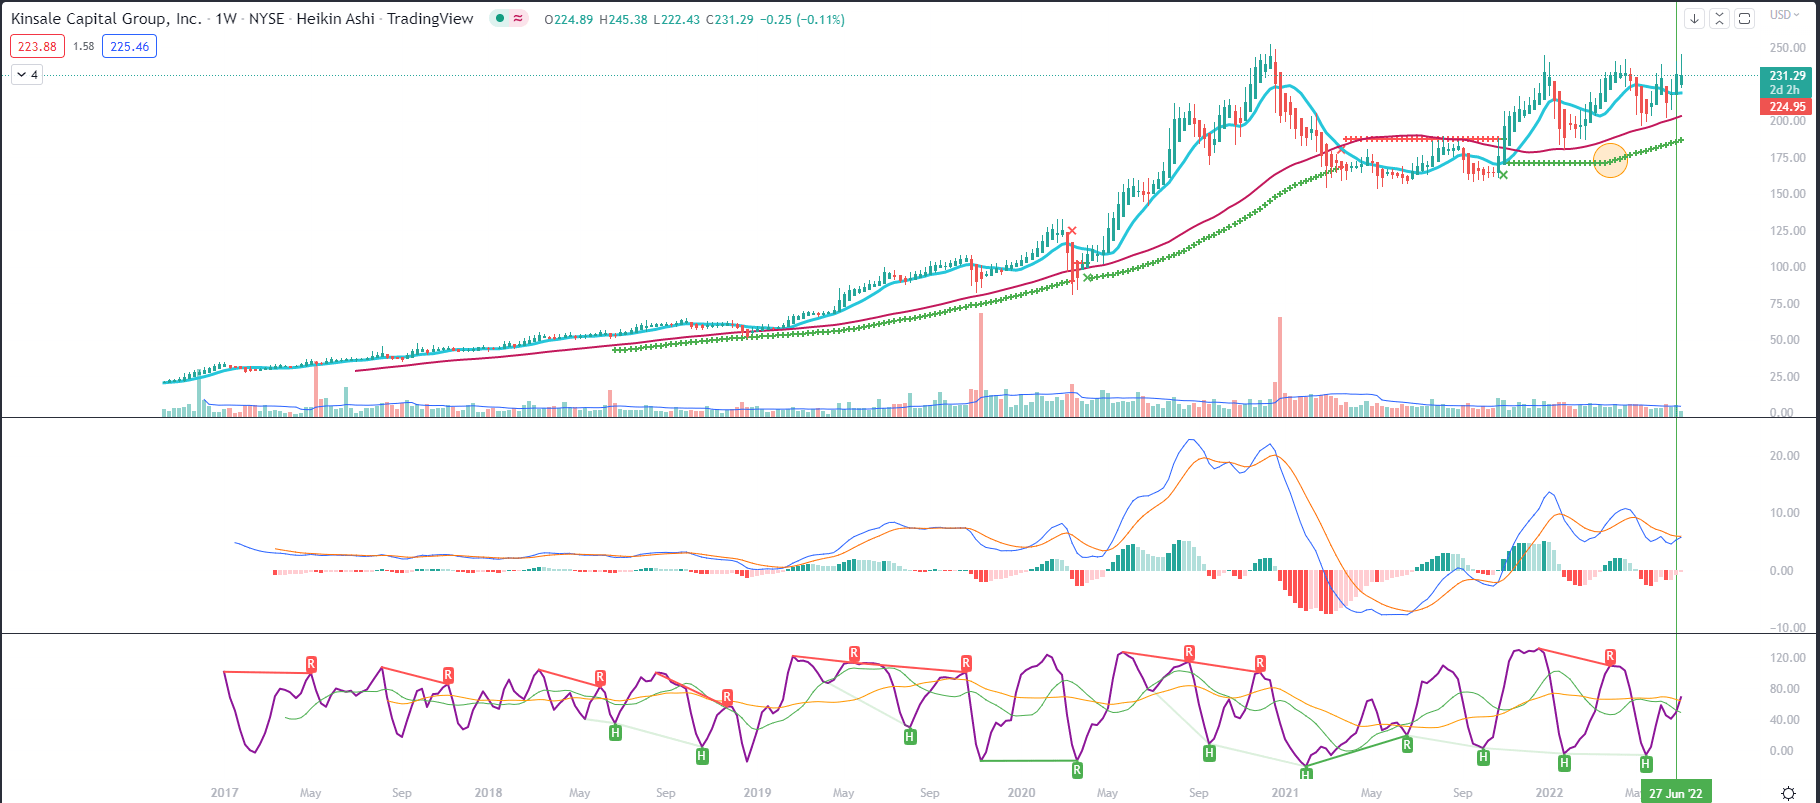
Both monthly and weekly charts are presented in Heikin-Ashi candles – one more tool for the identification of trendiness.
For lower timeframes (daily and 4-hour), I use Renko charts because I find them extremely useful in identifying high probability swings. In comparison to normal Japanese candles (or a Heikin-Ashi variation) that are based on units of time, Renko charts are based on units of the change of price, therefore, they reflect different dynamics. That is also reflected in the values of the indicators that are calculated on the basis of the price units. As you see below, the Heikin-Ashi daily candles chart looks very much different from the Renko daily boxes chart.
Kinsale daily Heikin Ashi vs daily Renko charts (TradingView)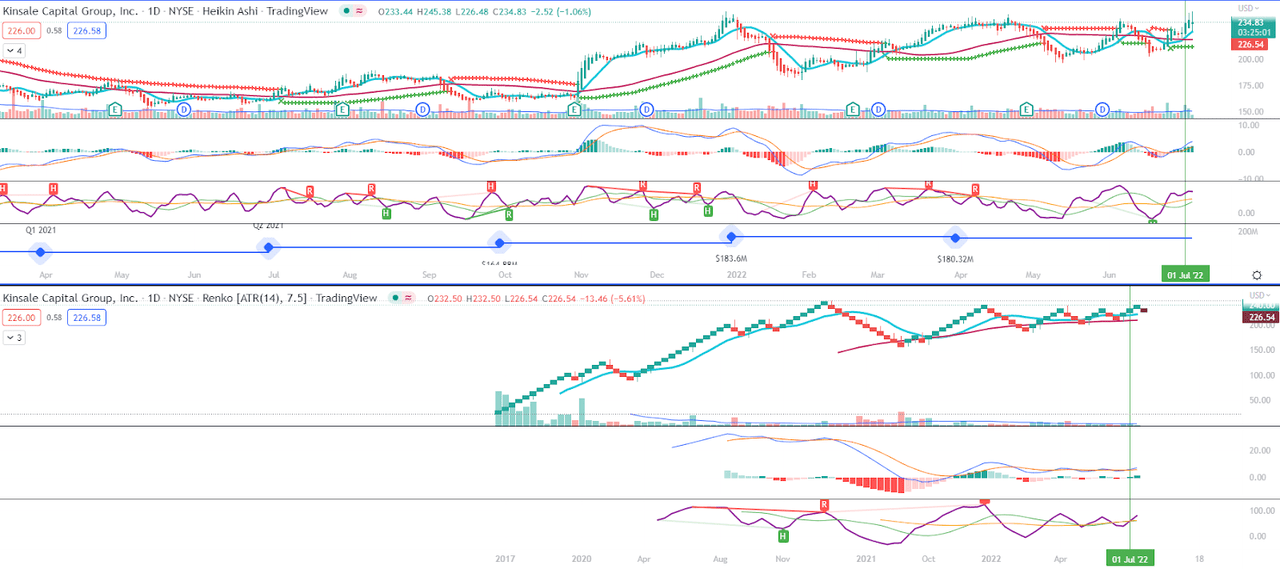
Let’s zoom in on the latter. On this daily Renko chart, we see that both MACD and CIDI are directed upwards and crossed above their signal lines and moving averages, respectively.
Kinsale daily Renko chart (TradingView)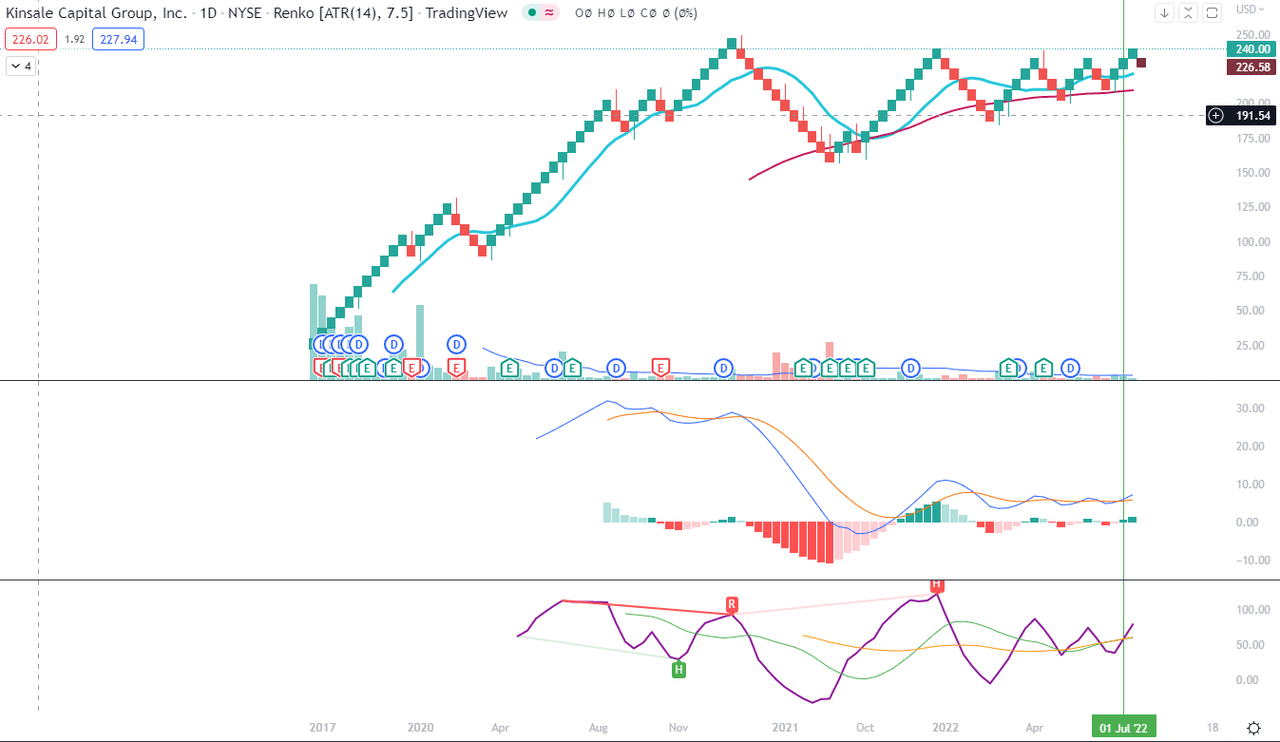
If we lower the frame to 4-hour Renko boxes, we received a bit more detailed picture of swings that can be identified thanks to the MACD on the Renko charts. Moreover, CIDI plays a role of a leading indicator before the MACD crossings take place. If you look at the chart below where I combined weekly Heiken-Ashi with 4-hour Renko, you can find the orange vertical bars at the beginnings of major swings – some minor discrepancies between the dates are due to the Renko boxes construction.
Kinsale weekly Heikin Ashi and 4-hour Renko charts with starts of swings (TradingView)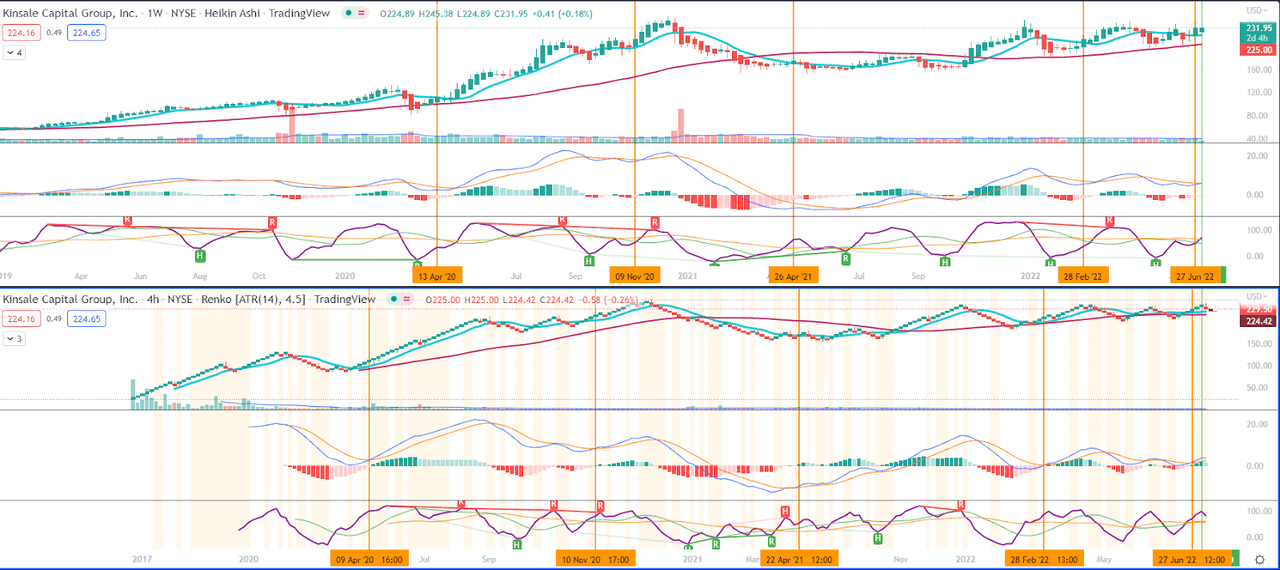
The visualization above considers only going-long interest, but of course, you can apply the same logic to sell decision (monitor CIDI for downwards movement and expect MACD to cross below signal). Unfortunately, it is not possible on TradingView to set up alerts on Renko charts, so these checks need to be done manually or with the help of alerts set on the Heikin-Ashi or other “normal charts”.
What is also worth mentioning is the fact that the stock’s all-time high is $253 and it trades today (July 6) at around $223. Even for the run alone to the all-time high, the upside is worth a minimum of 13.5% – potentially in the matter of a couple of next weeks.
Conclusion
With the sector outlooks growth of written premiums in high-single digits (according to Deloitte report) and in mid-teens for EPS growth for the next 5 years (according to data on Finviz), property and casualty insurance is an interesting sector in itself, where excess and surplus can potentially outperform the traditional insurance lines. Kinsale as a business presents itself as a very agile and modern outfit, while its stock may provide some fear of profit-taking at the resistance line. You may want to wait until seeing the breakout over $253 if you do not want to rely on the technical analysis.
Be the first to comment