

NoDerog
Kimberly-Clark Corporation (NYSE:KMB), a major manufacturer of personal care and tissue products, will report Q3 results on October 25, 2022. The shares have substantially underperformed so far in 2022 and over recent years. KMB has a trailing total return of -17.7% so far in 2022, as compared to -21.9% for the S&P 500 (SPY) and -9.9% for the Consumer Staples Select Sector SPDR ETF (XLP). While a number of major consumer staples companies have been able to navigate the impacts of inflation successfully (e.g. PepsiCo (PEP)), KMB has struggled with maintaining margins as costs of inputs have gone up. The company has struggled to grow earnings since well before inflation surged, however, with the shares delivering almost zero price appreciation over the past 5 years. KMB’s annualized total return over the past 5 years is 2.8% per year, as compared to 7.5% per year for XLP.
5-Year price chart and basic statistics for KMB (Source: Seeking Alpha)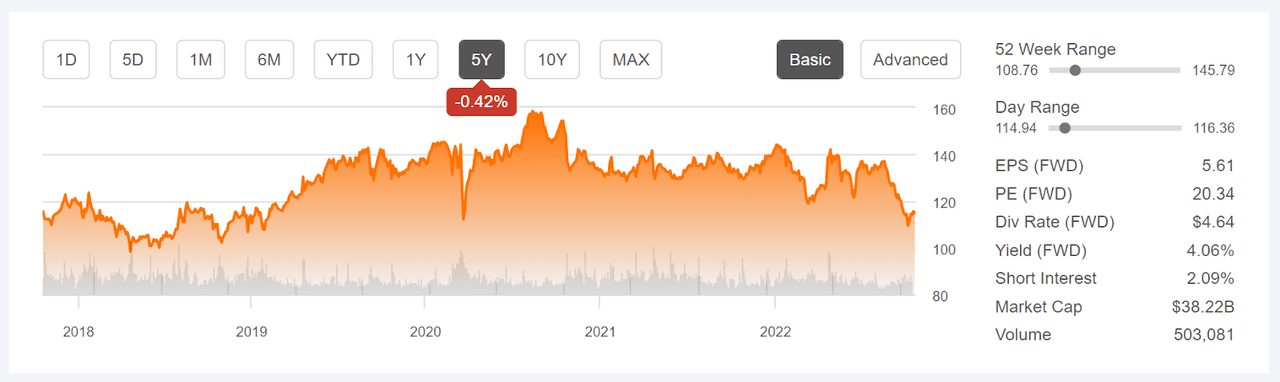
KMB’s earnings have been in decline since mid-2020 and the outlook is for a slow recovery. The consensus estimate is for EPS to grow at an annualized rate of 5.2% per year over the next 3 to 5 years. Management’s strategy (see slide 7) for growing earnings focuses on raising prices to offset inflation and cutting costs.
Historical (3 years) and estimated future quarterly EPS for KMB. Green (red) values are amounts by which EPS beat (missed) the consensus expected value (Source: ETrade)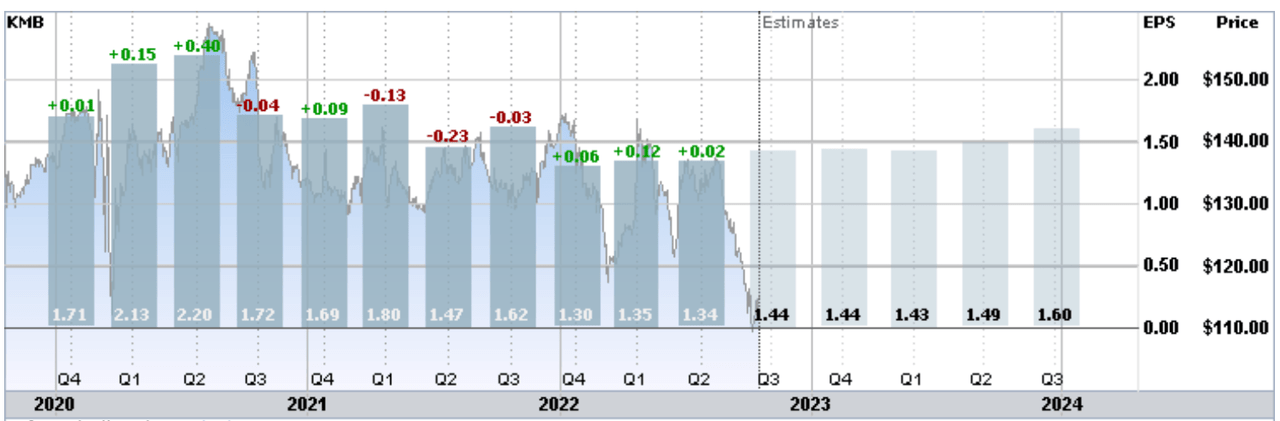
KMB has raised its dividend for 49 consecutive years, which represents an impressive commitment to income investors. The forward dividend yield is 4.06% and the trailing 3-, 5-, and 10-year dividend growth rates are 4.2%, 3.8%, and 5.1% per year, respectively. Assuming that the company can maintain something in this range of dividend growth going forward, the Gordon Growth Model indicates that expected annualized returns of around 8% are reasonable. With the declining earnings and 82% payout ratio, however, maintaining the dividend growth at these levels may be challenging. For context, the trailing 10- and 15-year annualized total returns for KMB are 6% and 6.1% per year, respectively.
An additional property of KMB that is worth considering is the stock’s low beta with respect to the S&P 500, providing risk management benefits for equity allocations. Over the past 3 years (through September of 2022), KMB has a beta of 0.36, even lower than that of the Consumer Staples Select Sector SPDR (XLP), at 0.57.
I last wrote about KMB on November 3, 2021, at which time I maintained a neutral rating on the shares. From the market close on that date until today, KMB has returned a total of -9.6%, as compared to -2.1% for XLP and -18.7% for SPY. As of November 3rd, the earnings decline was evident and the shares were quite expensive relative to earnings, as compared to the previous several years. The Wall Street consensus rating for KMB was neutral, with a consensus 12-month price target that was almost identical to the share price at that time. In other words, the prevailing view among analysts was that there was no expected price appreciation potential over the next year. Along with looking at fundamentals and the Wall Street consensus outlook, I also considered the market-implied outlook, a probabilistic price forecast that represents the consensus view among buyers and sellers of options. The market-implied outlook was neutral with a bullish tilt to early 2022 and neutral with a bearish tilt to the middle of 2022.
For readers who are unfamiliar with the market-implied outlook, a brief explanation is needed. The price of an option on a stock is largely determined by the market’s consensus estimate of the probability that the stock price will rise above (call option) or fall below (put option) a specific level (the option strike price) between now and when the option expires. By analyzing the prices of call and put options at a range of strike prices, all with the same expiration date, it is possible to calculate a probabilistic price forecast that reconciles the options prices. This is the market-implied outlook. For a deeper explanation and background, I recommend this monograph published by the CFA Institute.
With almost a year since I last analyzed KMB and Q3 earnings to be released on October 25th, I have calculated updated market-implied outlooks for KMB and I have compared these with the current Wall Street consensus outlook in revisiting my rating.
Wall Street Consensus Outlook for KMB
ETrade calculates the Wall Street consensus outlook for KMB using ratings and price targets from 10 ranked analysts who have published opinions within the past 3 months. The consensus rating is a hold, as it has been for all of the past year. The consensus 12-month price target is 8.7% above the current share price. For my last analysis, in November of 2021, the consensus 12-month price target was $129. The current expected price appreciation is higher because the share price has fallen more than the price target over the subsequent period.
Wall Street analyst consensus rating and 12-month price target for KMB (Source: ETrade)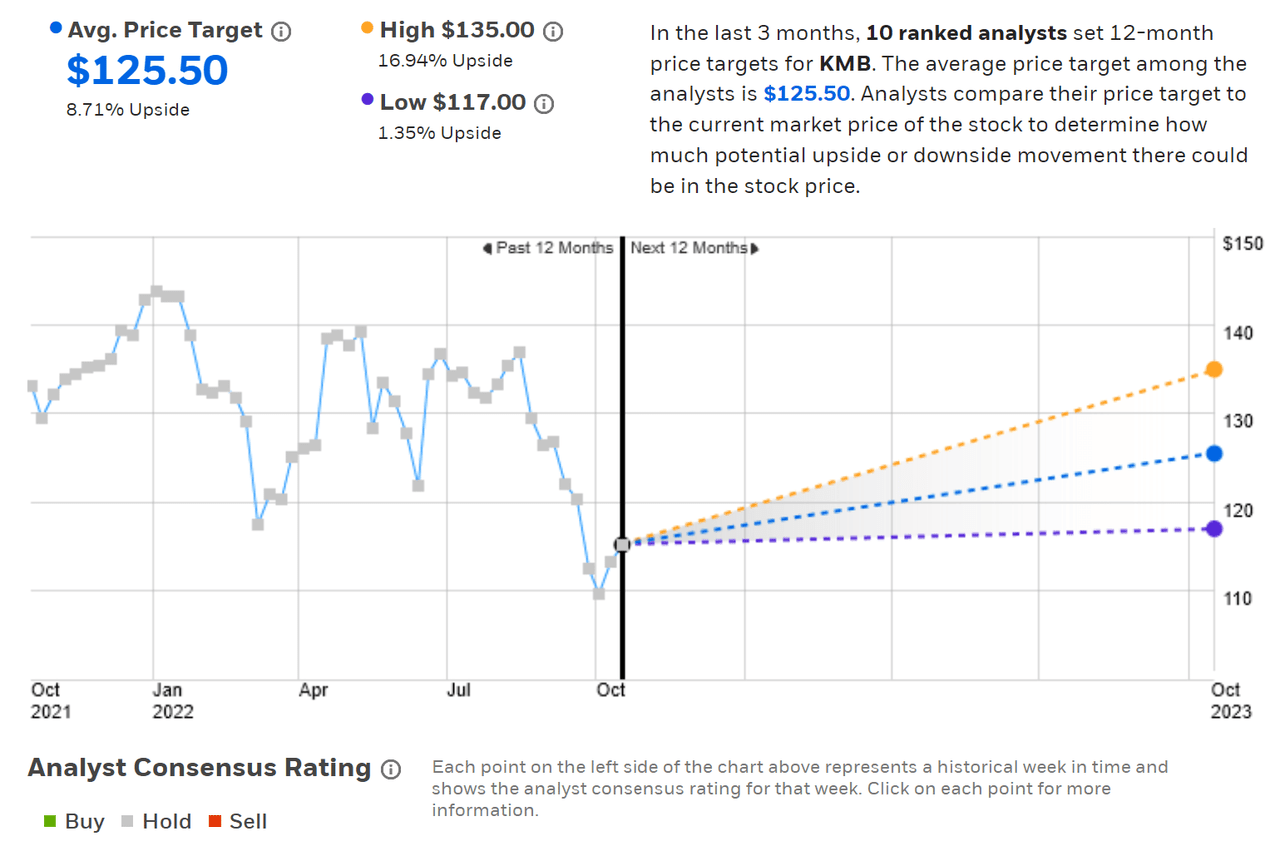
Seeking Alpha’s version of the Wall Street consensus outlook for KMB is calculated using the views of 19 analysts who have published price targets and ratings over the past 90 days. The consensus rating is a hold and the consensus 12-month price target is 9.0% above the current share price.
Wall Street analyst consensus rating and 12-month price target for KMB (Source: Seeking Alpha)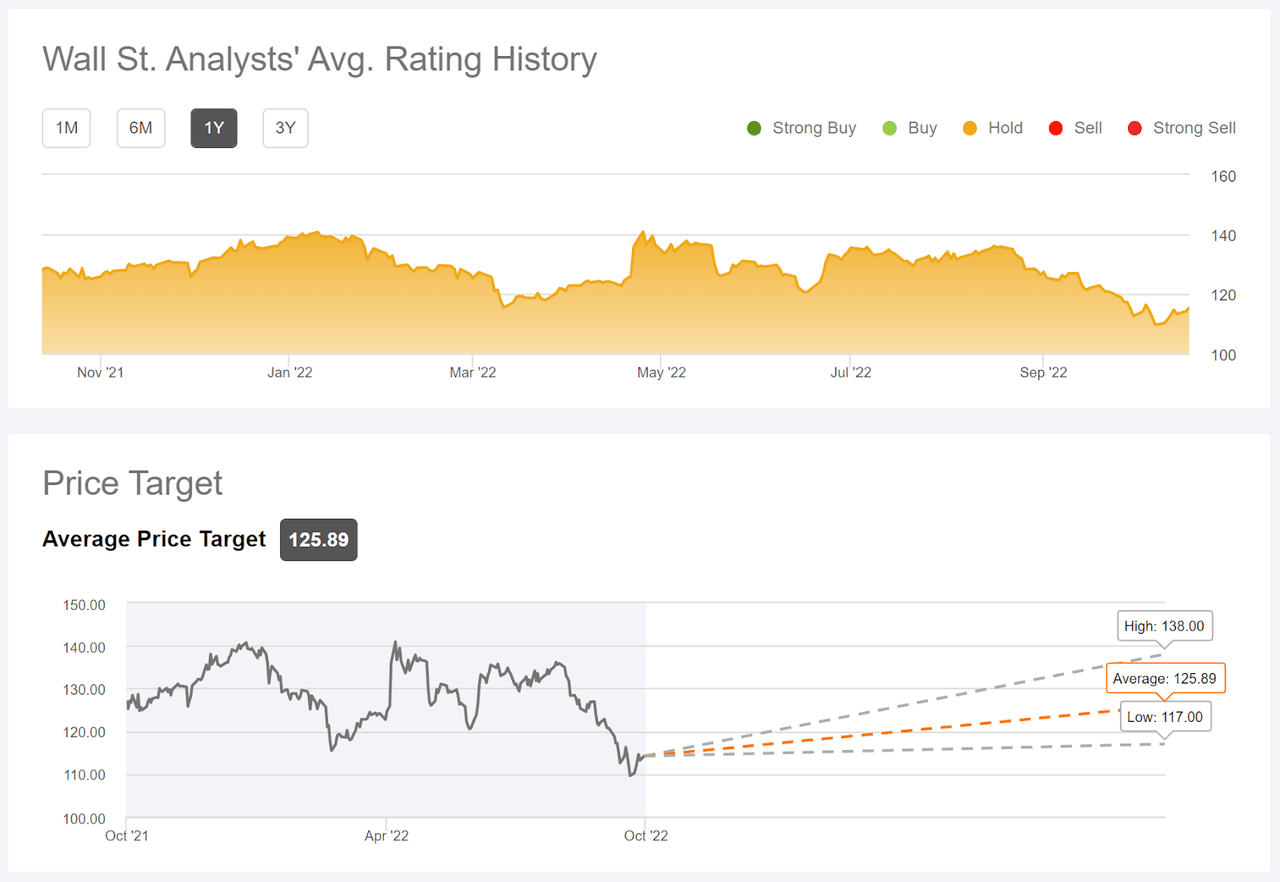
With expected 12-month price appreciation of 8.85% (averaging the two consensus price targets), KMB’s estimated total return over the next year is 12.9%. For a low-beta stock like KMB, this would be a fairly attractive return.
Market-Implied Outlook for KMB
I have calculated the market-implied outlook for KMB for the 3.1-month period from now until January 20, 2023 and for the 15-month period from now until January 19, 2024 using the prices of options that expire on these dates. I selected these two expiration dates to provide a view through the end of 2022 and for all of 2023. I would normally have analyzed options expiring in mid-2023, but the trading volume and open interest on the June options is quite thin.
The standard presentation of the market-implied outlook is a probability distribution of price return, with probability on the vertical axis and return on the horizontal.
Market-implied price return probabilities for KMB for the 3.1-month period from now until January 20, 2023 (Source: Author’s calculations using options quotes from ETrade)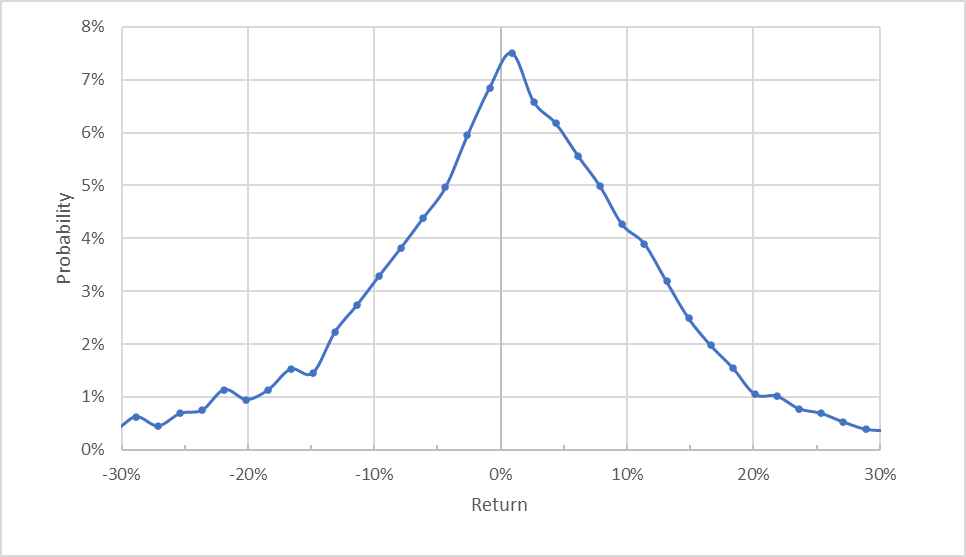
Even though the maximum probability outcome corresponds to a return that is close to zero (0.8%), there is a definite tilt in the overall distribution to favor positive returns. Note, for example, that the probability of having a +10% return is notably higher than for a return of -10%. This asymmetry diminishes for larger-magnitude outcomes. The expected volatility calculated from this distribution is 27.3% (annualized), as compared to 18.9% from my analysis in November of 2021. This increase in KMB’s expected volatility is primarily attributable to rising volatility for U.S. equities. VIX was 15.1 on November 3, 2021, as compared to 30.6 today.
To make it easier to compare the relative probabilities of positive and negative returns, I rotate the negative return side of the distribution about the vertical axis (see chart below).
Market-implied price return probabilities for KMB for the 3.1-month period from now until January 20, 2023. The negative return side of the distribution has been rotated about the vertical axis (Source: Author’s calculations using options quotes from ETrade)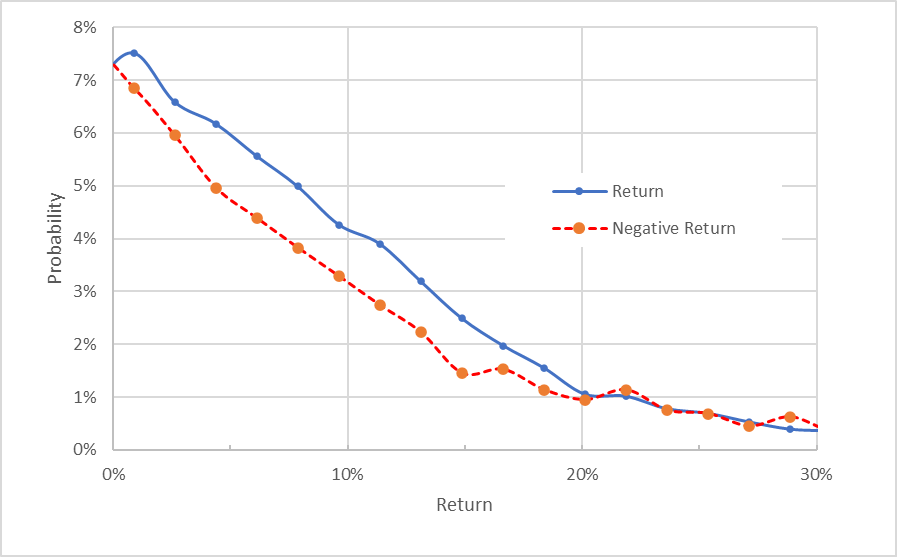
This view shows that the probabilities of positive returns are consistently higher than those of negative returns across a wide range of the most-probable outcomes (the solid blue line is above the dashed red line over the left ⅔ of the chart above). This is a bullish outlook for the next 3.1 months.
Theory indicates that the market-implied outlook is expected to have a negative bias because investors, in aggregate, are risk averse and thus tend to pay more than fair value for downside protection. There is no way to measure the magnitude of this bias, or whether it is even present, however. The expectation of a negative bias reinforces the bullish interpretation of this outlook.
The market-implied outlook for the next 15 months has probabilities of positive and negative returns that are quite close, although the probabilities of positive returns are modestly higher across most of the distribution. Especially given the expectation for a negative bias in the market-implied outlook, I interpret this outlook as slightly bullish. The expected volatility calculated from the 15-month outlook is 26.6% (annualized).
Market-implied price return probabilities for KMB for the 15-month period from now until January 19, 2024. The negative return side of the distribution has been rotated about the vertical axis (Source: Author’s calculations using options quotes from ETrade)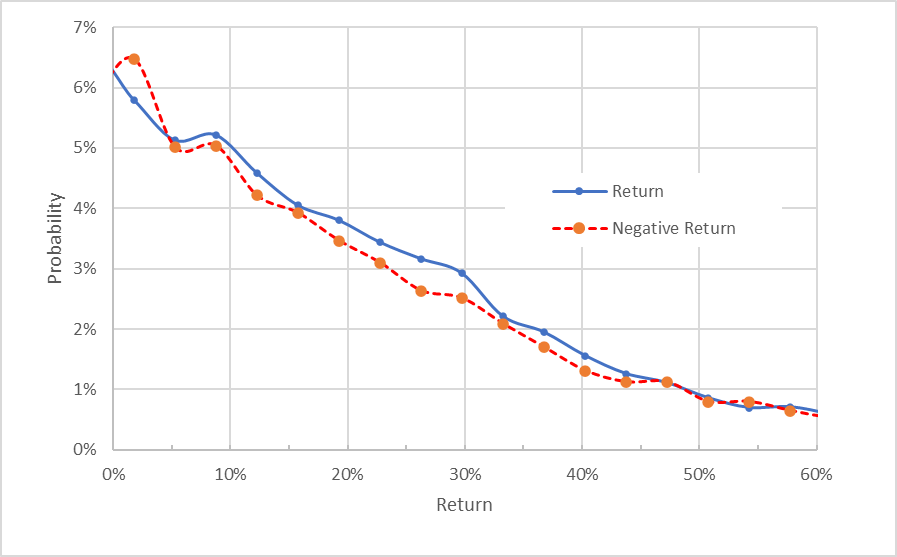
The market-implied outlooks are bullish to mid-January of 2023 and slightly bullish from now until mid-January of 2024. The expected volatility is in the range of 26%-27%.
Summary
Kimberly-Clark has been in a downward earnings trend since late 2020 and this has been exacerbated by high inflation in 2022. Thus far, management has not raised prices sufficiently to offset rising costs. The company plans to raise prices, as well as cutting costs, to boost earnings. The Wall Street consensus rating is a hold, as it has been for 12+ months. The consensus 12-month price target corresponds to a total return of 12.9% over the next year. As a rule of thumb for a buy rating, I want to have an expected 12-month total return that is at least ½ the expected volatility (26%-27%). The Wall Street consensus expected total return is very slightly below this threshold ratio. The market-implied outlook for KMB is bullish to mid-January of 2023 and slightly bullish to mid-January of 2024. While the company clearly faces challenges from falling margins as inflation persists, the consensus price target, along with the 4.06% dividend yield, predicts a reasonable return. Considering the bullish market-implied outlooks, I am changing my rating on KMB to a buy.
Be the first to comment