

JasonDoiy/iStock Unreleased via Getty Images
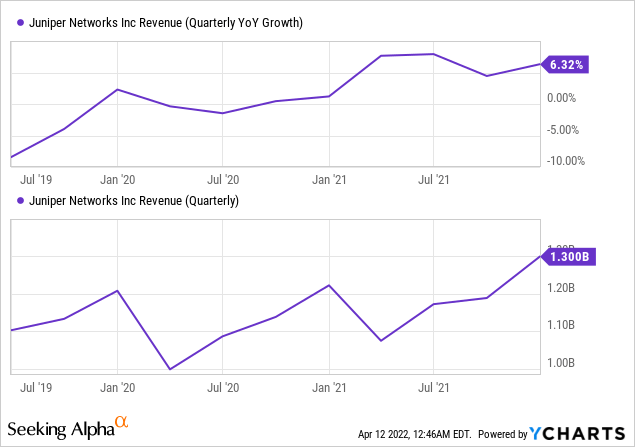
The current macroeconomic environment is characterized by high inflation and the Fed hiking interest rates, both leading to higher costs of doing business. At the same time, supply chain bottlenecks are hindering the ability of communications equipment providers like Juniper Networks (NYSE:JNPR) to satisfy demand. Thus the quarterly growth which was largely driven by digital transformation during the last three years appears to be stagnating around the 6.3% level.
Now, during the earnings calls, you hear a lot of positive remarks about the supply chain issues being transitory, but the lockdowns in China tend to demonstrate that Covid (through its variants) is still around. Thus, I start by realistically assessing the degree to which Juniper’s supply chain has hurt sales and margins, as well as its capacity to withstand further pains in global logistics.
Analysis of the supply chain
As shown in the revenues by Customer Solution segment, Juniper’s Cloud-Ready Data Center sales declined in the fourth quarter of 2021 compared to the same period last year, due to shipments not reaching customers on time, which the CEO attributes to supply chain challenges. The decline is highlighted in red below.
Segment results (seekingalpha.com)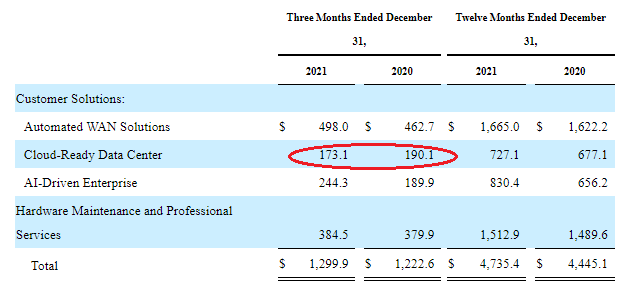
Now, routing equipment and other networking gear need semiconductor components like CPUs and FPGAs which have become more difficult to source in view of the persisting supply-constrained environment being faced by the industry since the second quarter of 2021. In this respect, according to Juniper’s CFO, there has been no noticeable deterioration in the last 30 days. Hence, the expectation seems to be that lead times will remain extended, but not at the point of becoming over-stretched.
Looking at the industry, with demand outstripping supply, foundries that manufacture chips have been charging higher, with the problem exacerbated by shippers charging higher freight. Thus, component costs have gone up in turn translating into end-products (routers and firewalls) becoming more expensive for end customers like service providers like Verizon (VZ), enterprises, or public cloud providers like Microsoft (MSFT). In this case, networking plays that have some pricing power can pass on part of the cost increase to customers, while others have to absorb it in order not to lose market share. The second option normally results in lower margins.
Comparing the operating margins
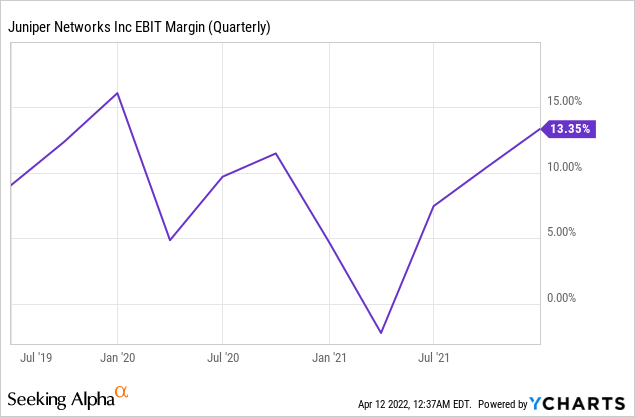
As for Juniper, it has some pricing power as it was able to expand operating margins by 8.35% (13.35%-5%) in Q4 on a year-over-year basis, despite incurring higher material costs for both supply chain and acquisition-related expenses. This margin expansion is shown in the chart below.
Coming back to segment results, Juniper was able to more than offset the weakness in Cloud-Ready Data Center where there was a reduction in sales by strength in both Automated WAN Solutions and AI-Driven Enterprise. As a result, the company grew at a Y-o-Y rate of 6.32% in the last reported quarter.
This is slightly less than competitor Cisco’s (CSCO) 6.35%. whose last reported quarter ended on January 29, 2022. The giant networking company is also suffering from constraints related to its semiconductor supply chain thereby preventing it from completing the manufacturing of some of its appliances. Thus, component shortages, as well as more frequent use of expedited (more rapid) freight, have resulted in higher costs which have constrained margin expansion to just 1% (29%-28%) in the last reported quarter compared to the same period last year. This is shown in the chart below.
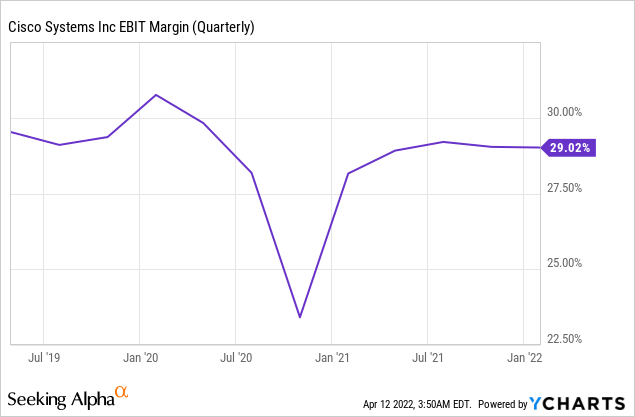
Now, Cisco has much higher operating margins (29%) compared to Juniper’s (13.35%) and this is due to the former’s much higher revenue level as well as volume discounts due to ordering more units of the same components from suppliers. However, the fact that the smaller company has been able to increase its operating margins by more than 8% compared to only 1% by Cisco shows its superior ability to face supply chain pressures.
This superiority could also stem from the fact that it has been able to design its products to include a higher dose of software and AI than hardware, which has to be physically manufactured and transported in containers, implying higher expenses.
AI and Software strength
Juniper has been one of the first in the industry to come up with an AI-driven portfolio commonly referred to as Mist AI following its acquisition of Mist and 128 Technology about three years back.
Subsequently, empowered with the Apstra acquisition which made possible a simpler approach to data center operations in the emerging cloud-centric world, the company was able to address the requirements of the service provider market. Now, this market which includes the likes of Orange (ORAN) is supposed to reach $1.1 trillion by the end of this year after growing by 3.1% since 2017.
Moving to enterprise solutions, Mist AI includes built-in AIOPs or AI for IT operations, which, when deployed in companies result in simplifying tasks like network management functions, while at the same time reducing costs. These help over-burdened network administrators by providing them with actionable insights. This sort of AI-enabled feature is attractive in a tight labor market where recruiting network administrator talent is proving to be difficult.
Exploring further, possessing the first-mover advantage with Mist and a better competitive position as shown in the figure below where it scores best, Juniper’s enterprise AI has generated revenues of $244.3 million in Q4, or 28.6% more than the same period of 2020.
Comparison with competitors (ai.mist.com)
This signifies that the company is gaining market share for AI-driven solutions in enterprises. Furthermore, constituting 26.7% (as per my calculation) of the Customer Solutions segment, Enterprise AI is part of the reason why despite the supply-constrained environment, the executives still forecast a full-year revenue growth for 2022 of 7%-9%, which would exceed last year’s 6.53%.
On the other hand, security-related revenue was $162 million, or flat compared to the same period last year with the supply chain blamed again for the stagnation. This compares to a 7% increase for Cisco which remains a better cybersecurity play.
Pursuing further, Juniper’s strategy to become more of a software-centric business has yielded software sales of $242 million or an increase of 41% over Q4-2020. Also, this focus on software has resulted in annual recurring revenue growing by 32% on a year-to-year basis. Along the same lines, the company’s SD-WAN or software-defined wide area network is one of the best in the industry.
Thus, software-centricity provides the company with recurring sales opportunities and also helps to achieve a high degree of differentiation, thereby creating a multiplier effect on other Juniper products. Also, software companies tend to have higher gross margins of above 70%.
Valuations and key takeaways
Now, the company’s service gross margins achieved a record high of non-GAAP 65.8% in Q4, which represents a 1.7% increase compared to the prior year. This was made possible through a reduction of costs through automation of certain tasks as well as delivering solutions through the cloud instead of having to move to clients’ premises. Going forward, this is an area that should be continuously helped by Mist AI.
Therefore, valuing the company on basis of its forward EV/EBIT multiple of 14.12x (figure below), which is lower relative to the IT sector by 9.17%, I obtain a target of $37.8 based on the current share price of $34.2. This is above the $36 guidance of analysts at Citi who have upgraded the stock from sell to neutral.
Valuations (seekingalpha.com)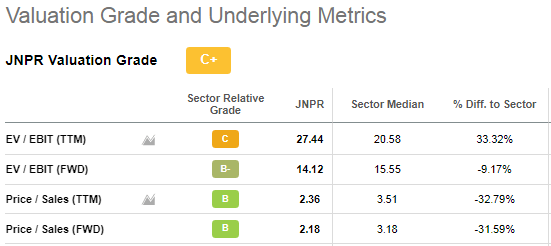
To reinforce my bullish instance, Juniper increased its operating margins by 2.27% in the last quarter of 2021, and, for 2022, the guidance is for a further 1% improvement. This is based on the company’s order momentum, backlog levels, and supply chain challenges remaining constant in the first half of this year.
At this juncture, some would have noticed that I have not valued the company based on the Price-to-Sales metric where it is undervalued by more than 30%. The reason is that at the time of the revenue forecast on January 27, neither the conflict between Russia and Ukraine had started nor there was any coronavirus-related lockdown in China. I further elaborate on these two factors below.
First, the company’s SEC filings do not specifically mention the countries involved in the Eastern European conflict as being customers, but Europe together with the Middle East and Africa did constitute 26.4% of revenues in the last quarter of 2021. Therefore, there is likely to be an impact on sales as, according to its website, Juniper has stopped deliveries to Russia and its ally Belarus.
Second, according to Q1-2020’s earnings call the company does have a global supply footprint including primary manufacturing partners located in China, Taiwan, Malaysia, Mexico, and the United States. Additionally, it is much more diversified for components. Therefore, there may be a slight impact on sales if the company is not able to shift sourcing in time.
Finally, with the ability to face supply chain issues better and strong market positioning in enterprise AI, Juniper is a buy based on its ability to raise margins. However, in this high inflation environment, tech stocks are being impacted the most as a result of their relatively higher valuation with respect to the broader market. As a result, the stock will be volatile in the short term. Ultimately, with strong demand, the company remains a long-term buy. For this matter, orders grew by above 50% on a year-over-year basis culminating in a backlog of $1.8 billion, which exceeds fourth-quarter revenues of $1.3 billion as shown in the introductory chart.
Be the first to comment