

Lemon_tm
Written by Nick Ackerman, co-produced by Stanford Chemist. This article was originally published to members of the CEF/ETF Income Laboratory on October 3rd, 2022.
Nuveen Real Asset Income And Growth (NYSE:JRI) is a fund positioned in a diversified basket of real assets. This includes infrastructure and real estate. Real estate has been hit particularly hard, but infrastructure in the energy and utility space has held up relatively better. Additionally, JRI invests across common, preferred and debt investments. That has put further pressure on the fund’s performance as interest rates rise rapidly.
All that being said, there are some positives to the positioning of JRI. For one, infrastructure will continue to play an essential role in everyday life. The need for pipelines doesn’t seem to be going away anytime soon – even if it is a fairly volatile area to invest in. Additionally, now a lot of the damage seems to be priced in that rising rates can cause.
That is unless we get another hotter-than-expected inflation report that could reprice the entire market lower once again. High and persistent inflation would continue to give the Fed the clear to keep raising rates dramatically.
A bonus for JRI to make it appear quite attractive now is the fund’s discount. It remains near the widest we’ve historically seen for this fund. In fact, the discount widened even a bit further since the last time we covered the fund earlier in the year. That has resulted in some weaker share price returns relative to the performance of what the underlying portfolio had actually put up.
JRI Performance Since Previous Update (Seeking Alpha)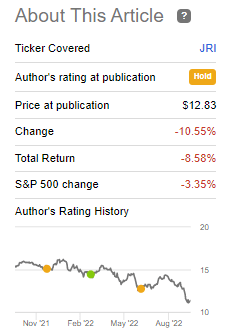
The Basics
- 1-Year Z-score: -2.38
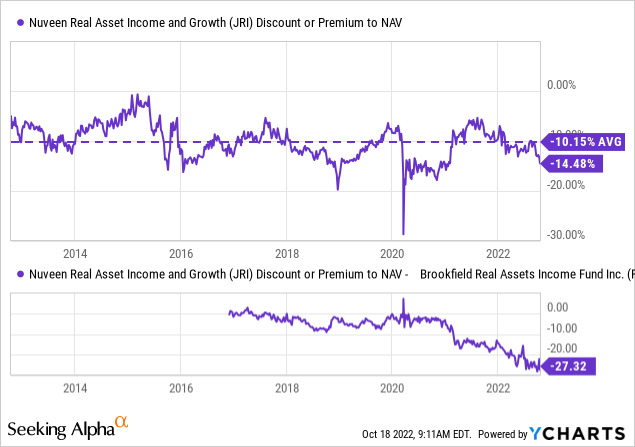
- Discount: -14.48%
- Distribution Yield: 10.59%
- Expense Ratio: 1.57%
- Leverage: 31.37%
- Managed Assets: $593.255 million
- Structure: Perpetual
JRI seeks “to deliver a high level of current income and long-term capital appreciation by investing in real asset-related companies across the world and the capital structure, including common stocks, preferred securities, and debt.” They define real asset-related companies as “those engaged in owning, operating, or developing infrastructure projects, facilities, and services, as well as REITs.”
Further, they invest “up to 40% of its assets may be debt securities, all of which may be rated below investment grade, though no more than 10% of its assets may be invested in securities rated CCC+/Caa1 or lower at any time. Non-U.S. exposure represents 25% to 75% of the Fund’s managed assets.”
Previously I touched more on the subject of their leverage. I had mentioned that I wished they didn’t go so heavy on their leverage. Well, they have since reduced the leverage by a touch. However, it was more likely a margin call as the market came crashing down rather than a conscious effort to de-risk the portfolio. Fortunately, it wasn’t anything drastic such as we saw in 2020.
JRI Borrowings (Nuveen)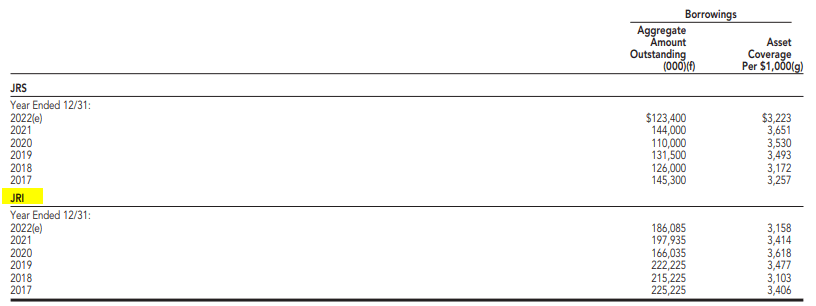
They haven’t updated the figures for the end of September yet. However, their website still shows that leverage stood at the same $186.085 million outstanding at the end of August.
In that previous article, I also touched on how they had hedged against the negative impact of higher interest rates on their leverage. They utilize interest rate swaps with an optional termination date of July 1st, 2025. It’s good for covering $112.4 million of the leverage by taking their variable rate and essentially making it a 1.994% fixed rate. As the Fed raised interest rates even further, this has only benefited the fund since then.
JRI Interest Rate Swaps (Nuveen)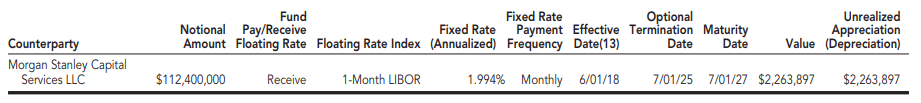
The fund’s expense ratio is on the higher end at 1.57%. This can be more common in funds such as JRI, which incorporates a meaningful amount of different asset classes in its portfolio. When including interest expenses, it comes to 2.10%.
Performance – Discount Widening Further
The annualized returns for JRI aren’t going to be anything to brag about. Unfortunately, they’ve had some ill success in the past. However, what they own is still relatively attractive. The biggest punishment for the fund was the energy exposure it has been carrying. The deleveraging in 2020 also doesn’t help the overall situation of the fund.
JRI Annualized Performance (Nuveen)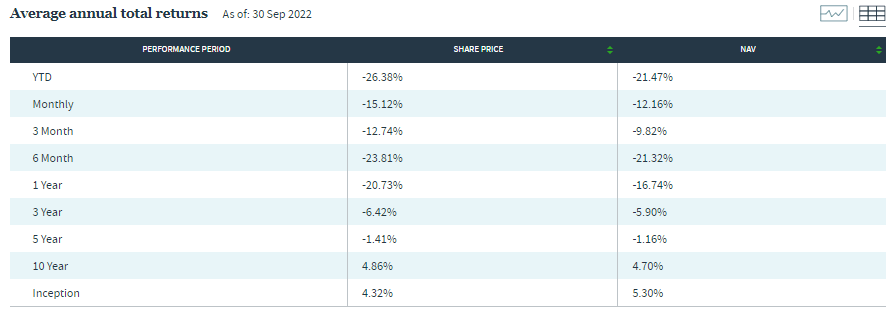
Since our last update, the fund has reduced its pipeline exposure just a bit, but we will discuss more of its portfolio below. Perhaps taking some profits in the energy space isn’t a bad thing.
One fund that I believe invests similarly to JRI is Brookfield Real Assets Income Fund (RA). They both invest in various real assets and utilize an approach to invest across a company’s issuing spectrum. The longer-term results have favored RA. We can see significant outperformance on a total share price return basis but less pronounced on a total NAV return basis. Of course, I think we’d be lying to say that either fund really put up performance over the years to brag about.
Ycharts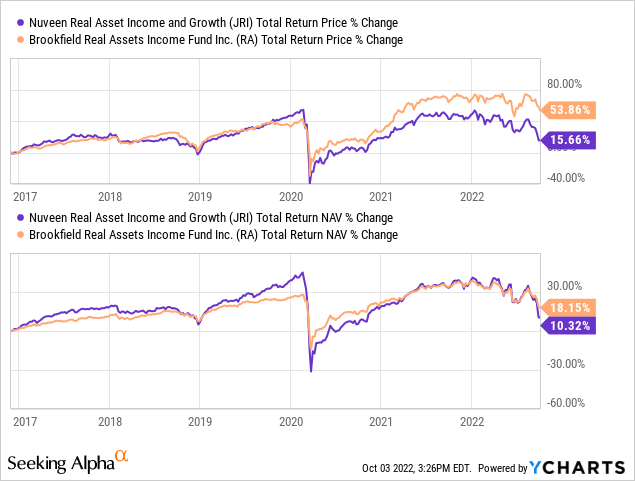
What is more interesting, though, is that due to this divergence, the discount/premium difference in these funds has become massive. Where JRI really doesn’t have to perform any better in their portfolio going forward, but if RA’s premium simply comes down, then JRI can still provide the better upside. Interestingly, RA’s premium has already come down some, but I believe it could have further to drop.
The difference in the premium/discount spread between JRI and RA is near an all-time difference. For JRI itself, we are seeing the fund’s discount beyond the average the fund has experienced in the last decade on average.
Distribution – Covered Via Realized Gains And Income
The current monthly distribution has been in place since the COVID collapse in the market. At this time, it remains a lower yield on a NAV basis, around 9.06% compared to its share price rate of 10.59%
JRI Distribution History (CEFConnect)
That’s a good thing for investors, though, as the fund’s wide discount means the actual distribution rate investors can receive when buying now is 7%.
To fund the distribution, the fund doesn’t provide enough NII coverage. That comes to around 78.9%. That’s actually quite a high amount of coverage. However, perhaps that’s to be expected when a fund invests fairly heavily in some of the higher-paying energy names.
To cover that shortfall, the fund was able to provide realized gains of around $3 million in the first six months of the year. A meaningful portion of this was from their future contracts where they are short Treasurys. That’s another way they are hedged against rising interest rates. It just so happens to be that it can help fund their distribution, too, as those realized gains come in.
Of course, the unrealized gains in the portfolio have been quite extensive. Even after their swaps have been working extremely well in an unrealized manner to offset the higher interest rates of their leverage.
JRI Semi-Annual Report (Nuveen)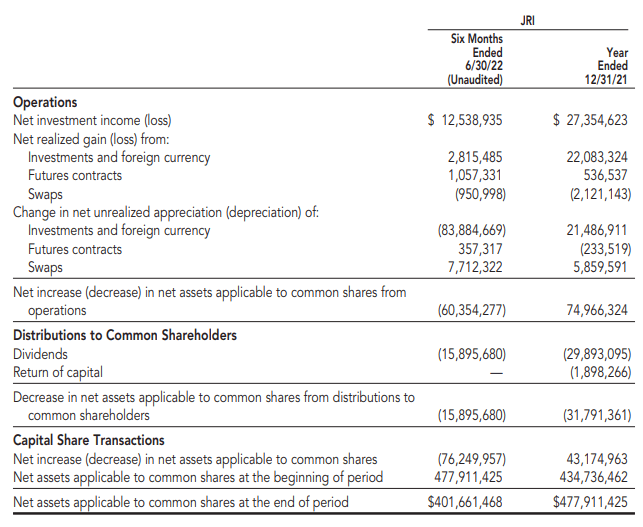
Still, at this time, a cut doesn’t seem to be necessary or even on the table. I would expect this rate to be maintained. However, a deep and prolonged recession could pressure another trim to the distribution.
For tax purposes, the bulk of JRI’s distribution over the last two years has been ordinary income, and return of capital has also been present.
JRI Annual Report (Nuveen) Looking at the more detailed breakdown provided for 2021, we can see that 36.58% was ordinary income, 43.69% qualified dividend income, 12.11% section 199A income, and then 7.62% return of capital. This seems to be one of those funds that wouldn’t be a bad idea if you can hold it in a tax-sheltered account. At the same time, a sizeable portion is classified as qualified dividends that can reduce an investor’s tax obligations in a taxable account.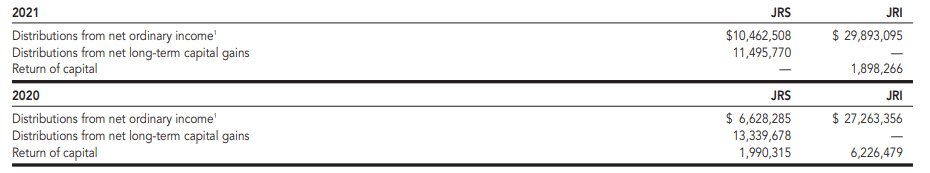
JRI’s Portfolio
One area that is always notable for JRI is that the fund’s turnover rate tends to run higher. That means managers are doing more buying and selling in the fund relative to other CEFs I cover. In the last six months, it was down to 35%. If that trajectory continued, it would be less than the 73% from the prior fiscal year. It would also be the lowest of the four years previously. In 2020, it reached over a 100% turnover rate.
That’s noteworthy because when we are looking at their portfolio at this time, there could have already been meaningful changes. That’s one of the downsides of CEFs; they are fairly opaque. That being said, Nuveen is a fund sponsor that provides monthly updates instead of just quarterly.
With that, we can take a look at their latest asset allocation. At this time, they are favoring real estate equity positions. That makes up 25.2% of their portfolio, which is followed by infrastructure equity positions. The fund regularly is weighted heaviest in equity positions, so that hasn’t been too much of a change. However, a shift since our last update is that both these top asset allocations have come down a bit. Infrastructure declined more than real estate, as real estate now takes the top spot where it was the reverse.
JRI Asset Allocation (Nuveen)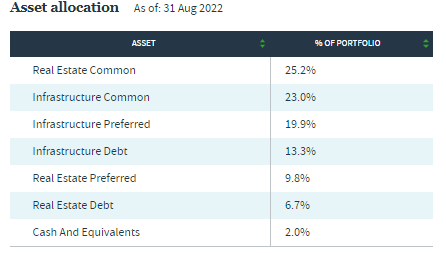
Perhaps unsurprisingly, we also saw a reduction in pipeline exposure in the fund.
JRI Top Sector Exposure (Nuveen)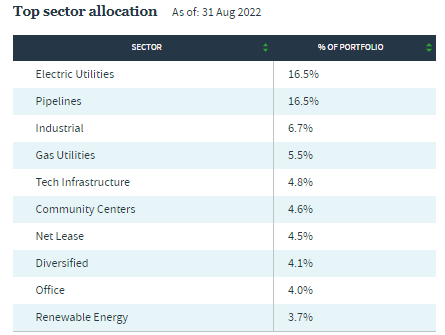
Instead, now the fund favors electric utilities over the pipeline sector. Shifting to a less aggressive pipeline positioning could make sense if we are heading into a recession. The reason being is that while pipelines provide an essential service, they are subject to the whims of the volatile oil and natural gas prices. On the other hand, the utility sector is often seen as a defensive sector. Even during a recession, most people will still pay their gas and electric bills.
Looking at the top ten holdings, we can see representation reflecting the above mentioned sectors. In this case, several of these names still remain top positions as they were earlier this year – that is despite the relatively higher turnover rate we see in the fund.
JRI Top Ten Issuers (Nuveen)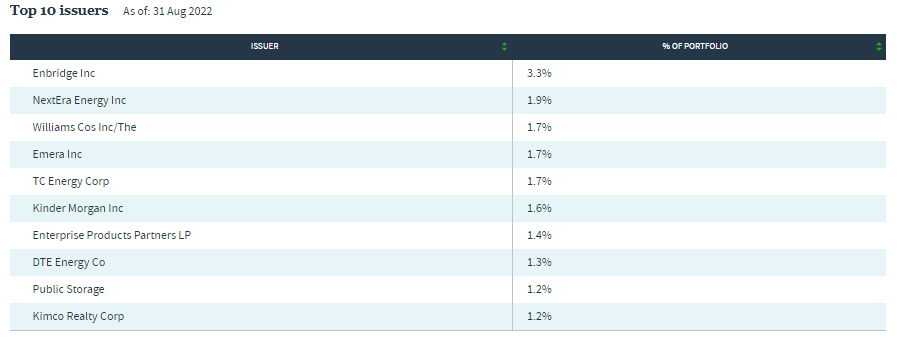
One of the new names to make an appearance on the top ten is DTE Energy (DTE). This is a multi-utility company that is a favorite of mine. I’ve held the shares for years, and it has rewarded investors for years. Below are the price performance and the dividend that DTE has paid out.
Ycharts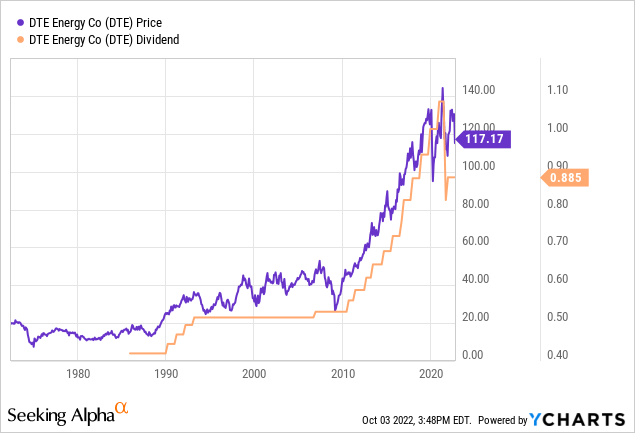
Noting that in 2021, it appears the company slashed its dividend. That reflects the spin-off of DT Midstream (DTM), of which I’m also a happy shareholder. Interestingly, DTM was a holding in the top ten previously but no longer shows up. Pulling up the full list of JRI holdings shows that DTM is still a position at the end of August 2022, at around a 0.45% weighting.
Public Storage (PSA) is another position appearing on the top ten list this time around. The name of this REIT basically says it all. They focus on operating self-storage facilities across the U.S. They recently paid out a massive special dividend that was related to the sale of PS Business Parks, where they had an approximate 41% interest. Otherwise, their dividend has held firm at $2 per quarter since the end of 2016.
Most importantly, JRI is well diversified, with no position representing too much of a significant weighting in the fund. Enbridge (ENB) is in a fairly influential position, but the fund carries 507 holdings overall. This is primarily allocated to large-cap names but includes meaningful exposure to mid and small-cap companies.
JRI Fund Characteristics (Nuveen)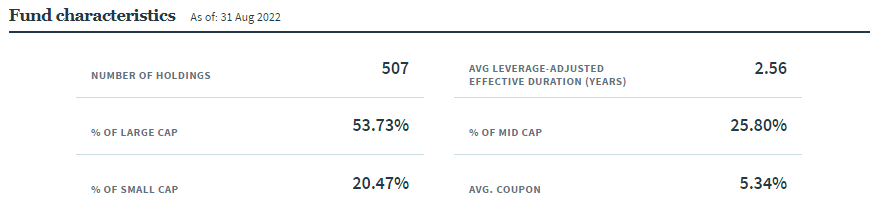
Conclusion
JRI is an interest real asset fund. It invests in infrastructure that includes utilities and pipelines, which are essential for our lives. The other exposure in the fund to make up the real assets are the real estate the fund is also meaningfully invested in. This represents perhaps some less “essential” exposure to things such as offices or shopping malls but helps to diversify the portfolio nonetheless. At the current deep discount, the fund appears to be attractively valued.
Be the first to comment