

Michael Nagle/Getty Images News
Let’s start off this article by saying I am more neutral on my market outlook over the next year. We may get wild swings over the next 12 months, but I am projecting only slight overall progress for the U.S. equity market. A mild recession is all but assured with the inverted duration curve for Treasury bonds, and valuations remain extremely stretched on Wall Street as measured by the ratio of total market capitalization to GDP (still in the 95th percentile over 100 years of history).
Being the contrarian-thinker in the room (devil’s advocate, if you will), I am always looking for trading ideas that do not fit my current view of the world. I came across one idea today that I feel must be written about, simply because its track record since 1972 is so awesomely positive. It revolves around an optimistic take on the markets and economy, so you will have to decide for yourself if the trade is something you want to pursue.
The basic analysis – it is incredibly rare to see both gold and banks declining sharply at the same time. Such really only happens during recessions and serious bear markets in equities. In essence, this pick is related to my July story here discussing the high odds of a “liquidity crisis” in U.S. markets into the fall, as gold miners and financials/banks headed south over a 3-month period simultaneously.
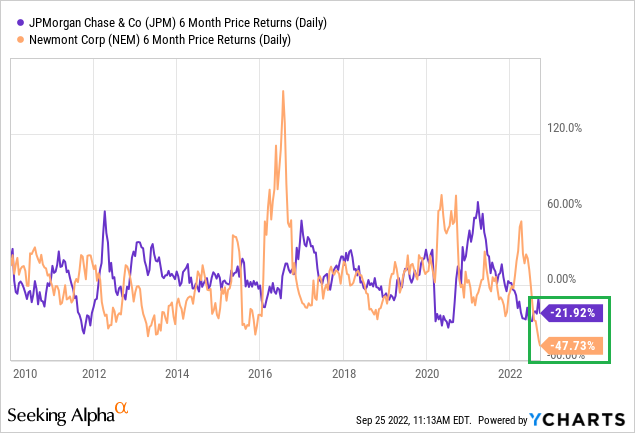
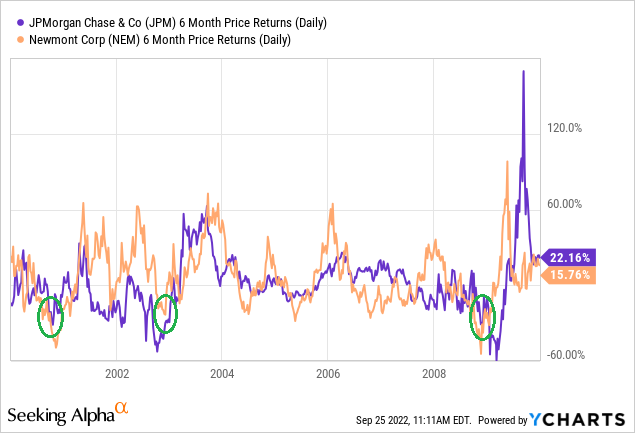
Specifically, this article looks at 6-month price changes for both JPMorgan Chase & Co. (NYSE:JPM) and Newmont Corporation (NEM), one of the oldest and richest U.S. banks in history vs. the longest trading large-cap, mostly a gold miner, back to late 1972. It is incredibly rare for both to fall -20% concurrently over a 6-month span. Similar tandem drawdowns have only happened 8 times over 50 years, before July 2022!
Major Bank Bottom Approaching?
If we start to plan and think opportunistically, we should be hunting for turnaround ideas to buy in coming weeks and months, as retail investors, institutions and hedge funds panic-sell. One area to focus your buying during emotional, fear-based selling on Wall Street is the banking sector.
In terms of cyclical trading, hard money gold miners and money center banks are two sectors that are directly affected by confidence in the financial system and liquidity issues. When both are declining significantly, it means liquidity is in sharp contraction. So, after emotional investor/analyst reactions run their course, and a central bank switch to new money-printing and bank liquidity appears, both sectors tend to morph into immediate winners during the early stages of a bull market.
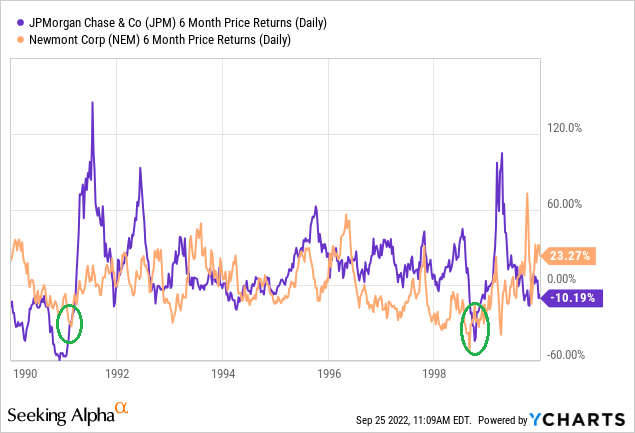
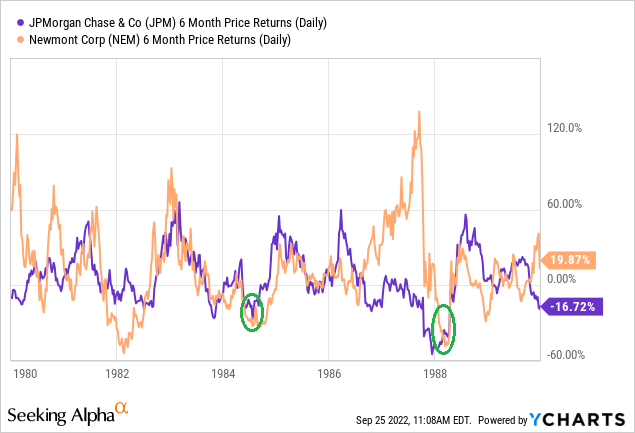
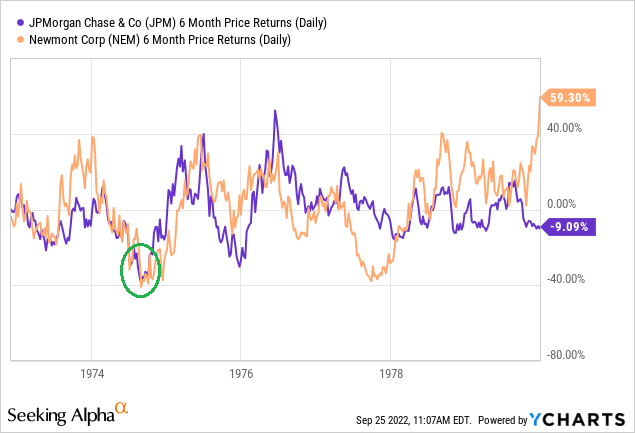
Below is the 50-year chart that first caught my attention, although many will not see the correlated reversal trend spikes in JPMorgan. Next, I have broken down the time periods into rough decades, with green circles highlighting the -20% and greater drop zones in both bellwether leaders over 6 months of trading. The 1970s (after late 1972), 1980s, 1990s, 2000s, and 2010 to present are pictured.
YCharts – JPMorgan vs. Newmont 6-Month Price Changes, 50 Years YCharts – JPMorgan vs. Newmont 6-Month Price Changes, Author Reference Points, 2010-Present YCharts – JPMorgan vs. Newmont 6-Month Price Changes, Author Reference Points, 2000-2010 YCharts – JPMorgan vs. Newmont 6-Month Price Changes, Author Reference Points, 1990-1999 YCharts – JPMorgan vs. Newmont 6-Month Price Changes, Author Reference Points, 1980-1989 YCharts – JPMorgan vs. Newmont 6-Month Price Changes, Author Reference Points, 1972-1979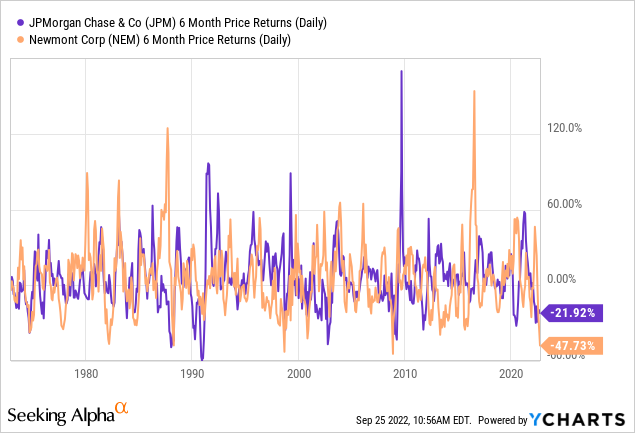
Buy Signal Results – 12 Months Later
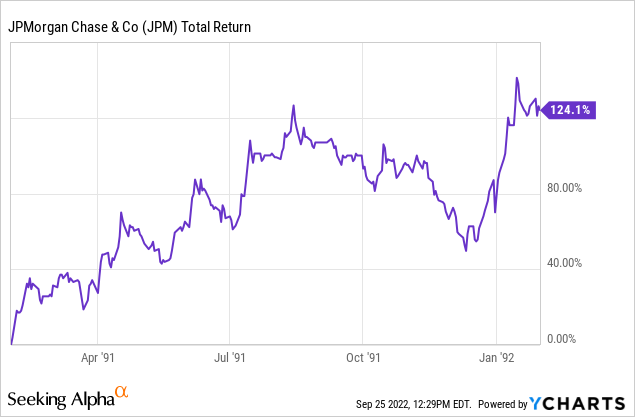
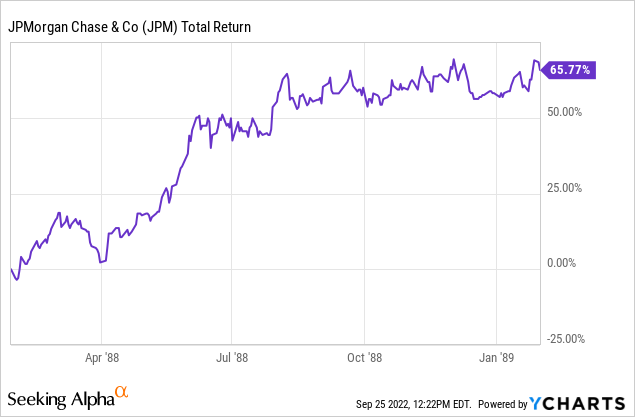
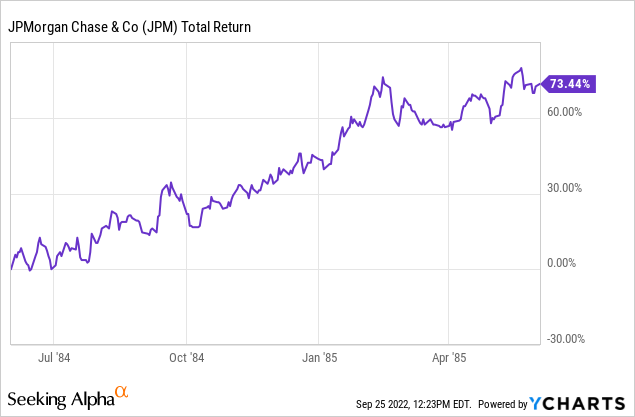
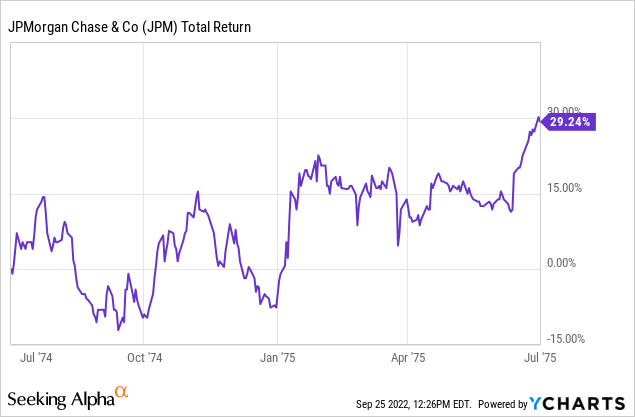
For my purposes, I am counting the first instance of -20% existing in both JPMorgan and Newmont as the start of a new “buy signal.” Here are the eye-popping results: +57% for a mean average total return gain, a little over a year after the onset of each concurrent -20% drop in JPMorgan and Newmont. 7 out of 8 previous instances saw meaningful gains, and even the one example of a 1-year loss was profitable by nearly +40% after the first 3 months. Total return changes are measured below from late July 2022, November 2008, December 2002, October 2000, October 1998, January 1991, January 1988, June 1984, and July 1974.
YCharts – JPMorgan Returns from July 2022 YCharts – JPMorgan Returns from November 2008 YCharts – JPMorgan Returns from December 2002 YCharts – JPMorgan Returns from October 2000 YCharts – JPMorgan Returns from October 1998 YCharts – JPMorgan Returns from January 1991 YCharts – JPMorgan Returns from January 1988 YCharts – JPMorgan Returns from June 1984 YCharts – JPMorgan Returns from July 1974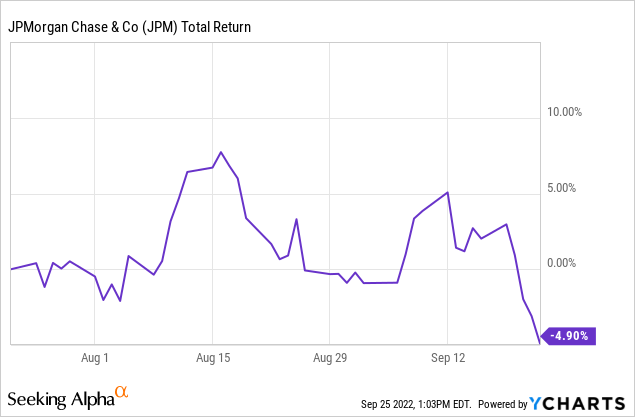
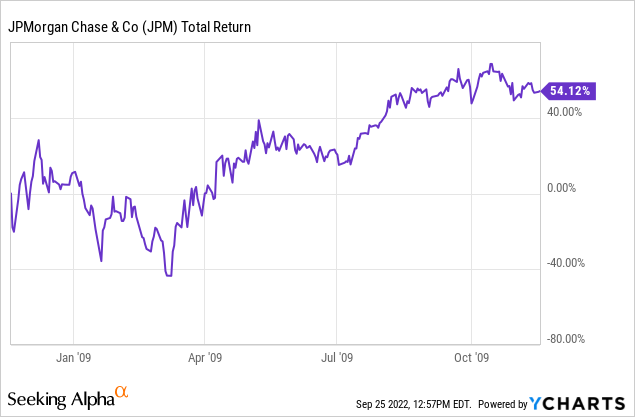
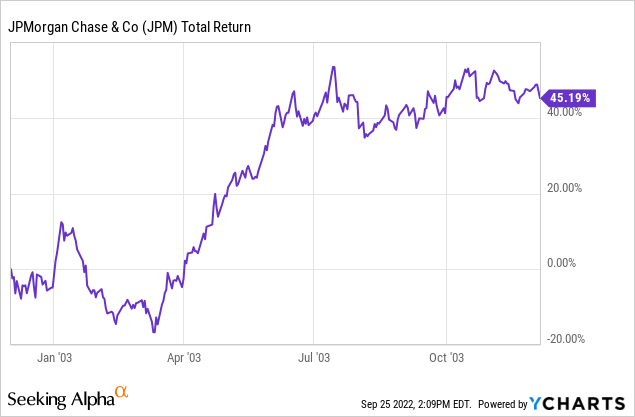
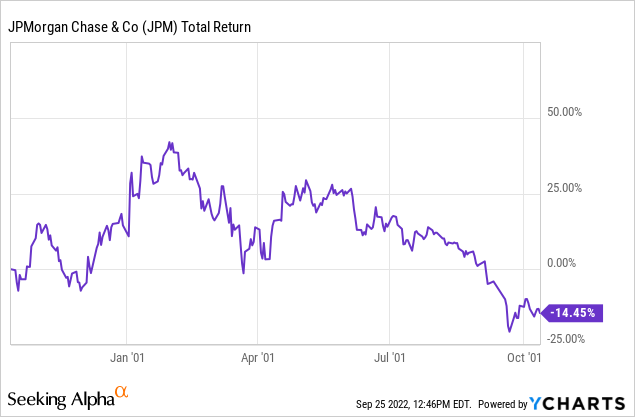
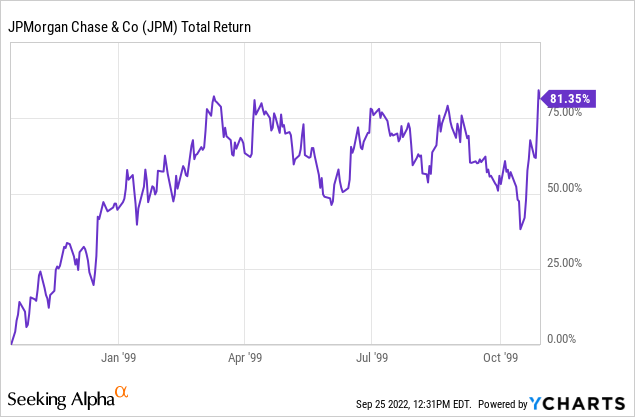
Has JPMorgan risen immediately after each signal? No, many historical examples have drifted lower for a while, including the worst-case -42% drop between November 2008 and March 2009. The point is cyclical bullish changes often happen when you believe big future gains are either impossible or not likely. While I am not projecting huge bank gains by the end of this year, cost-averaging into a name like JPMorgan over the next 2-3 months could prove a brilliant move 9-12 months down the road.
Short-Term Technicals Improving
Reviewing the daily trading chart over the past 18 months below, a number of underlying momentum indicators have been trying to bottom for JPMorgan. The Accumulation Distribution Line has been acting better since May, and the Negative Volume Index has moved higher since June. On Balance Volume has flatlined since July. Any drop to new 52-week lows under $105 could be the area to get serious about purchasing shares.
StockCharts.com – JPMorgan Chase, 18 Month Chart of Daily Changes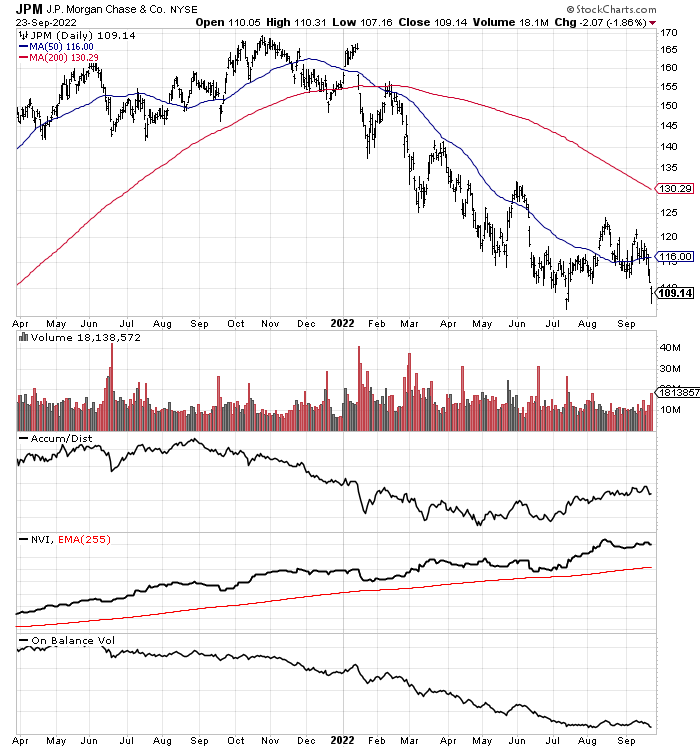
Final Thoughts
My work right now is focused on trying to figure out when the markets will bottom. Perhaps sooner rather than later is one conclusion. While price for the major indexes like the S&P 500 could still tumble another 10% or more into November, at some point the Fed will stop raising rates to support a fragile economic outlook, and Wall Street will bounce back robustly. At least, that’s how past financial crises have played out.
What if the Fed pivots from raising interest rates, as commodity prices have tanked in August-September and inflation is primed to backslide under 5% annually? What if COVID-19 is done disrupting the global supply chain going into 2023? What if Putin is overthrown or dies of cancer soon, and the Russian war in Ukraine is nearing its end? What if record cash on the sidelines at money managers is ready to rush back into the market, buying stocks in a rush of enthusiasm after our latest liquidity dump is finished in the coming weeks? What if America survives the November election and better political harmony is right around the corner?
If all the above take place (low odds but not impossible), big banks selling at extremely low valuations with super-high dividend yields could rebound strongly. Names like JPMorgan Chase, Citigroup (C), and Goldman Sachs (GS) could be solid buy candidates in the days ahead. All three distributed a dividend rate under the S&P 500 in March 2018. Today, all are paying yields far above the market-average rate of cash return. These three represent the best-situated blue-chip financials in my research, and I will be looking to buy each on weakness.
YCharts – Major Bank Dividend Yields vs. S&P 500 ETF, Since 2018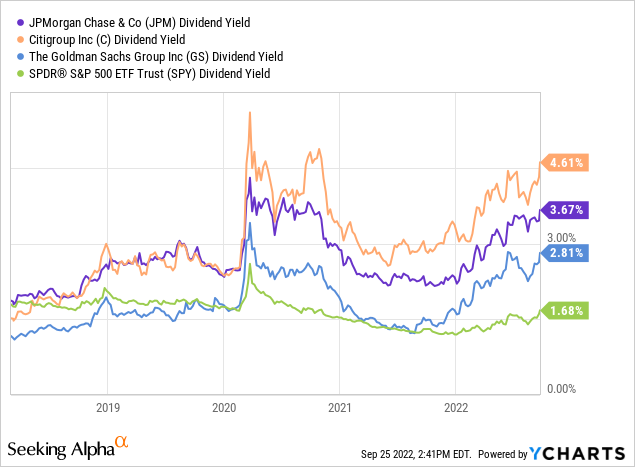
I rate JPMorgan a Buy currently. However, an outlier drop is still possible into October-November. If the company trades under $90 soon, I may switch my rating to Strong Buy. CEO Jamie Dimon is presently worried about a financial hurricane hitting America during the last few months of 2022 into 2023. Without doubt, if the Federal Reserve continues to raise interest rates, real GDP growth will be difficult, defaults will rise, home prices will decline, and unemployment will spike.
The good news is the Fed can reverse course anytime it wants. They may have been waiting for a deeper slide in stock and bond quotes to rebalance the economy (slowing confidence and spending further), reducing the long-term effect of record money printing to combat the pandemic shutdowns in the world economy during 2020-21. If you want a silver lining to contemplate, a deep recession can still be avoided, and inflation could shrink back toward “core” rates around 5%.
An optimist with faith in the American capitalistic system might decide now is the time to be a bull and buy shares in JPMorgan and other big banks. If a deep recession does not come to pass, earnings and book values will remain around current levels, with today’s pricing representing a lower valuation than 30-year normal levels, drawn below.
YCharts – JPMorgan Chase, Fundamental Ratios, 30 Years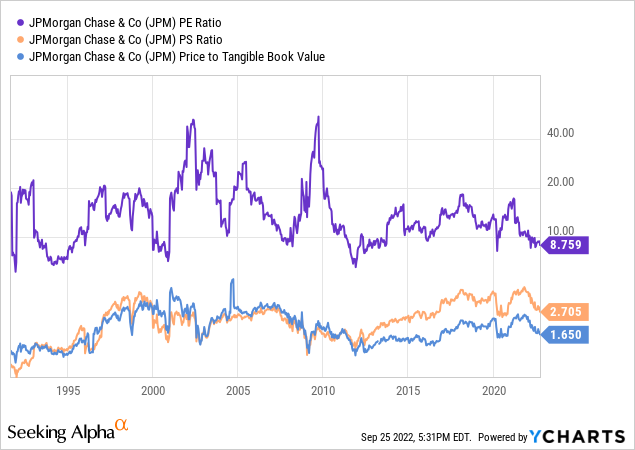
I wouldn’t be surprised by a massive reversal in investor and consumer sentiment into the spring. While I am not totally convinced this is our future, logic, math and history argue you should be hunting for buy entry points, and stop worrying about selling off your portfolio. I have been selectively buying again over the last week, with an aim to increase my stock market exposure during October.
I fully expect gold (and likely the gold miners) will lead the market higher, as they have in the aftermath of previous liquidity crises. I would summarize further equity/bond losses into October, in the face of rising gold prices, as a truly bullish development. In anticipation of a precious/monetary metal turnaround (and as a hedge against something incredibly ugly appearing on Wall Street), I now have 20% of my portfolio in gold/silver assets.
Food for thought anyway! Eventually, contrarian thinking will pay big dividends when the stock market bottom is reached. We are nearing near universal pessimism by billionaire commentators, Wall Street analysts, economists, hedge fund types, and small investors. In the past, when sentiment gets this overwhelmingly bearish, it’s usually been a smarter proposition to take the other side of the trade, and turn bullish. We’ll see if such works again.
Thanks for reading. Please consider this article a first step in your due diligence process. Consulting with a registered and experienced investment advisor is recommended before making any trade.
Be the first to comment