

Richard Drury/DigitalVision via Getty Images
The Global X S&P 500 Covered Call ETF (NYSEARCA:XYLD) and the JPMorgan Equity Premium Income ETF (NYSEARCA:JEPI) are two of the most popular ETFs for income investors and retirees right now, and with good reason.
Both funds sell covered calls on their holdings, which results in strong dividend yields. XYLD currently yields 11.5%, while JEPI yields 9.4%. Both funds tend to outperform during sideways market movements, as has been the case YTD. On a more negative note, both funds have below-average potential capital gains and long-term total returns. Both funds are reasonable investment opportunities, and particularly appropriate for income investors and retirees willing to forego long-term total returns for strong distributions.
Although both funds are broadly similar investments, there are some key differences between them. JEPI’s strategy uses a combination of financial derivatives and direct stock investments, which results in a slightly lower yield relative to XYLD, but moderately higher potential capital gains, and slightly higher expected long-term total returns. Risks and potential losses during downturns are higher too, although these have failed to materialize during past downturns.
In my opinion, JEPI is slightly superior to XYLD, but the fund is definitely riskier, and some investors might wish to avoid JEPI due to its leverage and derivatives exposure. Still, both are good, broadly similar investments.
Strategy and Holdings Comparison
XYLD invests in all S&P 500 components and sells covered calls on said index. Doing so trades away most potential capital gains for an increased yield, while downside potential remains the same.
XYLD provides investors with exposure to all S&P 500 components and diversified exposure to all relevant U.S. equity industry segments. As with most market-weighted index funds, XYLD is somewhat overweight tech, especially mega-cap tech. Industry exposures are as follows.
XYLD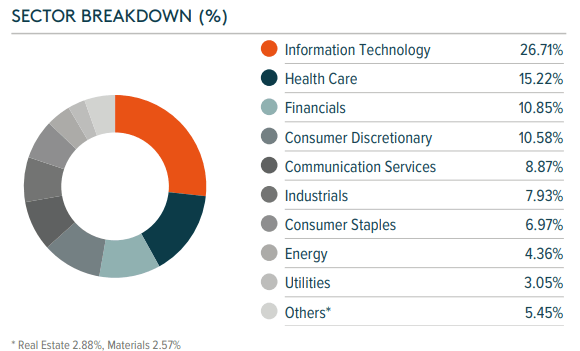
JEPI invests around 80%-90% of its assets in low-risk, low-volatility U.S. stocks, and 10%-20% of its assets in leveraged equity notes with effectively identical expected returns as XYLD. JEPI does not readily provide detailed information concerning the effective leverage / implied exposure of the fund, but something like a 1.5x – 2.0x leverage ratio seems appropriate / likely.
JEPI provides investors with direct exposure to hundreds of U.S. equities, from all relevant industry segments. It also provides indirect exposure to all S&P 500 components through its equity-linked notes, also encompassing all relevant industry segments. Industry weights are spread a bit more evenly compared to XYLD, and the fund is not materially overweight tech. Industry exposures are as follows.
JEPI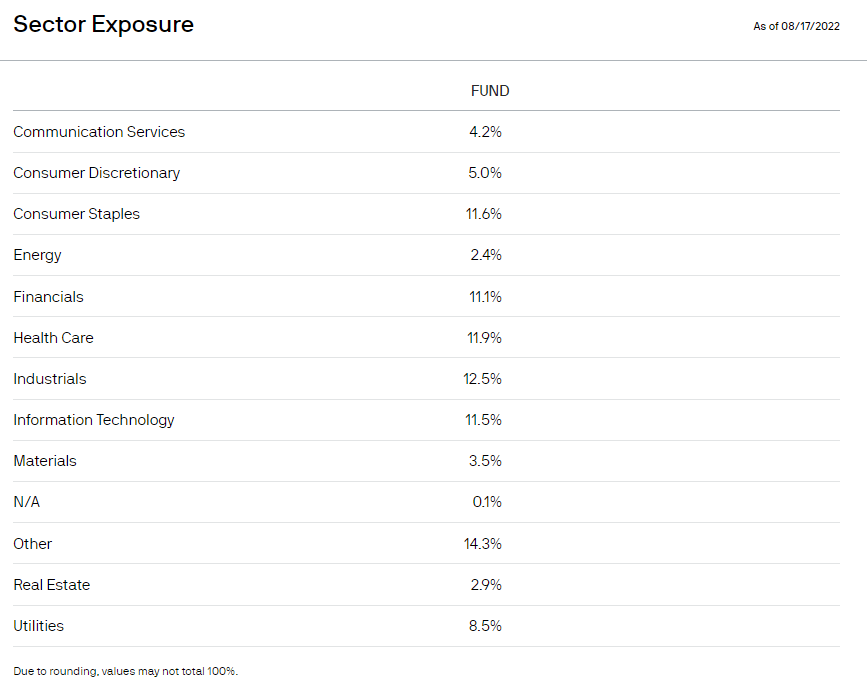
Both XYLD and JEPI provide investors with diversified exposure to hundreds of U.S. equities from all relevant industry segments. JEPI is a bit more diversified, focuses on somewhat less risky companies, and has more uniform industry weights, but is also leveraged, unlike XYLD. In general terms, I prefer JEPI’s holdings and weights, but the leverage is a much more important, material difference between these funds.
Income Comparison – XYLD Clear Winner
Both funds offer investors strong dividend yields, although XYLD’s yield is slightly higher than that of JEPI.
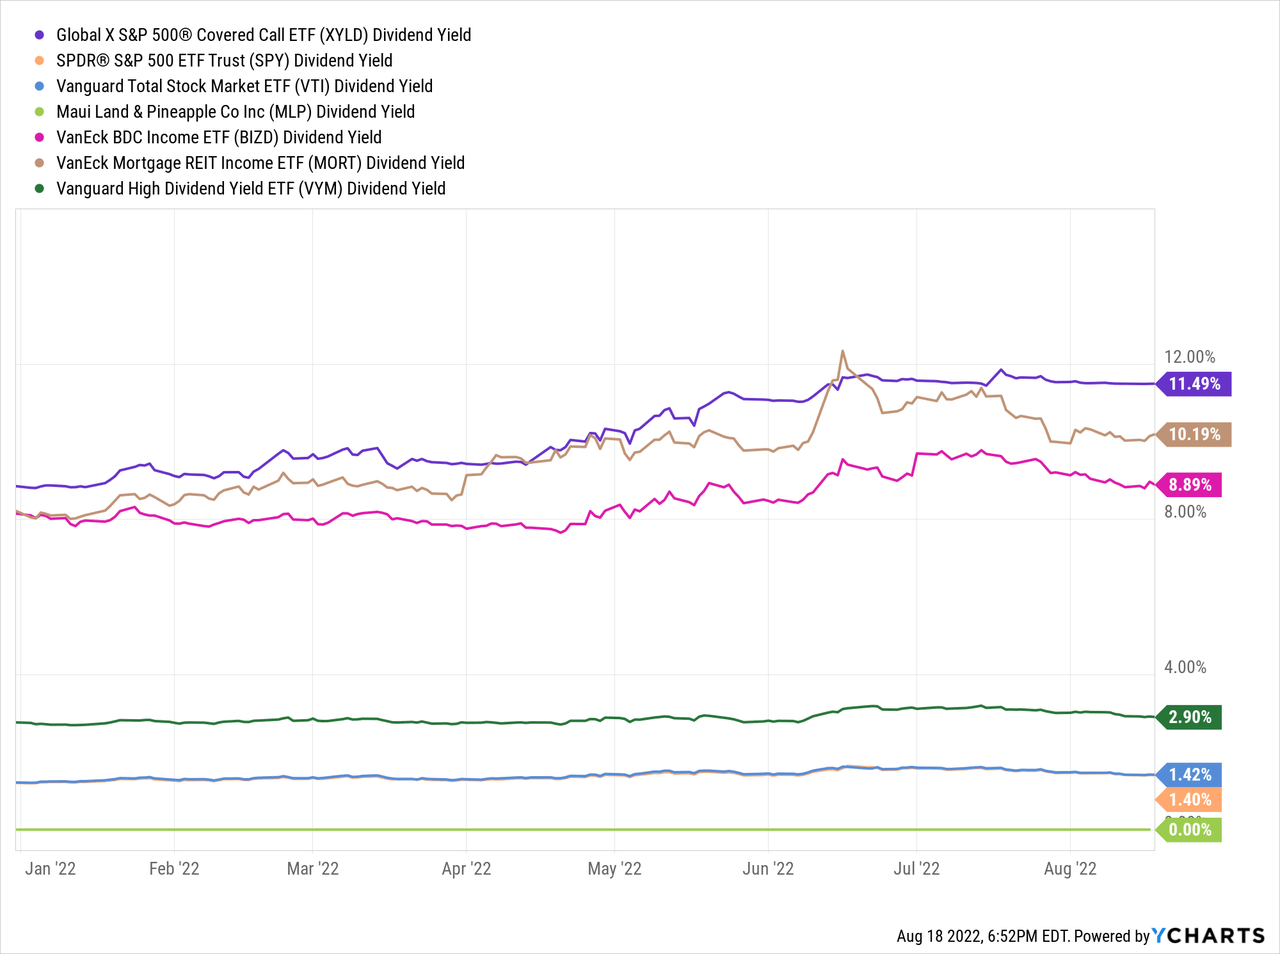
XYLD currently yields 11.5%, significantly higher than the 1.4% offered by the S&P 500, as well as other broad-based equity indexes, and dividend-focused funds. It is also somewhat higher than that of most significant income-producing asset classes, including MLPs, mREITs, and BDCs. It is an outstanding yield that few funds can match, and a significant benefit for the fund and its shareholders.
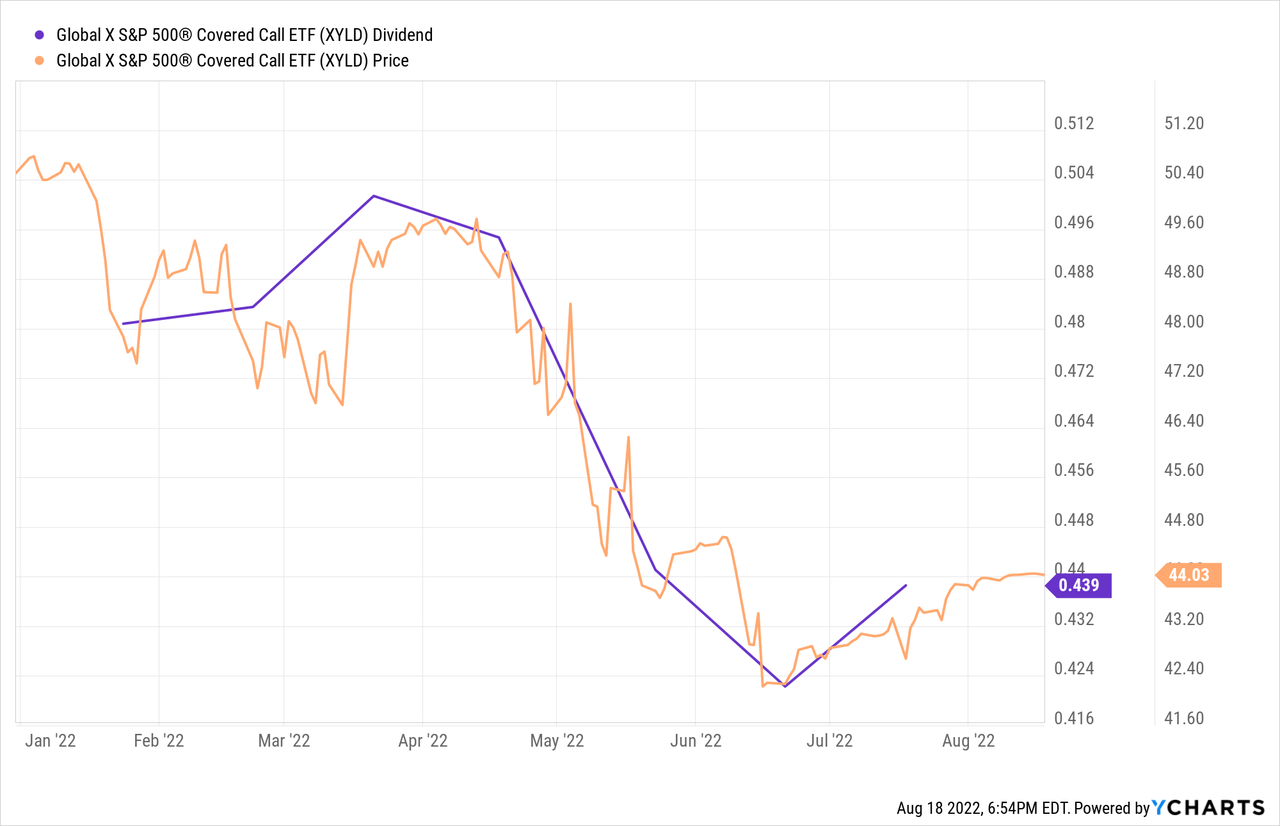
As (implied) equity volatility increases, so does the probability that risky options will be profitable, increasing their price. XYLD sells options, so as option prices increase so does the premiums received by the fund, which are ultimately returned to shareholders in the form of (higher) dividends.
In general terms, selling covered calls is a reasonably sustainable strategy, so the fund’s dividends are reasonably sustainable. XYLD should almost always offer investors a strong yield, but dividends should be volatile, and distribution cuts are possible. On a more positive note, XYLD’s dividends have grown since inception, and by a lot. Growth was mostly due to increased equity volatility, and hence option prices and premiums received by the fund, in the aftermath of the coronavirus pandemic. Volatility is normalizing, so I would not expect positive dividend growth moving forward. Dividend cuts seem somewhat likely, if only because current growth rates seem unsustainable.
Seeking Alpha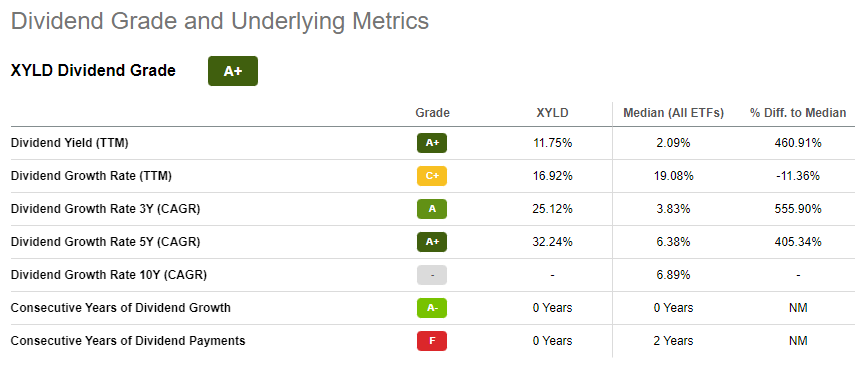
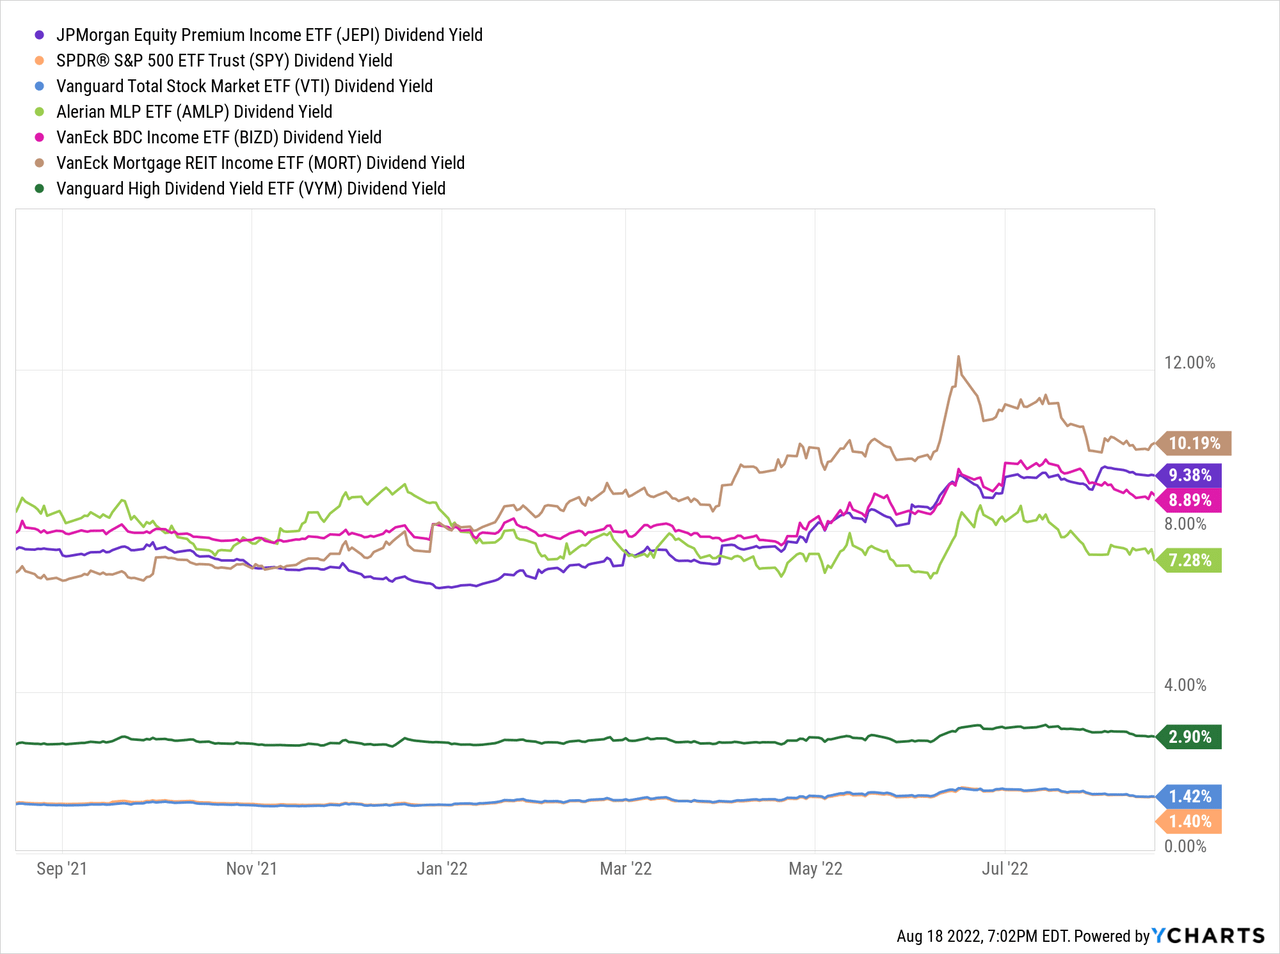
JEPI currently yields 9.4%, significantly higher than the yield offered by most broad-based U.S. equity indexes, as well as most dividend-focused funds. On the other hand, it is not materially higher than the yield offered by significant income-producing asset classes, including MLPs, mREITs, and BDCs, and is slightly lower than XYLD’s 11.5% yield. Still an outstanding yield, but definitely weaker than that of XYLD.
Technically, JEPI’s dividend growth has been lower, but this is almost certainly simply the result of dividend volatility and timing effects.
Seeking Alpha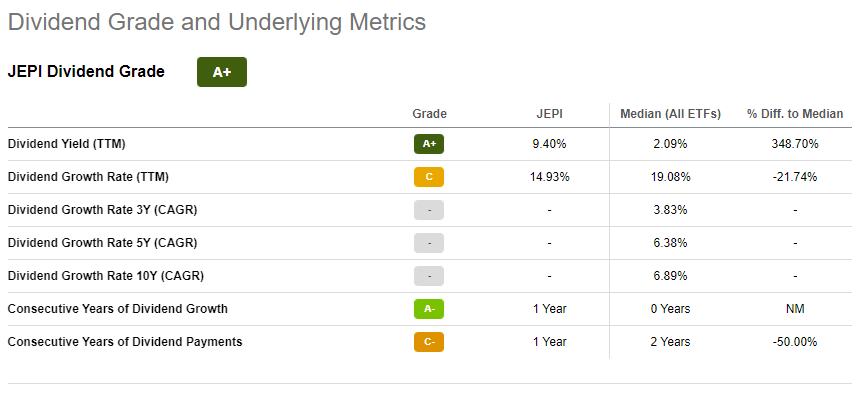
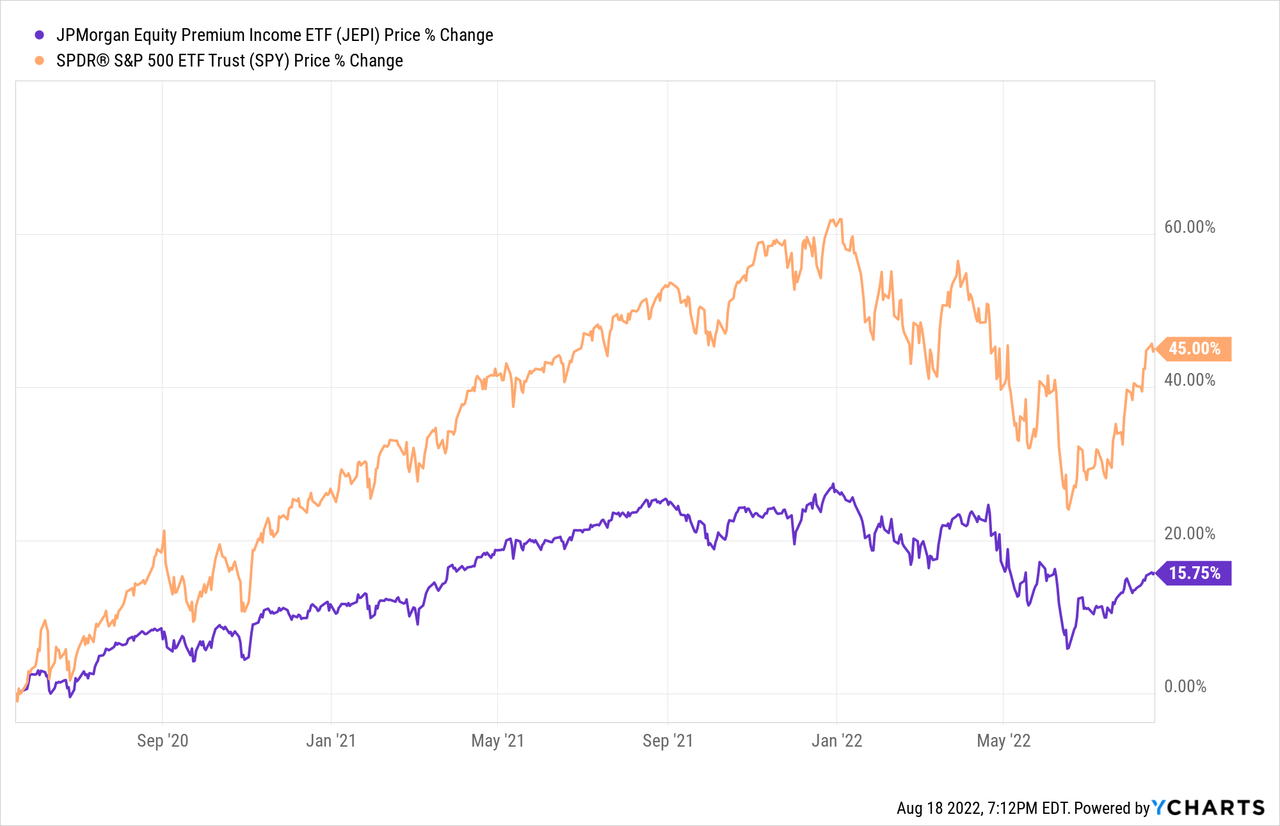
XYLD yields 11.5%, while JEPI yields 9.4%. Although both funds offer investors strong yields, XYLD yields more, an important benefit for the fund, and advantage relative to JEPI.
Capital Gains – JEPI Clear Winner
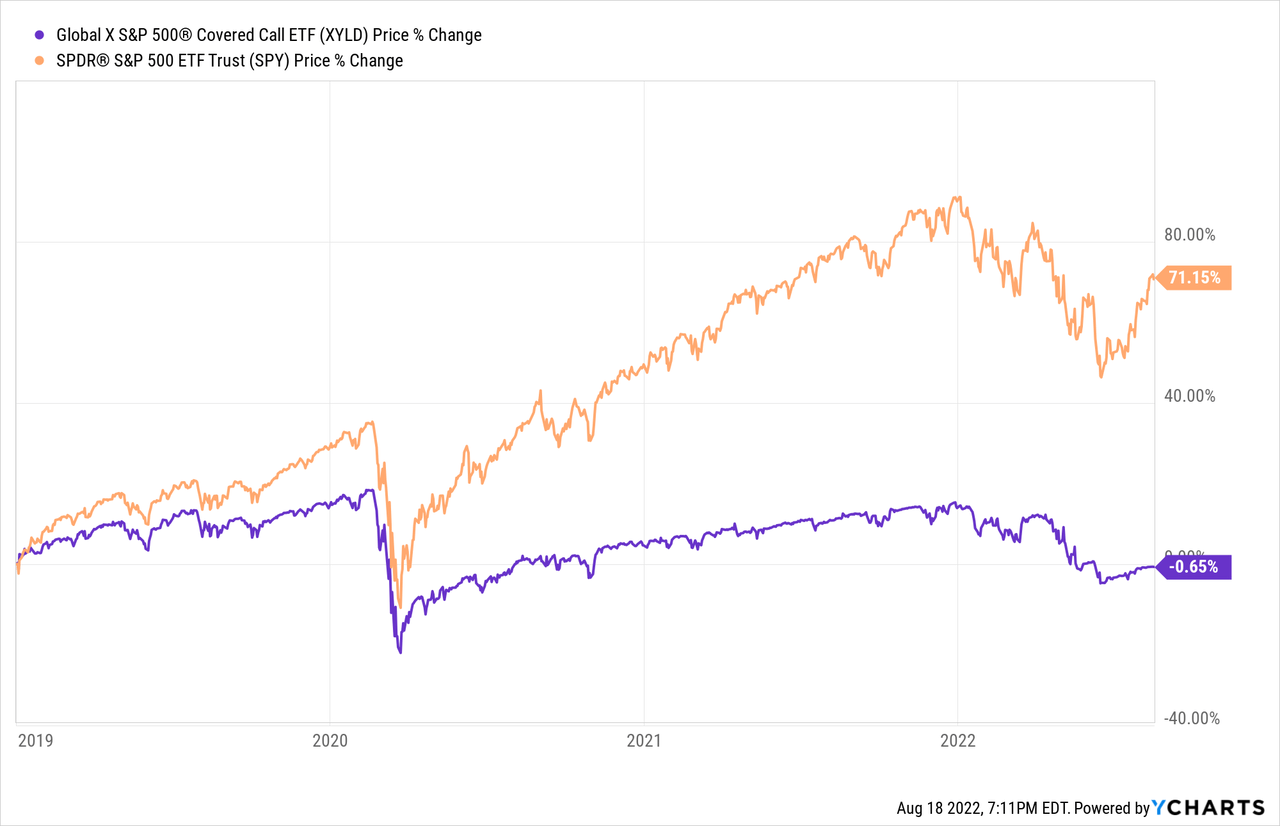
XYLD sells covered calls on the entirety of its holdings. Doing so significantly reduces potential capital gains, while potential capital losses remain the same. XYLD barely goes up during bull markets, but crashes during bear markets. Under these conditions, long-term capital stability is the best investors can hope for, but long-term capital losses are likelier, and the base case scenario.
XYLD itself has seen (roughly) stable capital levels and share prices for years, as equity markets have seen very strong returns. Capital losses are likely as / when conditions worsen, as has been the case since 2021.
XYLD should see small capital losses long-term, while JEPI should see moderate capital gains long-term. JEPI’s potential capital gains are materially higher than those of XYLD, a significant benefit for the fund and its shareholders, and key advantage relative to XYLD.
Potential Total Returns – JEPI Clear Winner
XYLD’s yield is slightly higher than that of JEPI.
JEPI’s potential capital gains are moderately higher than those of JEPI.
As such, JEPI’s potential total returns are slightly higher than those of XYLD, as has been the case since inception.
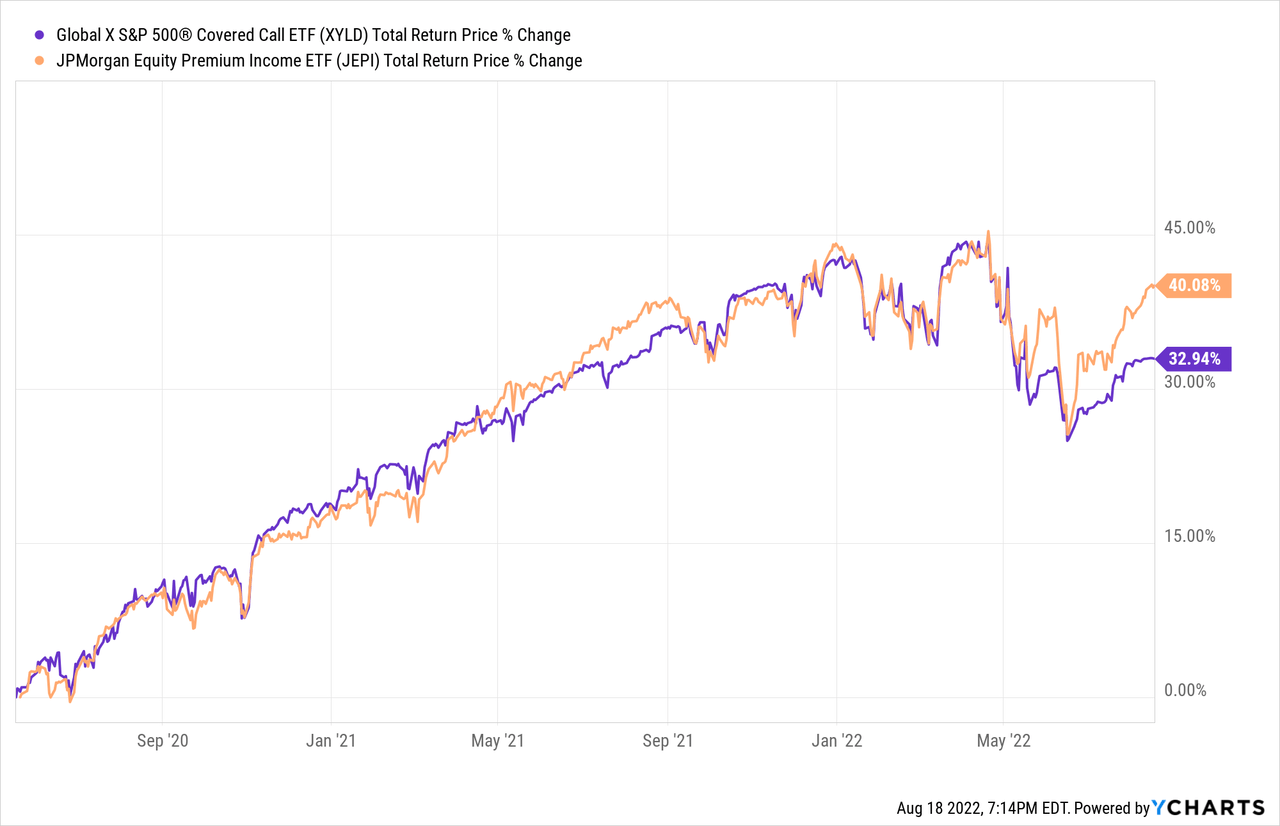
JEPI’s greater potential long-term total returns is a benefit for the fund, and an important advantage relative to XYLD.
Relative Performance In Different Market Scenarios – Tie
Both funds trade away most potential capital gains for increased dividends. The implications and net effect of said trade are dependent on the performance of equity markets in general, and of the S&P 500 in particular.
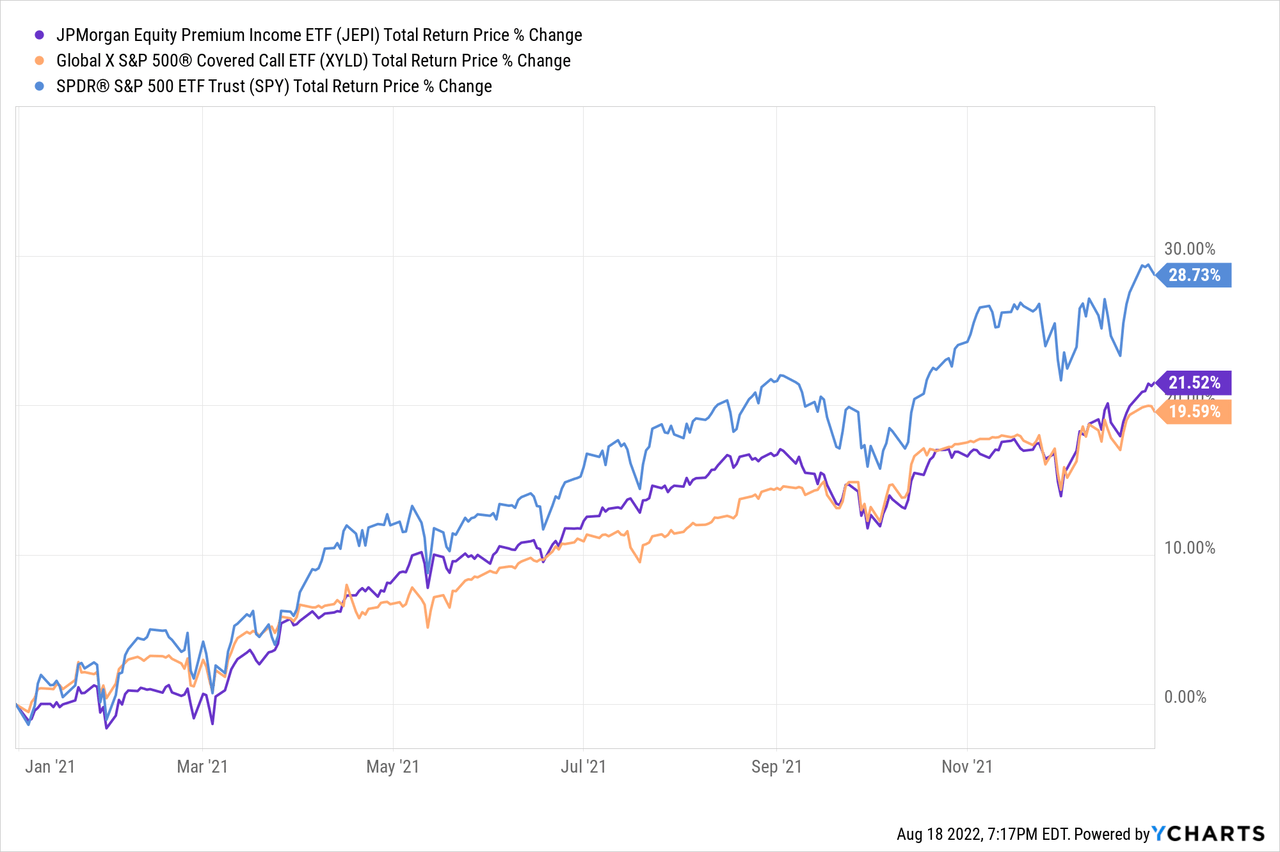
During bull markets, S&P 500 capital gains are high, and so both funds underperform relative to said index. JEPI would likely underperform by less, due to the fund’s equity investments. Both funds underperformed the S&P 500 during 2021, during which the index rallied by more than 28%, as expected.
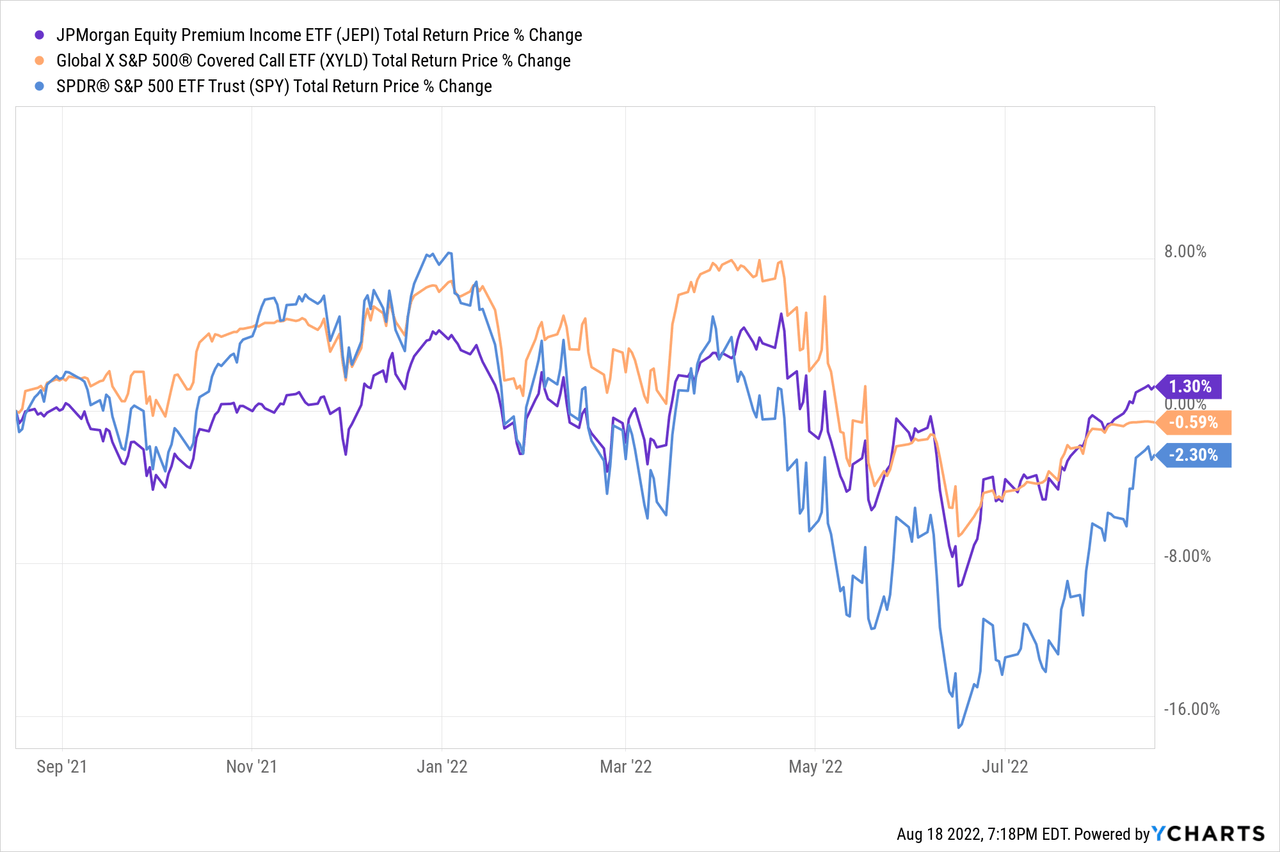
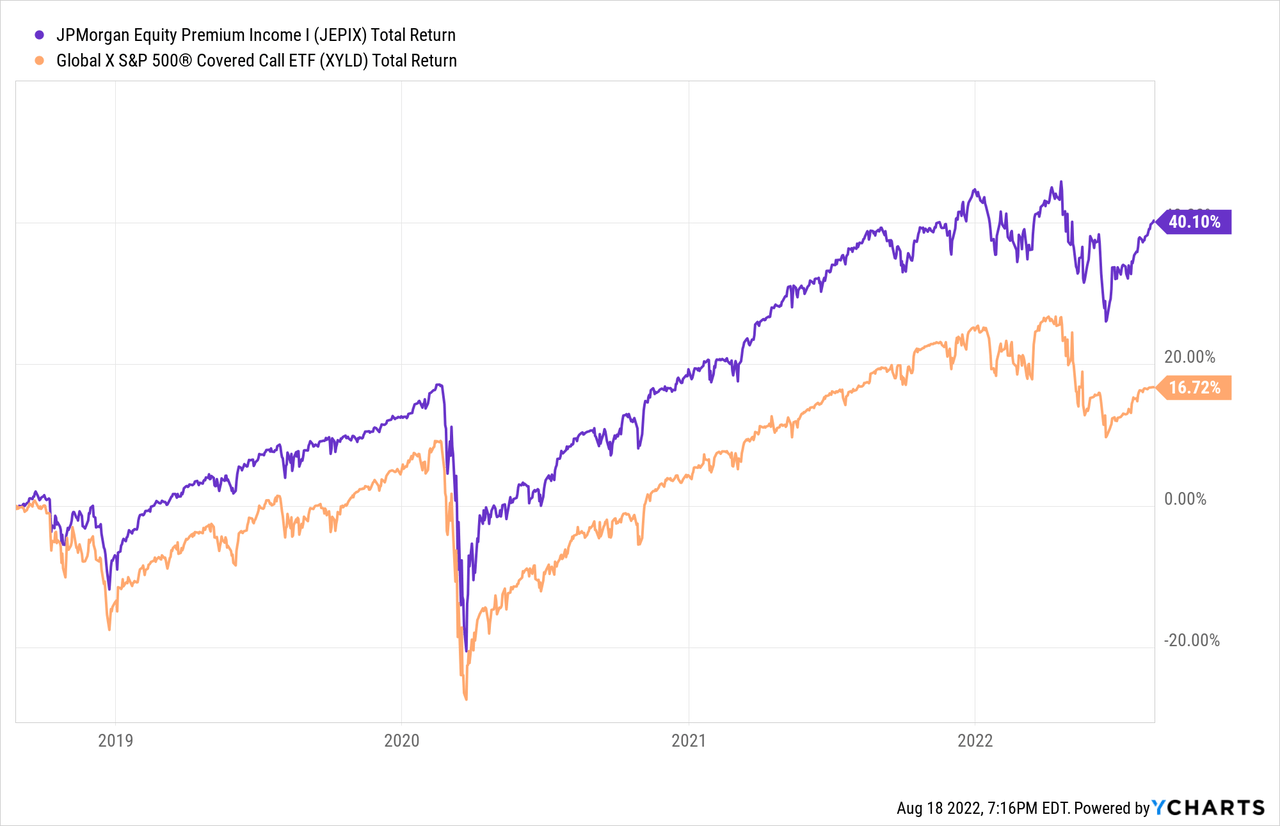
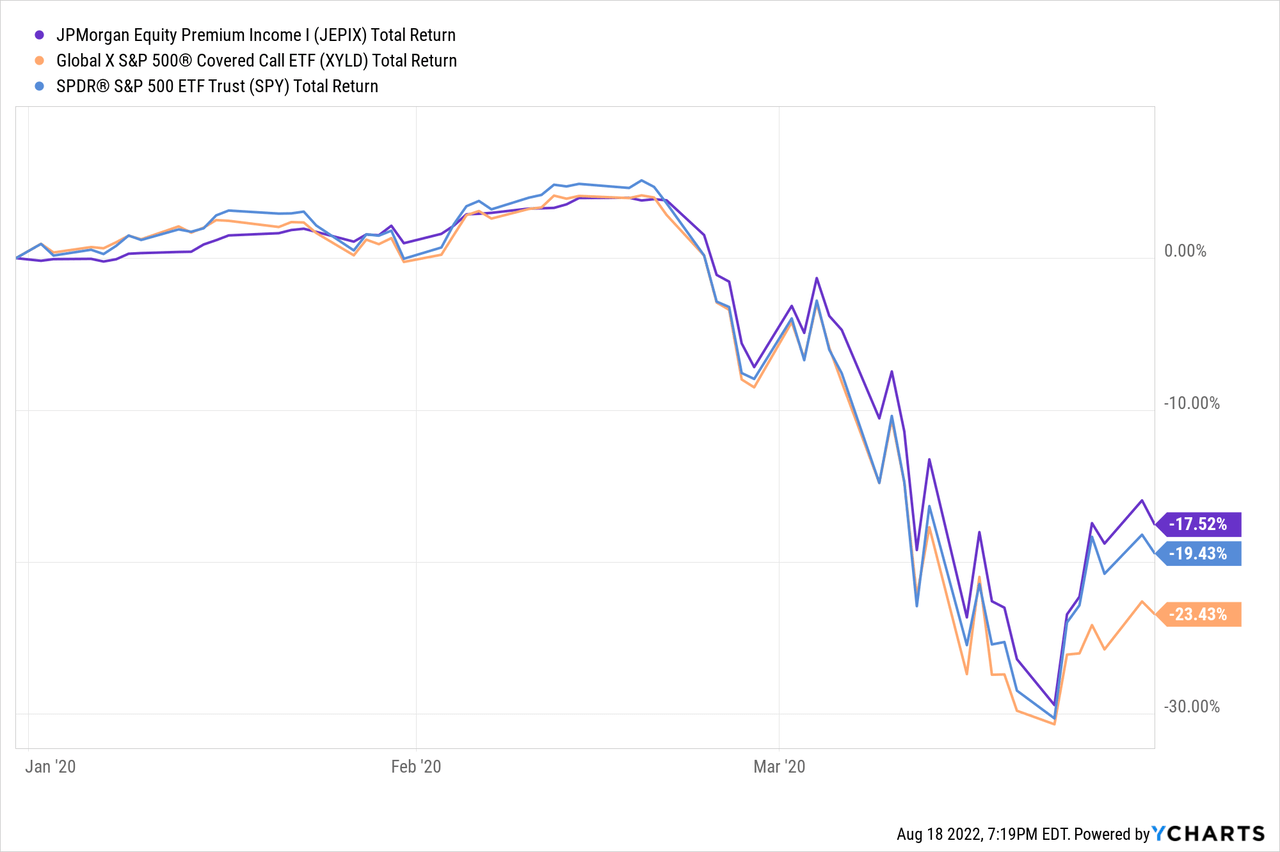
During bear markets, both funds should perform broadly in-line with the S&P 500, as both funds experience capital losses in full. Dividends complicate matters for both funds, as does JEPI’s leverage and low-volatility investments. Still, performance should not significantly differ from that of the S&P 500 during bear markets. Analyzing the performance of both funds during 1Q2020, the onset of the coronavirus pandemic, would be instructive. JEPI did not exist at the time, but its mutual fund companion did. During 1Q2020, XYLD and JEPIX both performed in-line with the S&P 500, as expected.
Importantly, bear markets tend to be followed by stock market recoveries, during which stocks experience significant capital gains. Both funds should underperform during these recoveries, an important fact for investors to consider.
So, both funds underperform during bull markets, performing broadly in-line with equity indexes during bear markets, but should outperform during sideways market movements. This is something of an odd combination, but that is how the funds should perform based on their holdings and strategies, and how they have performed since inception.
Risks – XYLD Clear Winner
XYLD’s overall level of risk is roughly comparable to that of the S&P 500. Performance is somewhat different, but overall risk is more or less the same, as XYLD does not use leverage, nor does its equity investments or industry exposures materially differ from those of its index.
JEPI’s overall level of risk, on the other hand, is higher than that of the S&P 500 and XYLD, although the situation is somewhat complicated.
JEPI’s increased risks center on the fund’s leveraged, complicated, and opaque holdings.
The leverage is, I think, pretty self-explanatory. JEPI’s equity-linked notes are highly leveraged investments, so potential losses are quite high.
JEPI’s equity-linked notes are also complex investments. Performance is dependent on many factors, including their structure, characteristics, industry conditions, and the vagaries of derivatives pricing. Complexity increases risks, as performance could suffer for many different, sometimes unforeseen, reasons.
JEPI’s equity-linked notes are somewhat opaque investments, due to their complexity, if nothing else. Although the fund does provide relevant information concerning these securities, information concerning their expected performance during different market scenarios is not readily available. As an example, I do not know the expected losses of these securities if the S&P 500 goes down by, say, 10%.
On a more positive note, the fund does take steps to limit the risks of the above. JEPI’s equity-linked notes are very risky investments, but the fund only holds a 10%-20% position in these, significantly limiting exposure, risks, and potential losses. JEPI further focuses on low-volatility stocks, which self-evidently further reduces risks. These two strategies have been effective in reducing the risks of the fund’s equity-linked notes, as evidenced by JEPI and JEPIX’s reasonably strong performance during prior downturns, including 1Q2020, and the past few months.
In my opinion, although JEPI is a materially riskier fund than XYLD, risks are manageable, and have been successfully reduced in the past due to appropriate position sizing, asset allocation, and security selection. Still, the risks remain, and could materialize into losses if the fund’s strategy proves less effective in the future.
Conclusion – JEPI Stronger, Riskier Choice
XYLD and JEPI both offer investors strong dividend yields, potential outperformance during sideways market movements, but lower potential capital gains and long-term total returns.
In my opinion, JEPI is the slightly superior investment opportunity, due to the fund’s moderately higher potential capital gains, and slightly higher long-term total returns. Still, both funds are solid investment opportunities, and quite similar to each other.
Be the first to comment