

Scott Olson
If you’re looking for a way to harness volatility in your portfolio, you may want to consider using covered call/buy-write funds in order to accomplish this. This article will focus on S&P-500-based covered call funds, which seek to enhance yield and/or lessen volatility via covered calls.
The JPMorgan Equity Premium Income ETF (NYSEARCA:JEPI) is one of the more heavily-traded covered call funds. It’s a relatively new fund – it IPO’d in May 2020.
Profile:
[The JPMorgan Equity Premium Income ETF] seeks current income while maintaining prospects for capital appreciation. The fund seeks to provide the majority of the returns associated with its primary benchmark, the Standard & Poor’s 500 Total Return Index, while exposing investors to less risk through lower volatility and still offering incremental income. Under normal circumstances, the fund invests at least 80% of its assets in equity securities. It may also invest in other equity securities not included in the S&P 500 Index. (Seeking Alpha – Fund Profile)
[The fund] generates income through a combination of selling options and investing in U.S. large cap stocks, seeking to deliver a monthly income stream from associated option premiums and stock dividends. (JEPI site)
JEPI also invests in Equity-Linked Notes (ELN’s), which it utilizes for income:
The Fund may invest up to 20% of its net assets in ELNs. ELNs are structured as notes that are issued by counterparties, including banks, broker-dealers or their affiliates, and that are designed to offer a return linked to the underlying instruments within the ELN. ELNs in which the Fund invests are derivative instruments that are specially designed to combine the economic characteristics of the S&P500 Index and written call options in a single note form. (JEPI site)
Holdings:
With the market still in the red for 2022, there’s only 1 sector that’s positive, the Energy sector, which is up nearly 31% this year. It also has the highest dividend yield, and the lowest Price/Earnings valuation.
Hidden Dividend Stocks Plus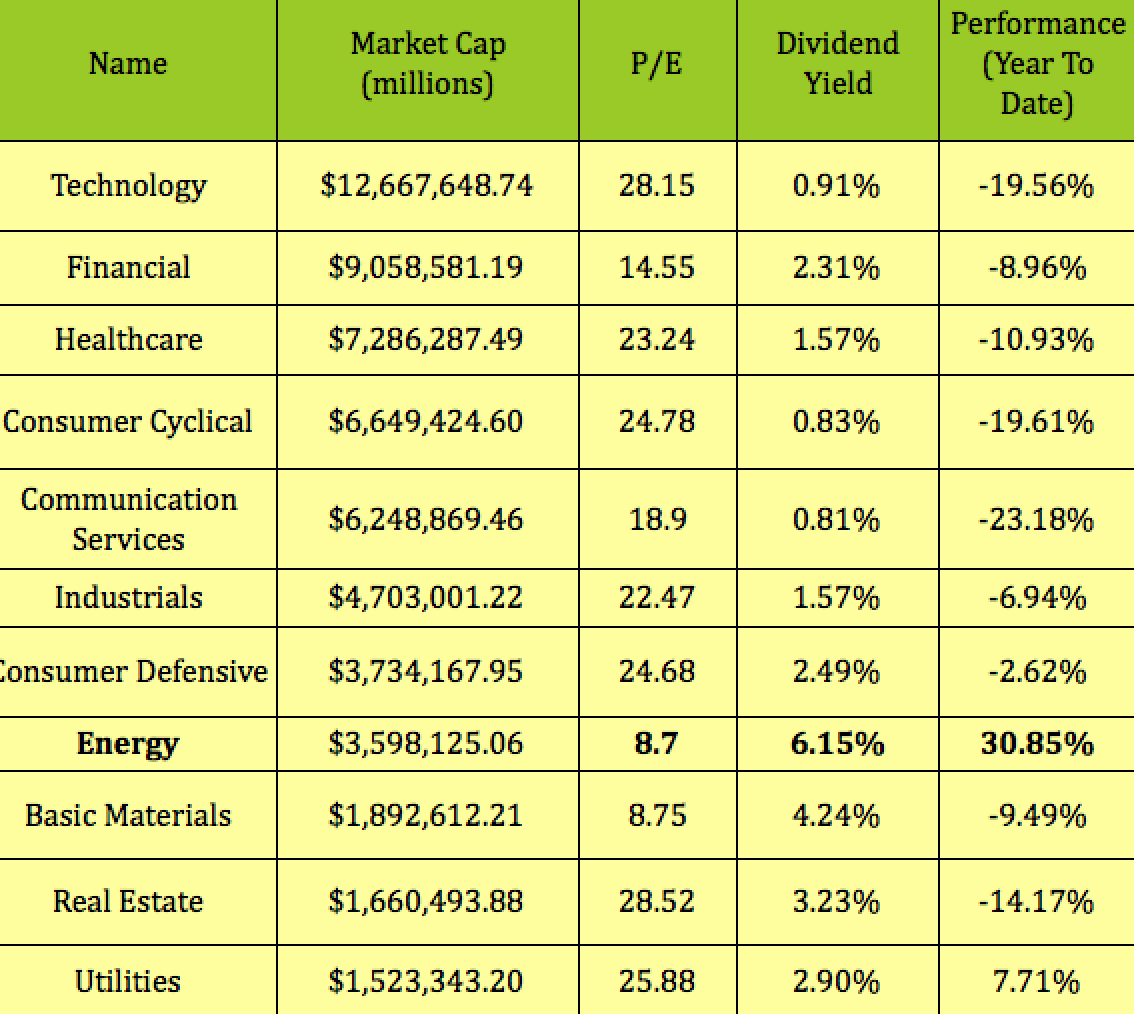
When compared to the S&P 500, JEPI’s sector weightings are quite different, with the fund being underweight in Tech, Financials, Communication Services, Consumer Cyclical and Energy; and overweight in Industrials, Consumer Defensive and Utilities.
JEPI is underweight Energy, but on the plus side, it’s also underweight Tech, Communications Services, Consumer Cyclical, 3 sectors which have lagged the market by wide margins in 2022.
Utilities, Industrials, Consumer Defensive, Healthcare, Tech, and Financials make up ~67% of JEPI’s sector holdings.
Hidden Dividend Stocks Plus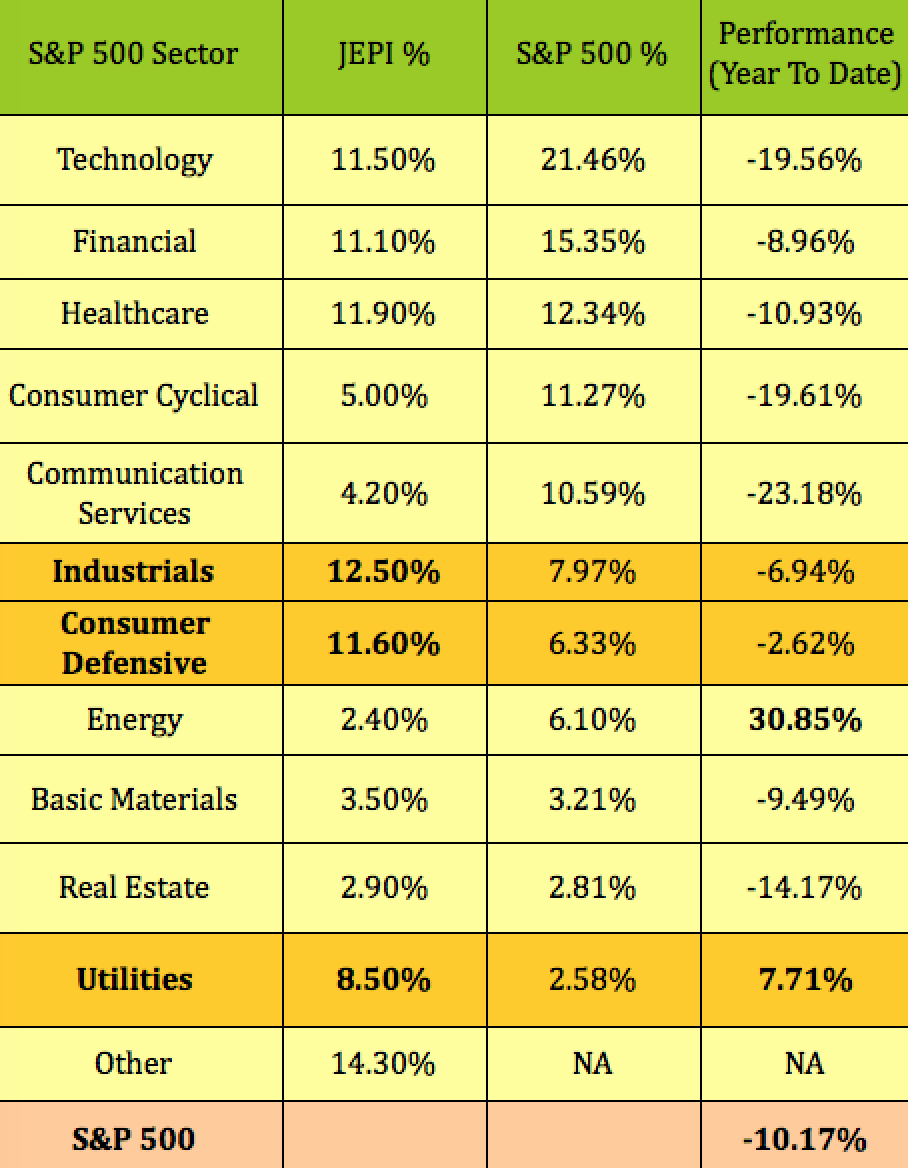
JEPI’s top 10 holdings include small amounts, 1.44% to 1.64%, of familiar large cap stocks Bristol Myers Squibb, United Health, Progressive, Coca-Cola, and Hershey, but also includes an Equity-Linked Note, ELN, which it utilizes for income:
“The Fund may invest up to 20% of its net assets in ELNs. ELNs are structured as notes that are issued by counterparties, including banks, broker-dealers or their affiliates, and that are designed to offer a return linked to the underlying instruments within the ELN. ELNs in which the Fund invests are derivative instruments that are specially designed to combine the economic characteristics of the S&P500 Index and written call options in a single note form.” (JEPI site) ELN’s are denoted by SPX numbered names.
JEPI site
Alternative High Yield S&P Funds:
There are many other S&P-based buy/write funds in the market. If you have a current favorite, we’d like to hear about in the comments section of this article.
We’ve 1 other ETF, the Global X S&P 500 Covered Call ETF (XYLD), and 4 Closed End Funds, CEF’s in this group:
Eaton Vance Tax-Managed Buy-Write Income Fund (ETB)
Nuveen S&P 500 Buy-Write Income Fund (BXMX)
Nuveen S&P 500 Dynamic Overwrite Fund (SPXX)
BlackRock Enhanced Capital and Income Fund (CII)
JEPI is the newest and largest of these funds, with a 5/20/20 inception date, and assets of $11.55B. The Global X S&P 500 Covered Call ETF is the next largest, $2B in assets, followed by the Nuveen BXMX CEF, with $1.4B in assets.
The BlackRock CII CEF, has $874M in assets; ETB has $404M, and SPXX is the smallest in the group, with $282M in assets.
JEPI has the biggest average daily volume by far, at 2.4M, followed by XYLD at 467K, BXMX at 174K, and CII at 103K. The other 2 funds, SPXX and ETB, trade less than 100M shares/day on average.
JEPI has the lowest expense ratio, at 0.35%, followed by XYLD, at 0.60%. The 4 CEFs’ expenses run at ~0.90%, except for ETB’s, which are 1.10%.
SPXX and XYLD have the broadest amount of exposure, with 530 and 504 holdings respectively. BXMX has 258, ETB has 182, JEPI has 122, and CII has just 56.
BXMX and SPXX pay quarterly, while the other 4 funds pay monthly:
Hidden Dividend Stocks Plus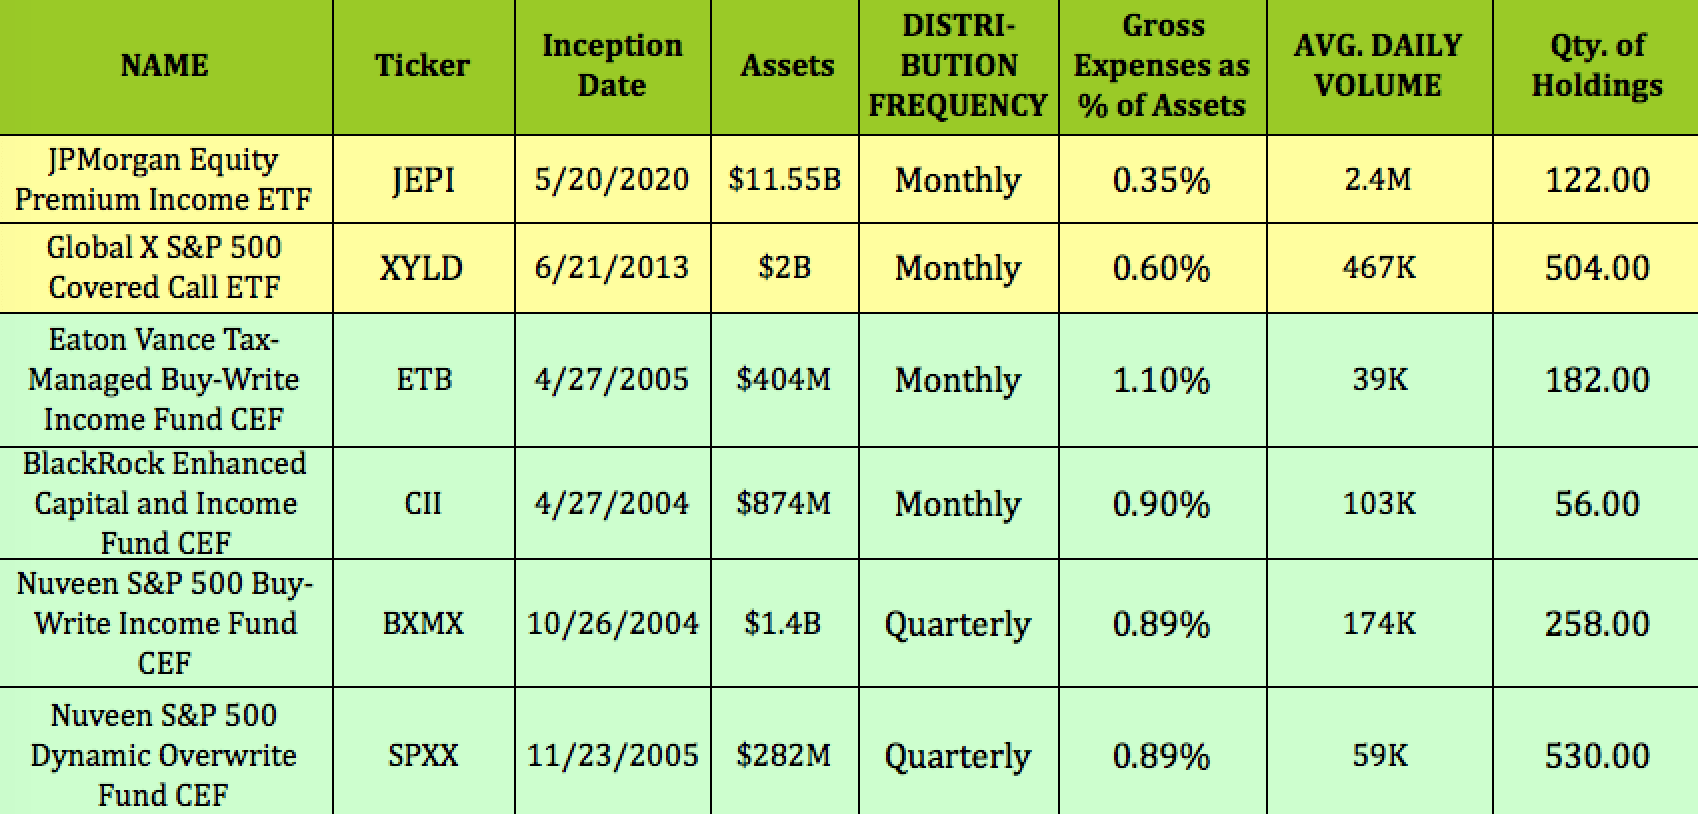
Dividends:
JEPI pays a variable monthly distribution, so we looked at its dividend yield on a trailing and forward basis. Its current trailing dividend yield is 9.40%, while its forward yield is much higher, at 10.51%. It should go ex-dividend next on ~9/1/22, with a ~9/7/22 pay date.
XYLD has the highest forward and trailing dividend yields in the group, at 11.71% and 10.65% respectively. It should go ex-dividend next on ~9/20/22, with a ~9/28/22 pay date.
Two of the CEF’s, ETB and CII, also pay monthly, and yield ~8% and ~6% respectively. ETB goes ex-dividend next on 8/23/22, with an 8/31/22 pay date. CII should go ex-dividend next on ~9/14/22, with a 9/30/22 pay date.
The other 2 CEF’s, Nuveen’s BXMX and SPXX, both pay quarterly. BXMX yields 7.17%, and SPXX yields 7.41%. Both should go ex-dividend next on ~9/14/22, with a ~10/3/22 pay date:
Hidden Dividend Stocks Plus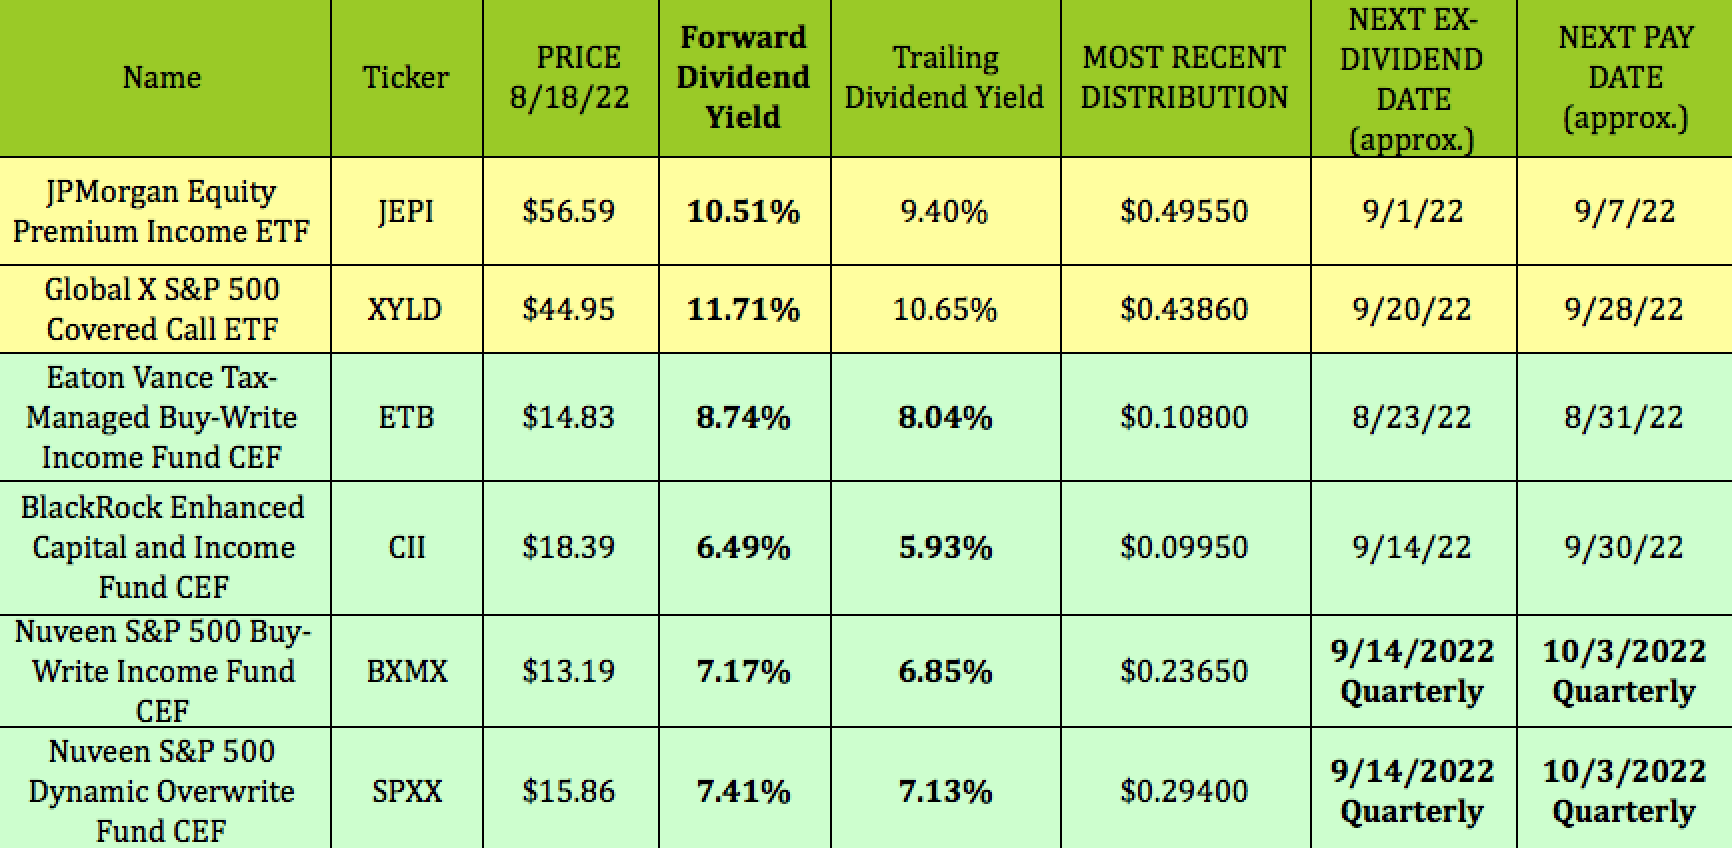
Valuations:
While ETF’s typically track their NAV/Share closely, CEF’s can trade at wide discounts or premiums. It’s a lagging valuation, done after the end of the trading day. Buying CEF’s at a deeper discount, or lower premium than their historic averages can be a very useful strategy.
Unfortunately, we’re not seeing that situation in any of the CEF’s in this group, as 3 of them, BXMX, SPXX, and CII, are trading at lower discounts to NAV than their 1-, 3-, and 5-year averages.
ETB is enjoying a much higher premium to NAV, 11.83%, than its 1-, 3-, and 5-year averages, which range from 3.65% to 5.96%:
Hidden Dividend Stocks Plus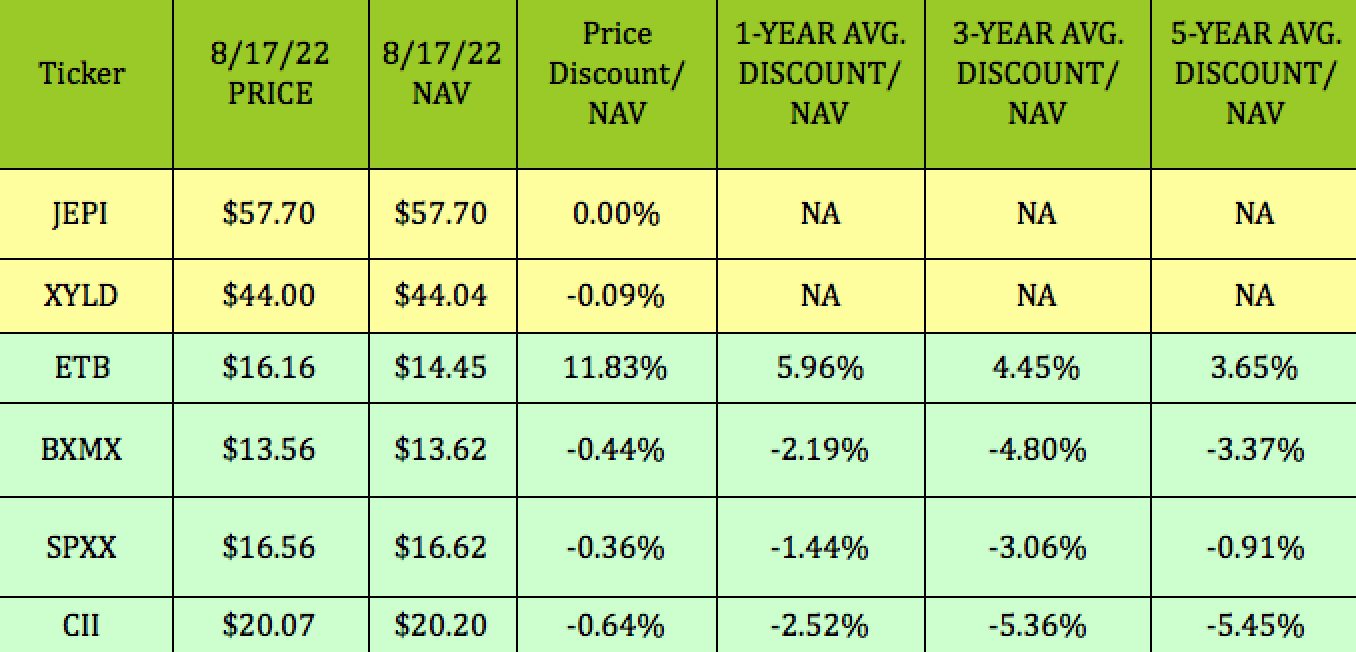
Performance:
While all 6 of these funds were in the red over the past year, and so far in 2022, the 4 CEF’s had positive gains over the past quarter, with ETB and CII outperforming the S&P on a price basis.
More recently, in the past month, CII is the only fund in this group to outperform the market.
Hidden Dividend Stocks Plus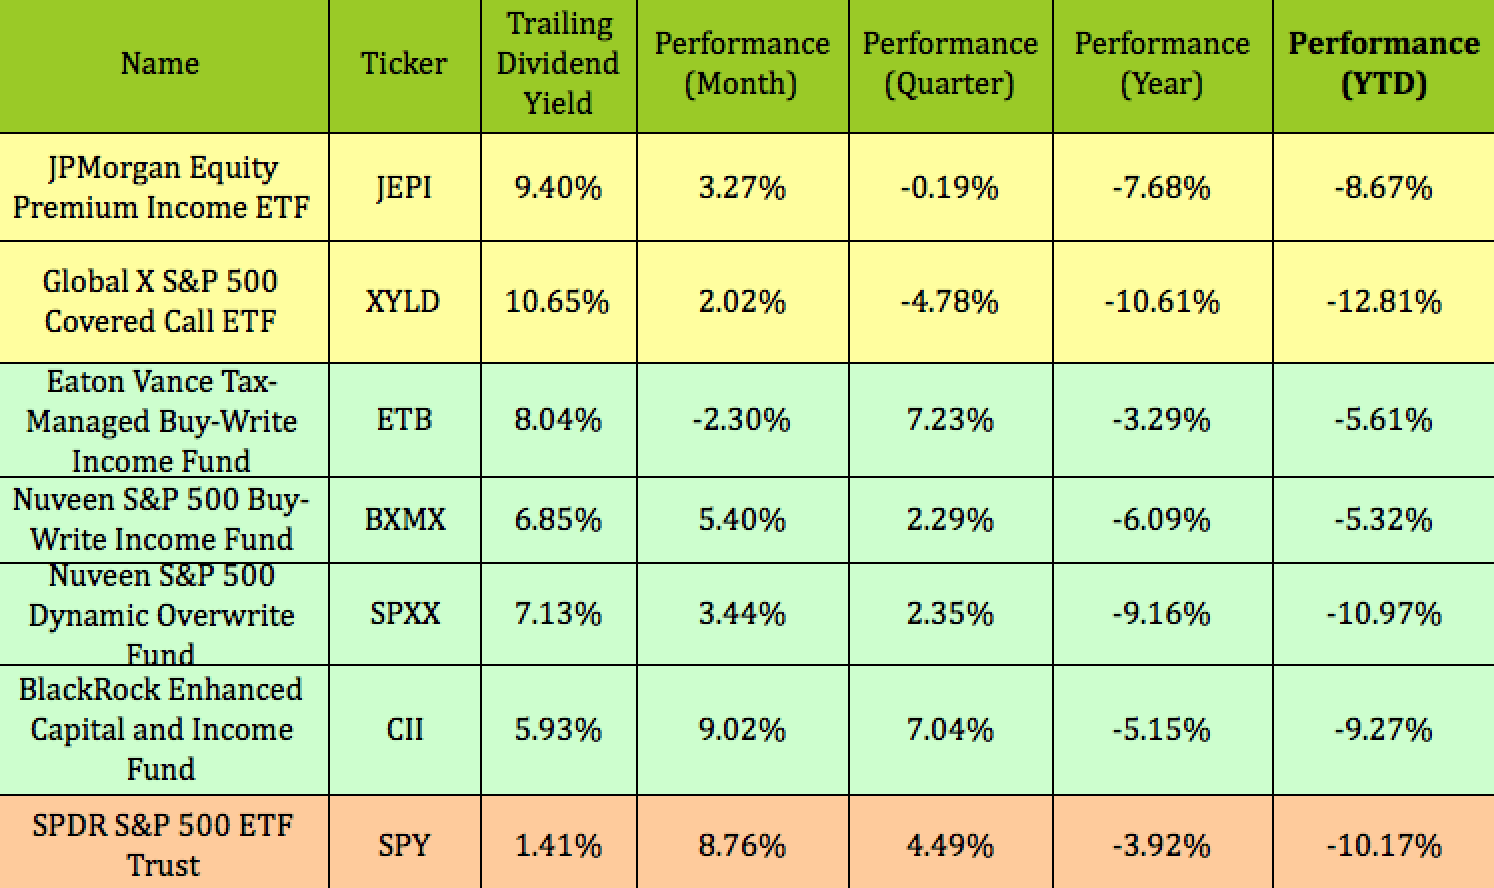
However, income investors are looking for a total return, which factors in dividends/distributions.
Looking at the group on a 1 year total return basis shows that all 6 of these funds bested the S&P 500.
Eaton Vance’s ETB came out on top over the past year, with a total return of ~4.75%, vs. ~-2.51% for the S&P. JEPI was next, at 1.72%, followed by CII, at 0.78%, BXMX, at 0.76%, XYLD, at 0.04%, and SPXX, which had a negative total return of -2.03%:
Hidden Dividend Stocks Plus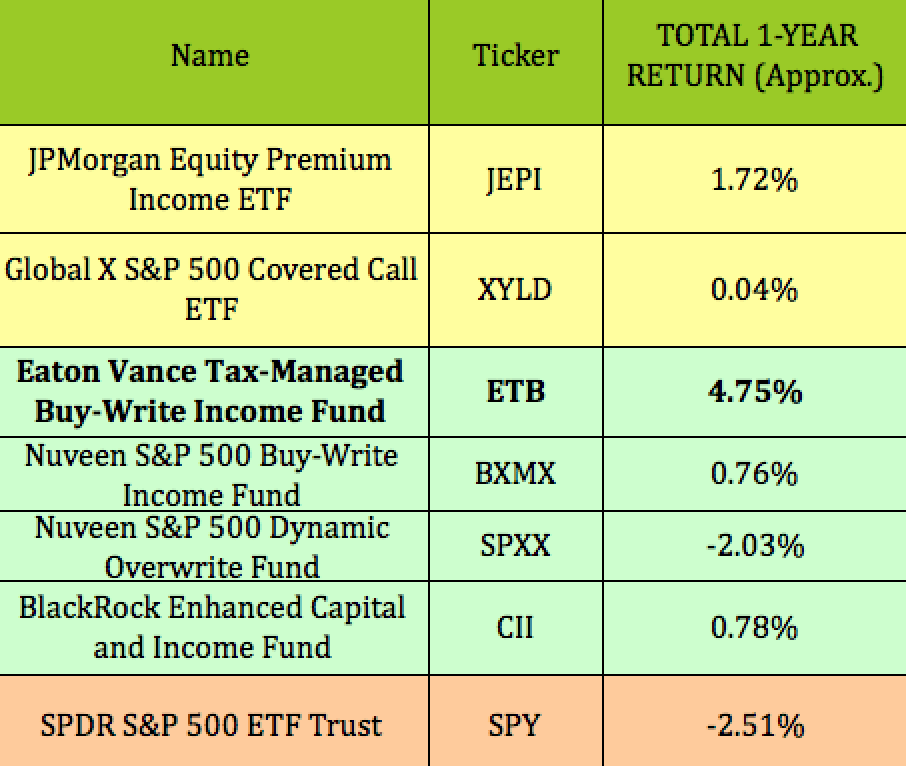
Of course, looking back for just 1 year shouldn’t be the final arbiter of total return performance. This 10-year total return chart tells a different story, one in which CII was the clear leader, distantly followed by ETB and XYLD, with JEPI, BXMX and SPXX in the bottom tier:
Ycharts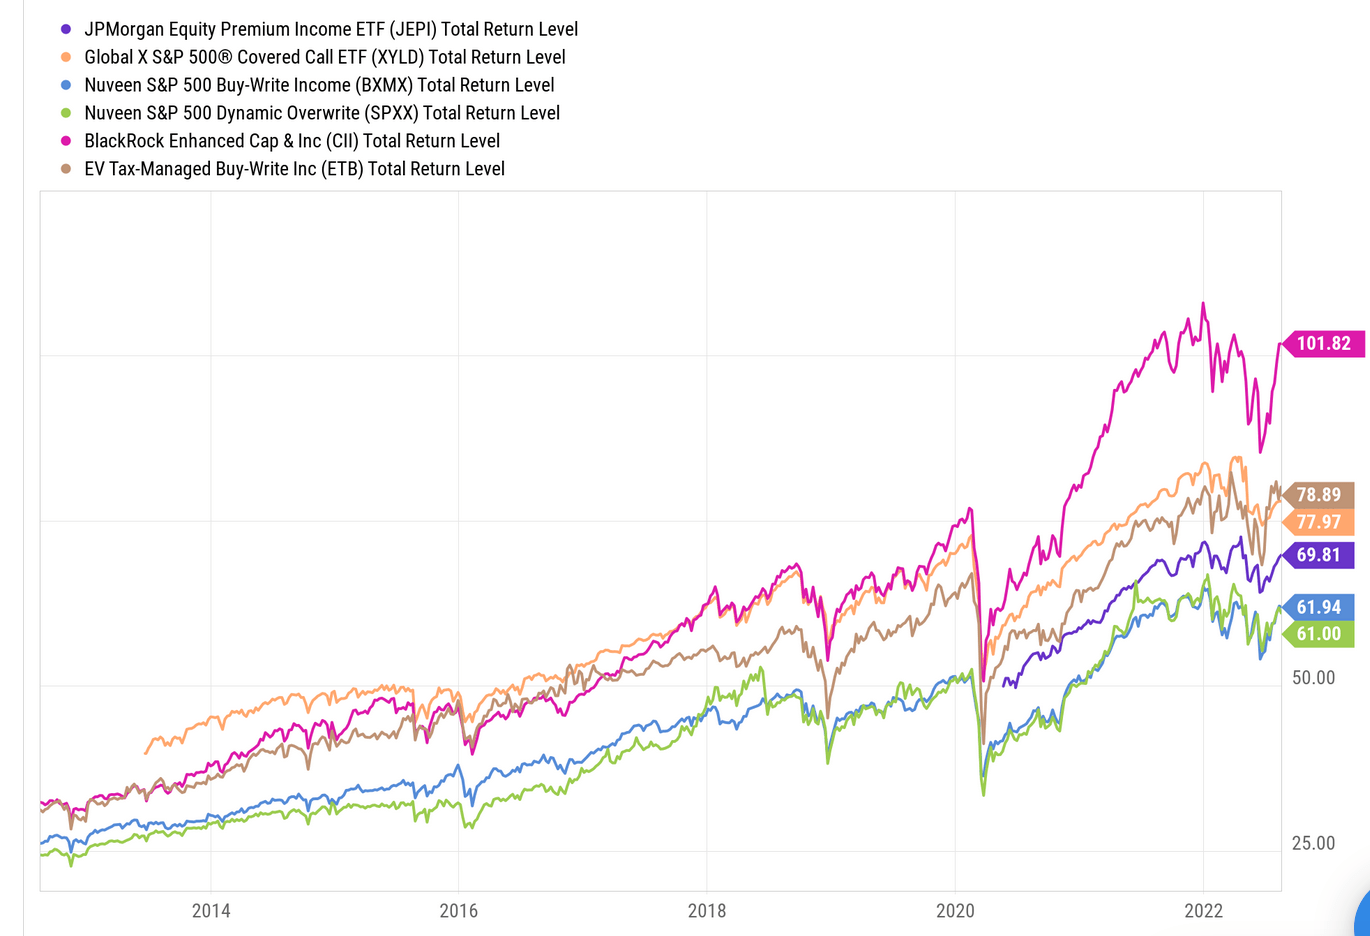
Parting Thoughts:
Down markets, like the one we’ve had in 2022, are the environment that covered call funds were made for – they harness volatility, and mitigate your portfolio’s losses with their high yield options premiums. However, the perennial challenge is trying to decide if you should sell them, if the market rebounds, as they’ll limit your upside in a rising market.
If you’re interested in researching other high yield vehicles, we cover them every Friday and Sunday in our articles.
All tables by Hidden Dividend Stocks Plus, except where otherwise noted.
Be the first to comment