

USD/JPY, EUR/JPY, GBP/JPY, AUD/JPY Talking Points:
- The Japanese Yen has remained on the move as risk aversion has started to rear its ugly head across global markets.
- Given the BoJ stance the pair can remain as an outlier, seeing weakness during risk-on periods and strength during risk-off scenarios. The Yen can remain as an interesting venue for macro themes.
- The analysis contained in article relies on price action and chart formations. To learn more about price action or chart patterns, check out our DailyFX Education section.
The anti-risk Yen was well-bid earlier in the week as fears continued to drive through markets following the Russian invasion of Ukraine. While war always carries a degree of uncertainty, the divorce of Russia from the Western economic system has entailed some strong reverberations, and this is something we may see with inflation for months or maybe even years to come.
With hope permeating the backdrop today for some element of calm in the situation in Ukraine, many of those risk-off setups have pulled back, and this includes the Japanese Yen, particularly against currencies like the Euro or the British Pound.
This can spell for some continued excitement in the FX space, with the Yen offering some element of exposure to the risk-on/risk-off scenario that’s recently driven volatility level. Below I look at four of the more popular Yen pairs.
USD/JPY
The major of USD/JPY has been remarkably quiet while the fireworks have went off elsewhere, and this can be explained by the fact that both currencies can see safe-haven flows during times of panic.
The USD has held up on the expectation of higher rates while the Japanese Yen has been bid relatively-well elsewhere, like EUR/JPY or GBP/JPY, as carry trades unwound. But with inflation remaining high and the Fed geared up to hike rates next week, which may lead to a series of rate hikes thereafter, there’s been a bullish factor in USD/JPY that’s offset the Yen-strength seen elsewhere.
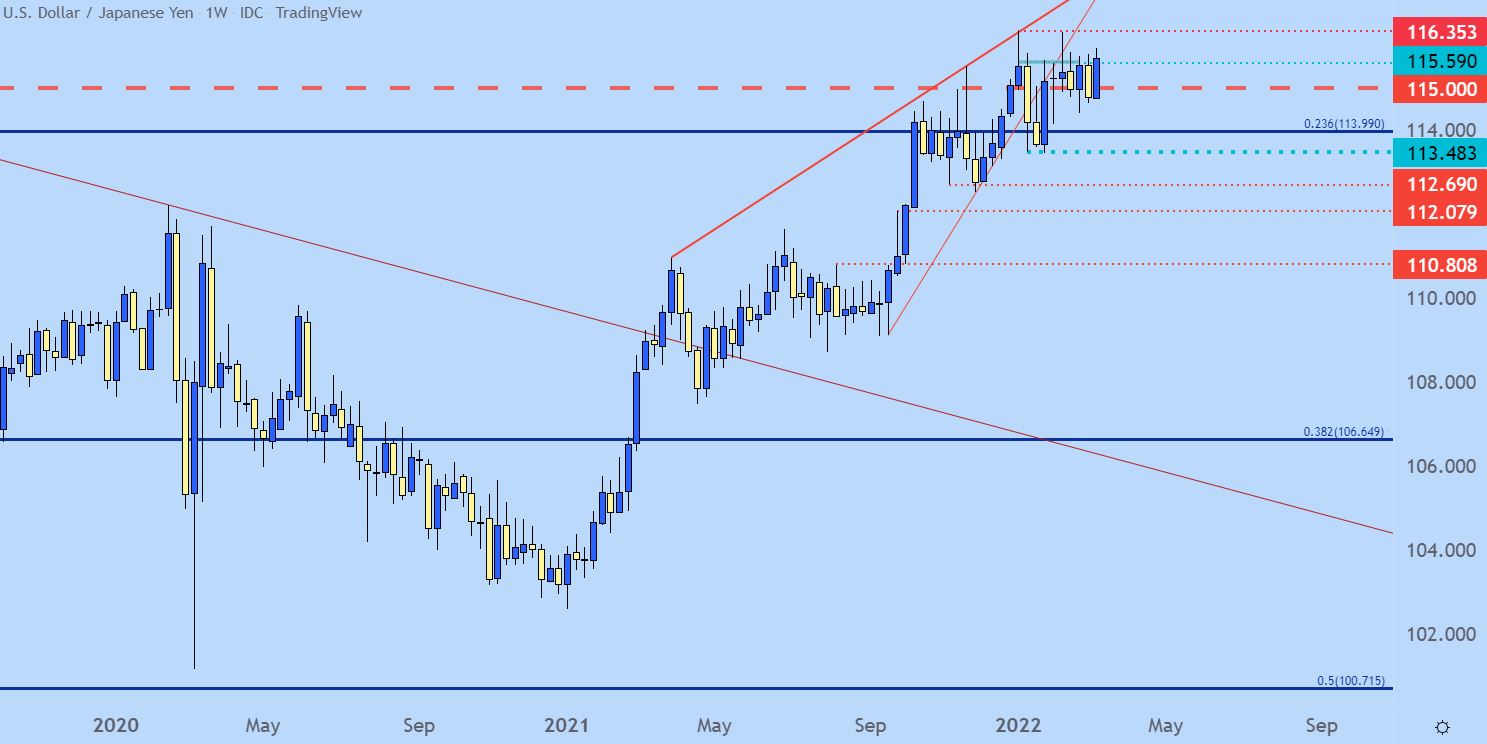
On the weekly chart below we can see where prices in the pair have largely been range-bound over the past six weeks. But – there has been expansion in the body-width of each of these weekly candles, indicating that a break in one direction or the other may soon be in the cards.
USD/JPY Weekly Price Chart
Chart prepared by James Stanley; USD/JPY on Tradingview
USD/JPY Shorter-Term
From the daily chart below we can get a more granular look at that recent range. Today has seen prices push up for a quick three-week-high, but price action has been very choppy here and traders should remain cautious until a more clear sign of trend avails itself.
The peak support/resistance is around 300 pips wide, meaning the range could still remain as an attractive condition to work with, near-term. Bigger-picture, my bias remains bullish, but this will likely be contingent on continued risk-on behavior in markets and there may simply be more amenable venues with cleaner setups for such approaches elsewhere.
USD/JPY Daily Price Chart
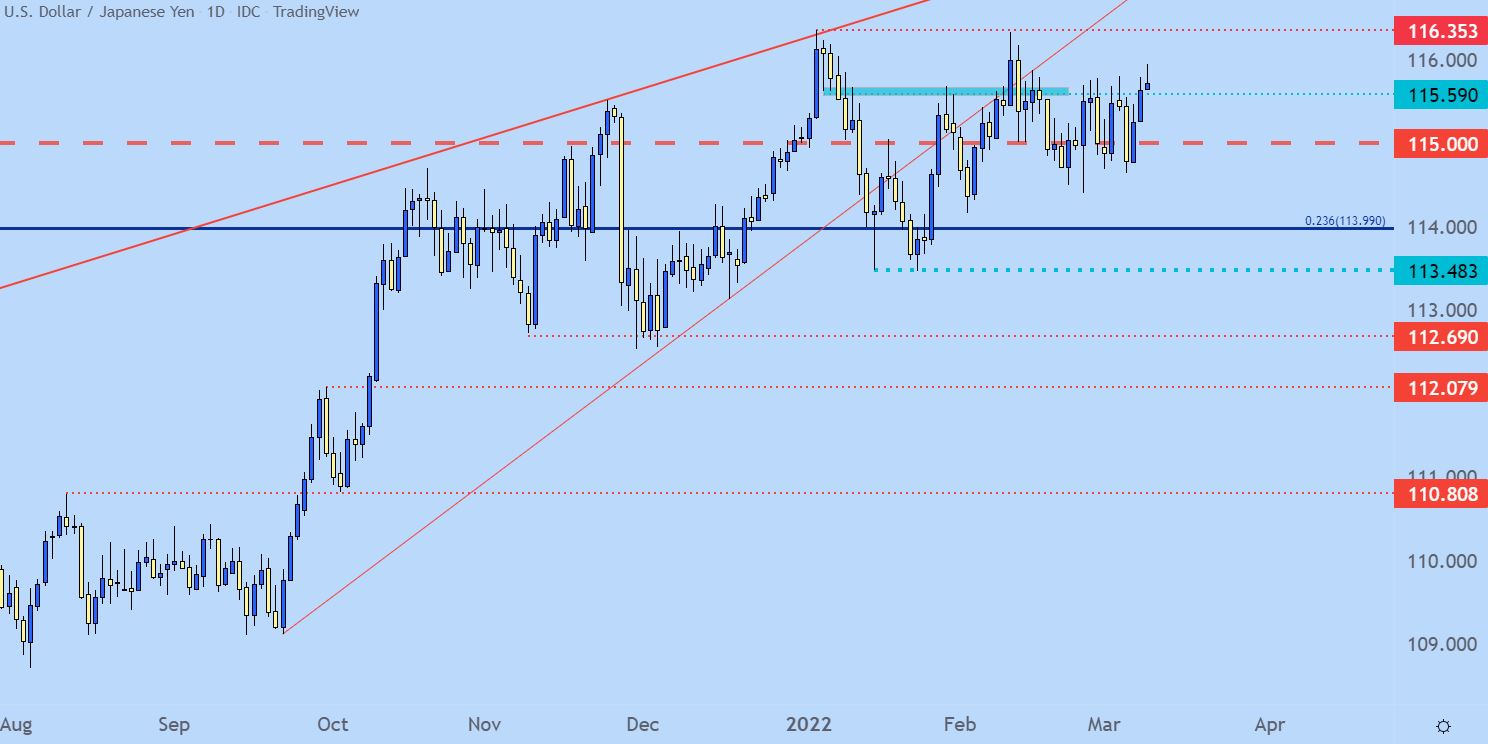
Chart prepared by James Stanley; USD/JPY on Tradingview
EUR/JPY
On that risk aversion theme, EUR/JPY broke down in a big manner of recent. I wrote about the setup a couple of weeks ago before the breakdown hit, focusing in on a longer-term descending triangle formation. Such formations will often be approached with the aim of bearish breakouts which, so far, has happened.
This allowed for prices to slide all the way below the 125.00 psychological level, which came into play on Monday before buyers started to show up. That has since led to a pullback right to prior triangle support, around the 127.50 psychological level.
EUR/JPY Daily Price Chart
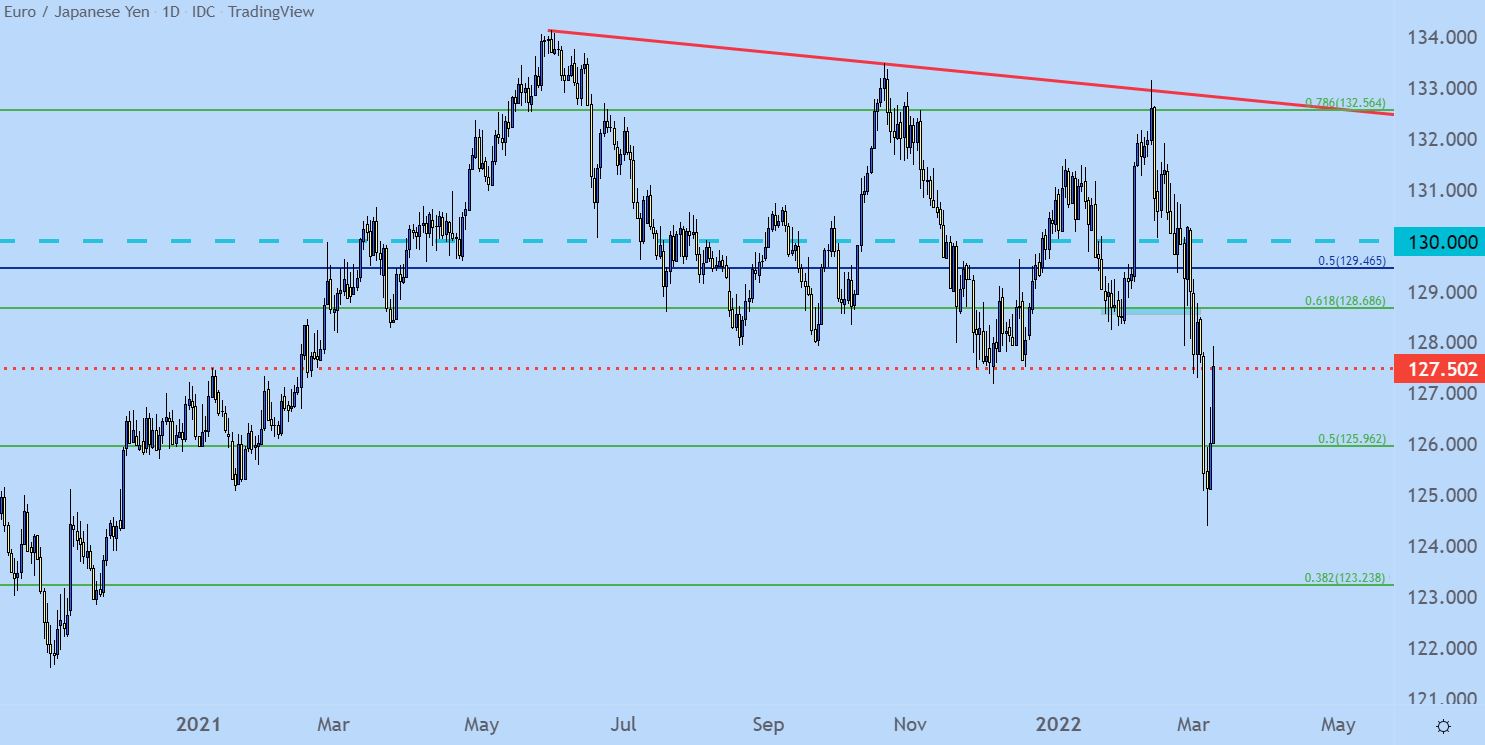
Chart prepared by James Stanley; EUR/JPY on Tradingview
EUR/JPY Remains of Interest for Risk-Off Scenarios
If we do see continued risk aversion, EUR/JPY remains an attractive venue. Prices are at near-term resistance currently with the re-test of prior support; and there’s another possible spot of resistance a little higher, around 128.68, which was a prior spot of support that hasn’t been tested much for resistance yet. And beyond that is another spot of possible resistance running from 129.47-130.00.
EUR/JPY Four-Hour Price Chart
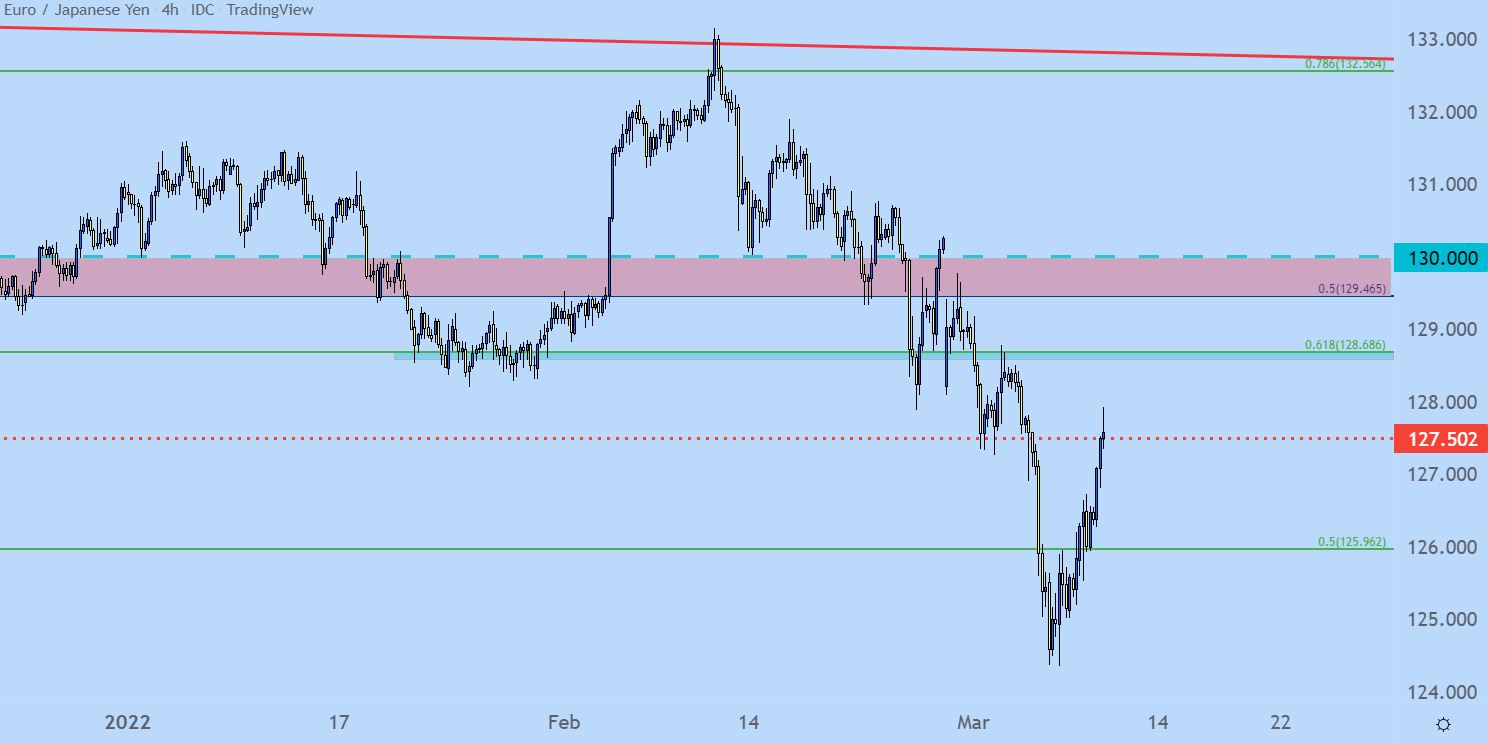
Chart prepared by James Stanley; EUR/JPY on Tradingview
GBP/JPY
GBP/JPY was similarly slammed as risk aversion hit global markets. And while the pair may not have registered a yearly low like EUR/JPY above, there was a fairly clear theme of one-sided selling, unlike what we looked at in USD/JPY.
But, taking a step back on the chart and that short-side move may have more room to run. And we can combine that with the fact that the bounce this week has been more meager than what’s shown in EUR/JPY.
While the fundamental situation around the Euro seems more dire than GBP, GBP/JPY didn’t repel down to a fresh yearly low while EUR/JPY did. So, logically, at least some of that move that we’re seeing today is short-cover in EUR/JPY that isn’t quite carrying as much weight in GBP/JPY.
This can keep GBP/JPY as attractive for continued downside until longer-term support might come into play, around the same 148.50-149.00 area that’s been in-play since last March. For short-term resistance, 153 and 155 remain of interest for lower-highs.
GBP/JPY Daily Price Chart
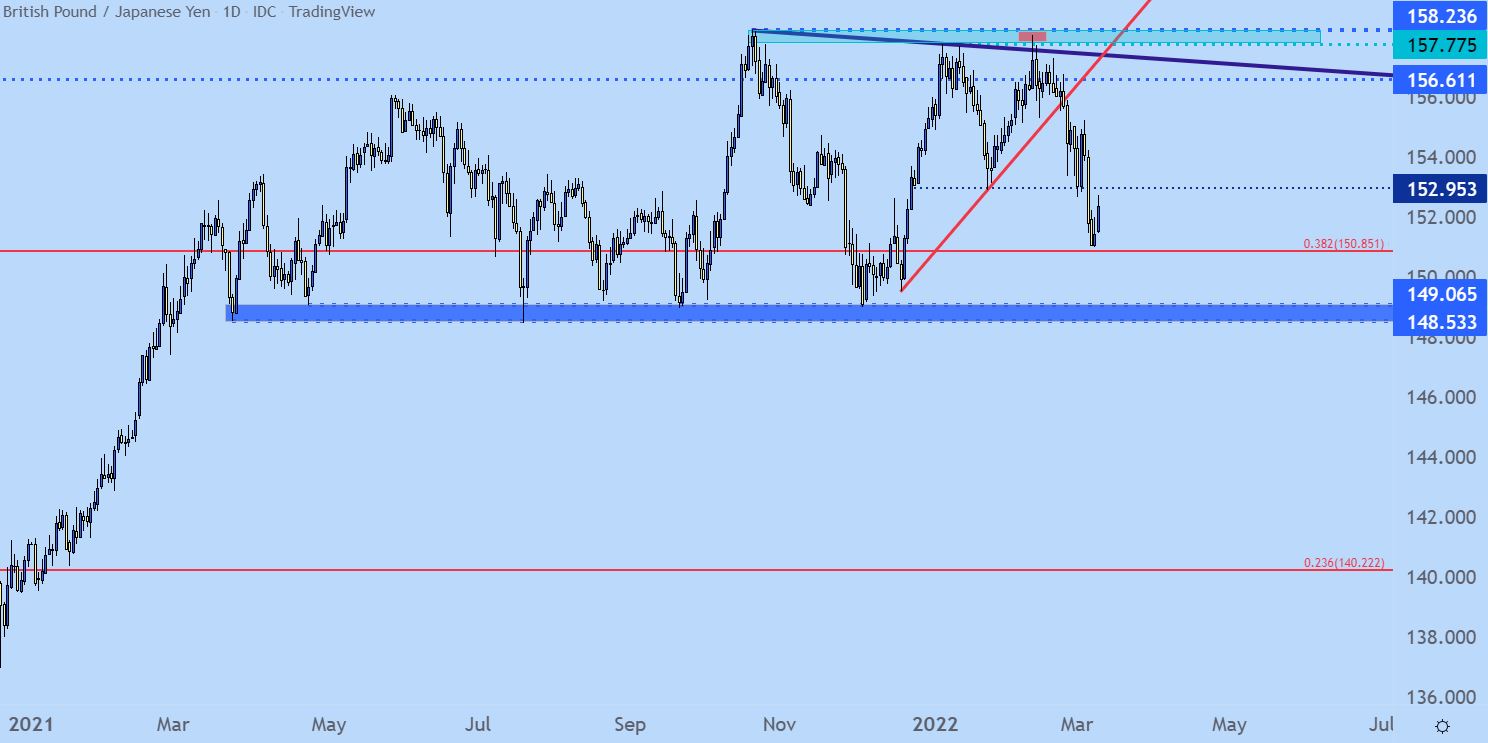
Chart prepared by James Stanley; GBP/JPY on Tradingview
AUD/JPY
With the surge in commodity prices of late the Australian Dollar has remained really strong, getting another shot-in-the-arm yesterday after some comments from the RBA.
This can further push divergence between policy outlays in Australia and Japan. In Australia the RBA appears to be moving in a more-hawkish direction while the Bank of Japan has so far remained loose and dovish, even in the face of potentially stronger inflation, and this can allow the topside of the pair to remain as attractive from a fundamental basis.
Technically, however, the pair continues to struggle above the 85 level, much as it has for the past year when it was working for a breakout at the 80 psychological level.
From the weekly chart below there may be more scope for further bullishness, which would make this another possible risk-on setup to track in the Japanese Yen. AUD/JPY is working on an ascending triangle which is often approached with the aim of bullish breakouts.
And given that the pair has been resisting at or just above the 85 big fig for more than a year now, that zone may be softened enough to allow for breakouts on recurrent tests.
AUD/JPY Weekly Price Chart
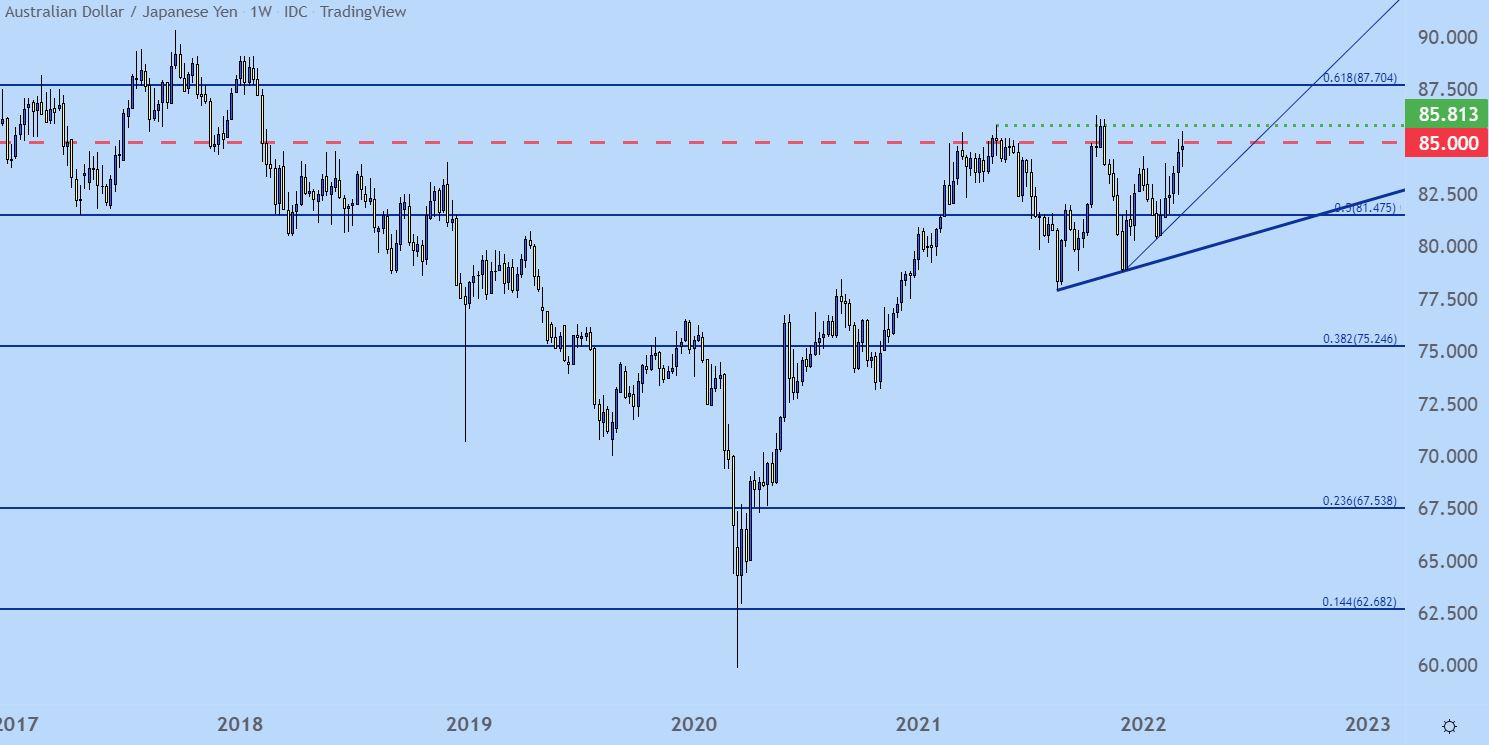
Chart prepared by James Stanley; AUD/JPY on Tradingview
— Written by James Stanley, Senior Strategist for DailyFX.com
Contact and follow James on Twitter: @JStanleyFX
Be the first to comment