

Japanese Yen, USD/JPY, US Dollar, BoJ, China, Fed, FOMC – Talking Points
- The Japanese Yen appears to have mixed messages for now
- Chinese New Year on the re-opening could provide stimulus
- The Fed are maintaining their message. Where will that send USDJPY?
Recommended by Daniel McCarthy
Get Your Free JPY Forecast
The Japanese Yen slipped lower today despite December CPI data hitting forecasts of 4% year-on-year for both the headline and core measures. Other currency markets have taken a breather so far today with narrow trading ranges.
10-year Japanese Government Bond (JGB) yields nudged below 0.40% today, well under the Bank of Japan’s ceiling of 0.50% that was left unchanged at their meeting earlier this week.
The broader story of China re-opening continues to provide mixed messages for markets. While a pro-growth slant is being reflected by elevated industrial commodity prices, Wall Street finished their cash session lower.
Perhaps that reflected the hawkish comments from Federal Reserve Vice Chair Lael Brainard that rates will need to stay high for a long period of time. She is seen as one the less hawkish members of the Federal Open Market Committee (FOMC).
APAC equities are a sea of green today with Hong Kong’s Hang Seng index leading the charge higher, rallying over 1%. Futures are pointing toward an upbeat start to the North American session.
Treasury yields are up a couple of basis points across the curve and the 2s 10s inversion remains around -0.76%.
Crude oil has steadied after yesterday’s gains with the WTI futures contract near US$ 80.50 bbl and the Brent contract above US$ 86 bbl.
Looking ahead, after UK retail sales, Canada will also see retails sales data and the US will get home sales numbers. Chinese New Year will see many Asian markets closed on Monday.
The full economic calendar can be viewed here.
Recommended by Daniel McCarthy
How to Trade USD/JPY
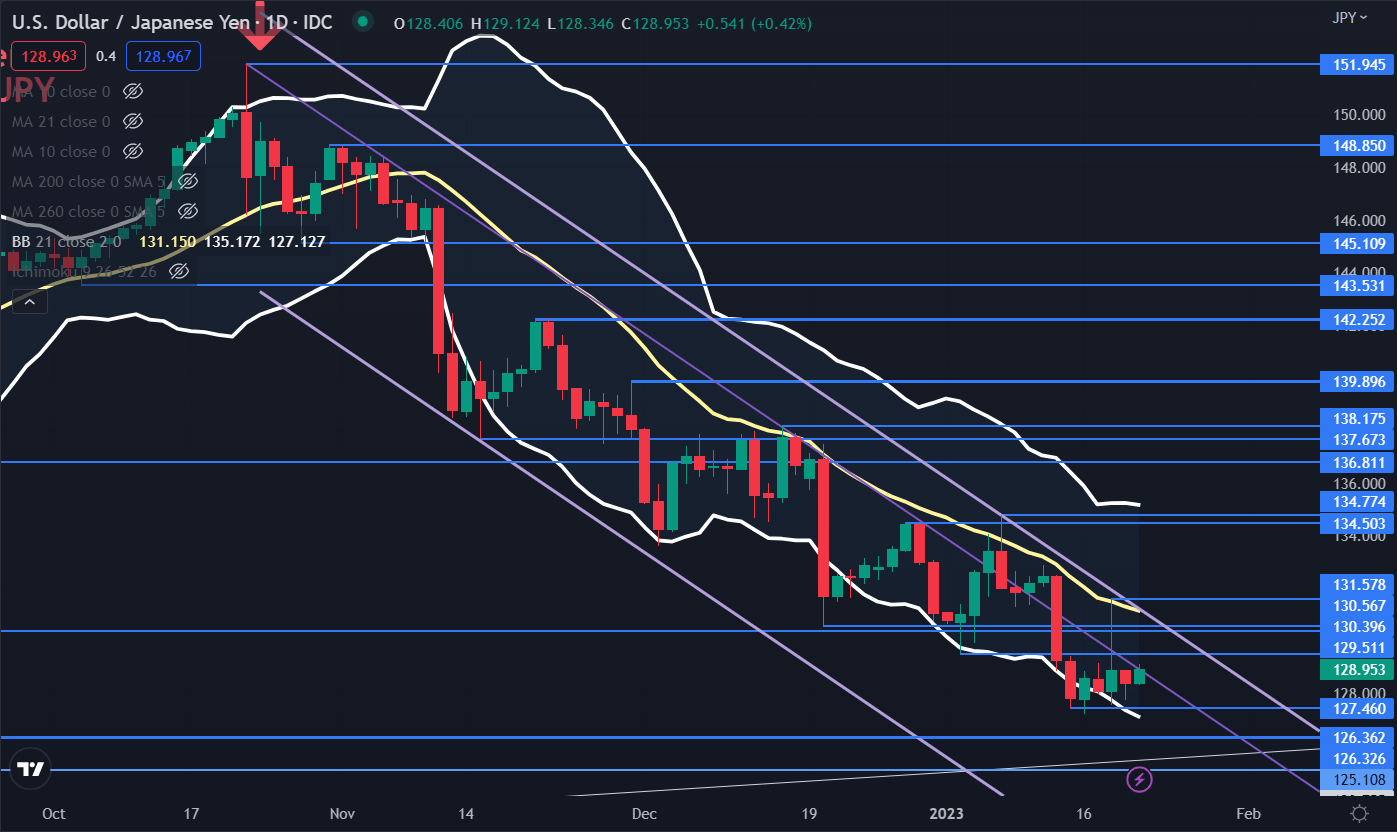
USD/JPY TECHNICAL ANALYSIS
USD/JPY remains within a descending trend channel after a week of consolidation.
It comes after a recent sell-off that broke below the lower band of the 21-day simple moving average (SMA) based Bollinger Band.
The sideways price action has unfolded after it closed back inside the band, and it might signal that the bearish run has paused and may open the possibility of a reversal.
Support could be at the previous lows of 127.46 and 126.36. On the topside, resistance might be at the breakpoints of 129.51, 130.40, 130.57 and the recent peak of 131.58.
The 21-day SMA currently coincides with a descending trend line at 131.20 and may also offer resistance.
— Written by Daniel McCarthy, Strategist for DailyFX.com
Please contact Daniel via @DanMcCathyFX on Twitter
Be the first to comment