

FangXiaNuo/iStock via Getty Images
This monthly article series shows a dashboard with aggregate industry metrics in consumer staples. It may also serve as a top-down analysis of sector ETFs like the Consumer Staples Select Sector SPDR ETF (XLP) and the iShares US Consumer Staples ETF (NYSEARCA:IYK), whose largest holdings are used to calculate these metrics.
Shortcut
The next two paragraphs in italic describe the dashboard methodology. They are necessary for new readers to understand the metrics. If you are used to this series or if you are short of time, you can skip them and go to the charts.
Base Metrics
I calculate the median value of five fundamental ratios for each industry: Earnings Yield (“EY”), Sales Yield (“SY”), Free Cash Flow Yield (“FY”), Return on Equity (“ROE”), Gross Margin (“GM”). The reference universe includes large companies in the U.S. stock market. The five base metrics are calculated on trailing 12 months. For all of them, higher is better. EY, SY and FY are medians of the inverse of Price/Earnings, Price/Sales and Price/Free Cash Flow. They are better for statistical studies than price-to-something ratios, which are unusable or non available when the “something” is close to zero or negative (for example, companies with negative earnings). I also look at two momentum metrics for each group: the median monthly return (RetM) and the median annual return (RetY).
I prefer medians to averages because a median splits a set in a good half and a bad half. A capital-weighted average is skewed by extreme values and the largest companies. My metrics are designed for stock-picking rather than index investing.
Value and Quality Scores
I calculate historical baselines for all metrics. They are noted respectively EYh, SYh, FYh, ROEh, GMh, and they are calculated as the averages on a look-back period of 11 years. For example, the value of EYh for food in the table below is the 11-year average of the median Earnings Yield in food companies.
The Value Score (“VS”) is defined as the average difference in % between the three valuation ratios (EY, SY, FY) and their baselines (EYh, SYh, FYh). The same way, the Quality Score (“QS”) is the average difference between the two quality ratios (ROE, GM) and their baselines (ROEh, GMh).
The scores are in percentage points. VS may be interpreted as the percentage of undervaluation or overvaluation relative to the baseline (positive is good, negative is bad). This interpretation must be taken with caution: the baseline is an arbitrary reference, not a supposed fair value. The formula assumes that the three valuation metrics are of equal importance.
Current data
The next table shows the metrics and scores as of last week’s closing. Columns stand for all the data named and defined above.
|
VS |
QS |
EY |
SY |
FY |
ROE |
GM |
EYh |
SYh |
FYh |
ROEh |
GMh |
RetM |
RetY |
|
|
Staple/Food Retail |
-23.44 |
-3.68 |
0.0287 |
2.0063 |
0.0179 |
17.81 |
19.09 |
0.0426 |
1.9151 |
0.0311 |
16.68 |
22.23 |
-4.58% |
-0.21% |
|
Food |
-16.52 |
0.27 |
0.0460 |
0.6077 |
0.0144 |
17.85 |
28.16 |
0.0459 |
0.6699 |
0.0242 |
15.38 |
33.32 |
-2.43% |
2.41% |
|
Beverage |
-8.33 |
-20.90 |
0.0311 |
0.2651 |
0.0158 |
18.06 |
44.41 |
0.0365 |
0.2678 |
0.0174 |
24.31 |
52.91 |
1.68% |
2.37% |
|
Household prod. |
-0.03 |
1.33 |
0.0836 |
1.2409 |
-0.0094 |
18.75 |
38.33 |
0.0454 |
0.8828 |
0.0379 |
17.21 |
40.88 |
-4.12% |
-39.11% |
|
Personal care |
-25.44 |
3.26 |
0.0322 |
0.3635 |
0.0118 |
19.72 |
63.05 |
0.0382 |
0.4539 |
0.0199 |
21.23 |
55.49 |
3.84% |
-13.54% |
|
Tobacco |
13.42 |
-42.36 |
0.0620 |
0.5232 |
0.0185 |
6.82 |
50.20 |
0.0588 |
0.4693 |
0.0150 |
34.66 |
52.51 |
5.88% |
6.51% |
Value And Quality Chart
The next chart plots the Value and Quality Scores by industry (higher is better).
Value and quality in consumer staples (chart: author; data: Portfolio123)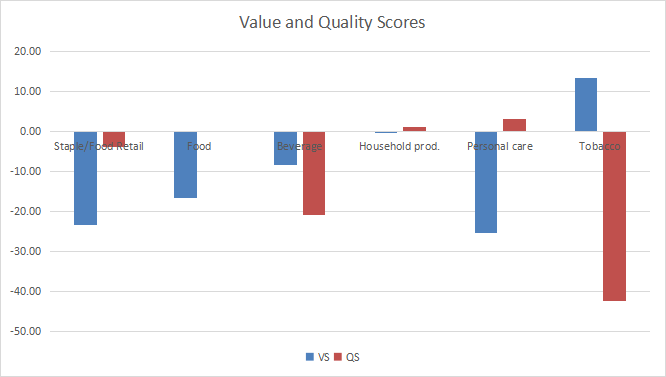
Evolution since last month
Valuation has improved in staple/food retail and household products, and has deteriorated in food, tobacco and personal care.
Score variations (chart: author; data: Portfolio123)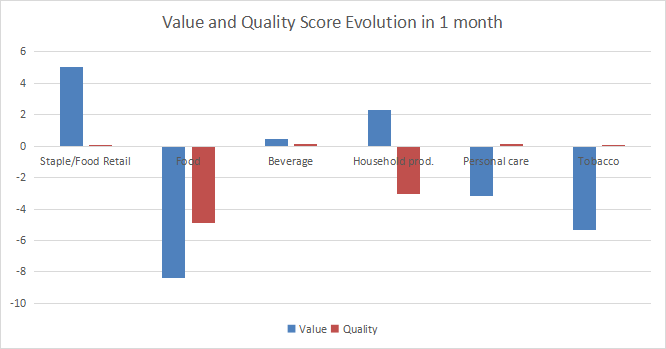
Momentum
The next chart plots momentum data.
Momentum in consumer staples (chart: author; data: Portfolio123)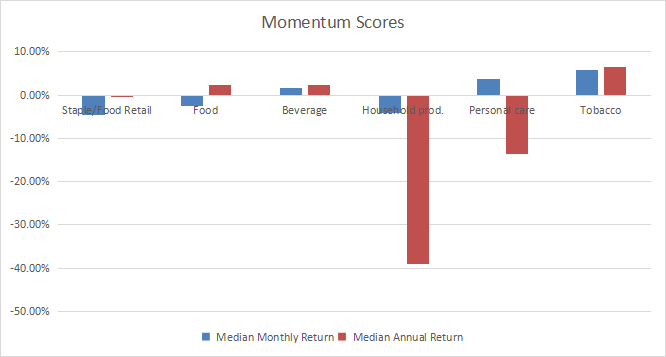
Interpretation
Household products look the safest subsector from a fundamental point of view: it is close to 11-year averages in both valuation and quality metrics. Tobacco is undervalued by about 13% relative to the historical baseline, but the quality score has fallen far in negative territory. A note of caution though: there are only five tobacco companies in this universe, so statistics may be less reliable than in other industries. Other subsectors are overvalued by 8% to 25% relative to their baseline, and their quality scores don’t justify such overvaluation.
IYK fast facts
The iShares US Consumer Staples ETF is tracking the Russell 1000 Consumer Staples RIC 22.5/45 Capped Index. The fund started investing operations on 6/12/2000. It has a 12-month distribution yield of 1.96% and a total expense ratio of 0.39%, which is significantly higher than for XLP (0.10%). Distributions are paid quarterly.
As described in the prospectus by iShares, it is a float adjusted capitalization-weighted index of consumer defensive stocks in the Russell 1000 index. Any single issuer’s weight is capped to a maximum of 22.5%, and the aggregate weight of issuers exceeding 4.5% is capped to a maximum of 45%.
As of writing, IYK holds 54 stocks of U.S. companies, mostly large and mega caps (about 82% of asset value is in these segments per Fidelity classification). The next table shows the top 10 with their growth, price/earnings ratios and dividend yields. Their aggregate weight is close to 65%. The fund is quite exposed to risks related to the top 4 names, which weigh between 7% and 16% individually, and about 45% together. They reach the maximum aggregate weight defined in the underlying index.
|
Ticker |
Name |
Weight% |
EPS ttm growth% |
P/E ttm |
P/E fwd |
Yield% |
|
Procter & Gamble Co. |
15.97 |
5.42 |
26.08 |
25.88 |
2.43 |
|
|
PepsiCo, Inc. |
11.25 |
19.20 |
25.79 |
26.63 |
2.55 |
|
|
The Coca-Cola Co. |
11.06 |
12.24 |
27.51 |
25.22 |
2.80 |
|
|
Philip Morris International, Inc. |
7.06 |
-2.36 |
17.86 |
17.56 |
5.07 |
|
|
CVS Health Corp. |
4.26 |
-58.79 |
40.49 |
11.07 |
2.54 |
|
|
Mondelez International, Inc. |
3.56 |
-28.23 |
29.42 |
22.59 |
2.33 |
|
|
Altria Group, Inc. |
3.46 |
73.84 |
18.09 |
9.62 |
8.08 |
|
|
Colgate-Palmolive Co. |
3.04 |
-26.74 |
33.91 |
26.20 |
2.42 |
|
|
McKesson Corp. |
2.64 |
146.88 |
26.41 |
15.04 |
0.58 |
|
|
General Mills, Inc. |
2.58 |
26.16 |
18.29 |
21.10 |
2.48 |
Ratios: Portfolio123
IYK has significantly outperformed XLP in total return since June 2000 (see next table). The difference in annualized total return is about 1.8 percentage points, despite higher management fees.
|
Total Return |
Annual.Return |
Max Drawdown |
Sharpe |
StdDev |
|
|
IYK |
666.35% |
9.47% |
-43.29% |
0.67 |
12.79% |
|
XLP |
424.61% |
7.64% |
-35.24% |
0.57 |
11.53% |
IYK has beaten XLP on the long-term, and also recently. It outperforms the Select Sector SPDR benchmark by over 15 percentage points in total return in 3 years (next chart), and by over 5 percentage points in 2022.
IYK vs XLP since January 2020 (Portfolio123)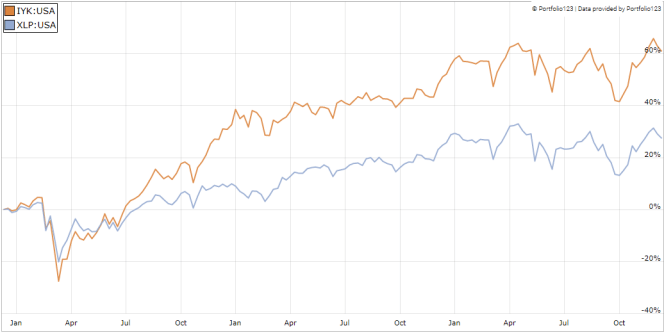
In summary, IYK is an ETF that is a good fund for investors seeking capped exposure to U.S. consumer staples companies. It holds more stocks than XLP (currently 54 vs. 34), and it is a bit less concentrated in the top 10 holdings (65% vs. 69%). Based on past performance, it seems the greater number of holdings associated with capped weights may provide excess return. Therefore, IYK may be a better choice than XLP for long-term investors, despite higher management fees. However, XLP is a better choice for tactical allocation and trading thanks to much higher trading volumes. The fund is significantly exposed to risks related to the top 4 holdings, which weigh 45% together. Investors who are concerned by this concentration may prefer the Invesco S&P 500 Equal Weight Consumer Staples ETF (RHS).
Dashboard List
I use the first table to calculate value and quality scores. It may also be used in a stock-picking process to check how companies stand among their peers. For example, the EY column tells us that a food company with an earnings yield above 0.0460 (or price/earnings below 21.74 is in the better half of the industry regarding this metric. A Dashboard List is sent every month to Quantitative Risk & Value subscribers with the most profitable companies standing in the better half among their peers regarding the three valuation metrics at the same time. The list below was sent to subscribers several weeks ago based on data available at this time.
|
USANA Health Sciences, Inc. |
|
|
Vector Group Ltd. |
|
|
Coca-Cola Consolidated, Inc. |
|
|
Pilgrim’s Pride Corp. |
It is a rotating list with a statistical bias toward excess returns on the long-term, not the result of an analysis of each stock.
Be the first to comment