

William_Potter/iStock via Getty Images
Investment Thesis
The iShares Russell Top 200 Growth ETF (NYSEARCA:IWY) is a leading fund in its category, selecting only the largest U.S. growth stocks with high growth potential. However, its lack of a valuation screen can prove problematic in risk-off environments like today. Therefore, this article evaluates IWY from a valuation perspective while considering trends in earnings surprises and analyst estimates to assess market sentiment. I think IWY’s valuation is still too high to support a buy recommendation, and it’s best to stay on the sidelines for now.
ETF Overview
IWY tracks the Russell Top 200 Growth Index, selecting the 200 largest companies by market capitalization from the Russell 1000 Index by:
- three-year change in EPS over the current price
- three-year sales per share growth rate
- momentum (one-year price change)
Apple (AAPL), Microsoft (MSFT), Amazon (AMZN), Alphabet (GOOGL, GOOG), and Tesla (TSLA) are the top five holdings, accounting for 47.5% of the ETF. The entire top 10 list is below.
iShares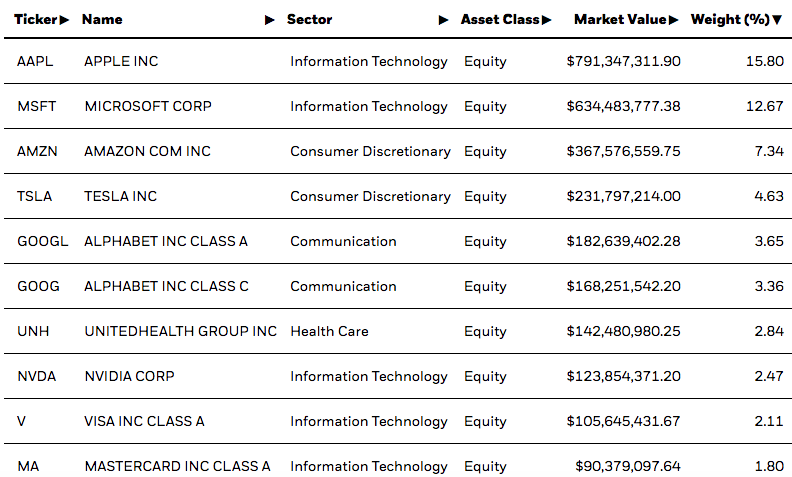
In the sector exposures table below, you can see IWY’s similarities with the iShares Russell 1000 Growth ETF (IWF). The key difference is an overweighting in Technology stocks by 3.15% at the expense of Health Care and Industrials.
Morningstar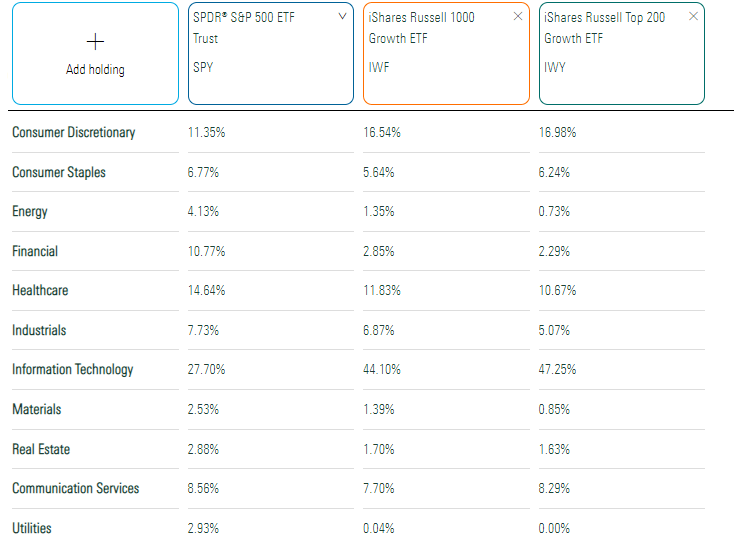
Compared with the SPDR S&P 500 ETF (SPY), IWY has 20% more exposure to Technology, accounting for most of its growth potential. Defensive sectors like Utilities have no exposure. Furthermore, inflation-friendly sectors like Energy and Materials are hardly represented. A play on IWY may make sense if you believe inflation has peaked and interest rates will decline soon. However, Chairman Powell’s Jackson Hole speech offered no such indication, so this would be an aggressive contrarian position and not one I share.
IWY’s track record since its September 2009 inception is excellent, gaining an annualized 15.74% compared to 14.99% and 13.10% for IWF and SPY. It’s underperformed QQQ by nearly 2% annually but is up 2% this year.
Portfolio Visualizer
IWY’s Valuation Problem
I have no issues with IWY’s holdings. Most are excellent companies likely to deliver solid returns in the long run. However, one recent commenter wrote that the days of “quality-at-any-price” are over, at least for now. I agree, and we must consider valuation and give ourselves a reasonable margin of safety.
IWY currently trades at 29.96x forward earnings, six points higher than SPY. Notably, the slightly higher EPS growth estimates (19.73% vs. 17.41%) don’t justify this premium. I’ve listed these and other growth-oriented metrics in the table below, highlighting IWY’s top 20 holdings.
The Sunday Investor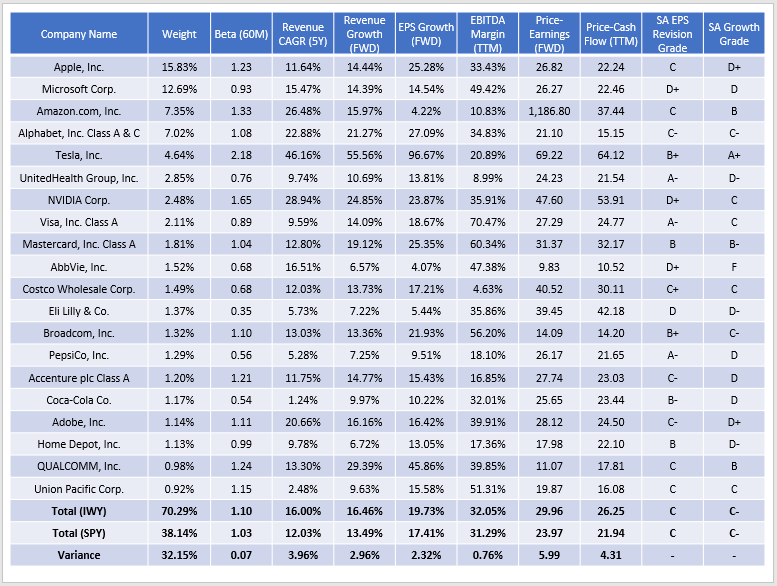
There are still several top holdings with high valuations, including Amazon, Tesla, and NVIDIA (NVDA). To calculate valuation metrics for the entire portfolio, I’ve capped these at 60, consistent with Morningstar’s methodology. Still, IWY overweights pricy stocks. Furthermore, there are few defensive or inflation-friendly stocks. Here are six not held by IWY and their YTD returns.
Seeking Alpha
The average gain is 9.30%, skewed heavily in favor of the oil giants. Still, all but JPMorgan Chase (JPM) are outperforming IWY, which is down 22.33% YTD. Worth noting is that the average forward price-earnings ratio is only 11.72, and analysts project an average 17.73% sales growth over the next year.
Turning back to IWY, it trades 4.31 points higher than SPY on a trailing cash flow basis. It’s more volatile, as indicated by a higher five-year beta (1.10 vs. 1.03), has nearly double the concentration in its top 20 holdings, and only offers investors slightly better sales and earnings growth.
Sentiment Is Between Neutral And Negative
Investors favor high-growth stocks when they have a reason to do so. Some analysts rely on technical signals to forecast market direction, but I think earnings surprises and analyst estimates are more reliable. Both these signals indicate a neutral sentiment at best, suggesting now isn’t the time to overweight high-risk assets.
Analyst Ratings
One of my favorite Factor Grades by Seeking Alpha is the EPS Revision Grade. I like that it’s based on outside consensus estimates, verifiable, and easy to interpret. Take Apple and its EPS Revision Grade of “C”; in the last three months, 12 analysts made upward EPS revisions, and 27 revised downward.
Seeking Alpha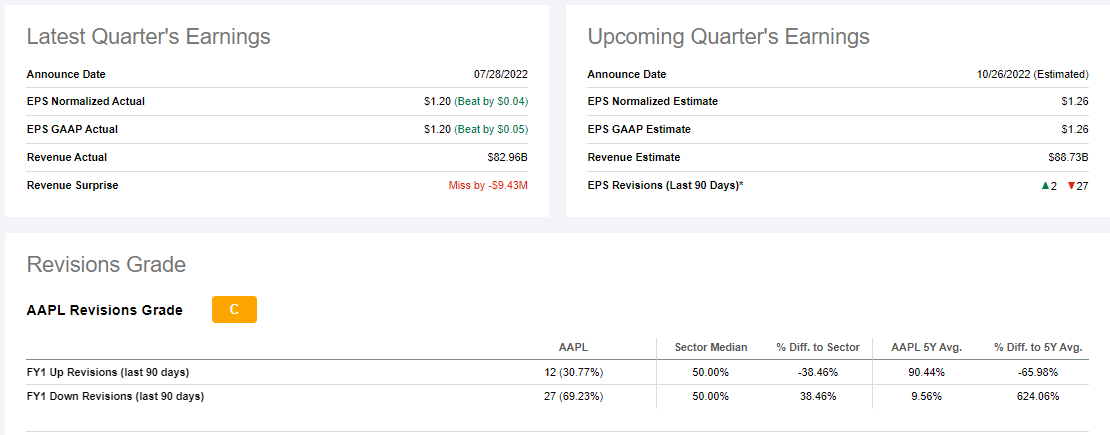
Apple’s rating hasn’t changed since January, which I documented here in an article on the Invesco QQQ ETF (QQQ). Perhaps that’s why it’s outperformed QQQ by 13% YTD. However, ratings for most other stocks have declined. In January, SPY had an average rating of “B-” compared to “C” today, a two-spot drop. Microsoft and Alphabet have led the decline, with their EPS Revision Grades falling from B and B+ to D+ and C-, respectively.
EPS Surprises
Why are analysts downgrading estimates? One reason is higher interest rates primarily impacting long-duration equities (i.e., growth stocks). Another reason is that lower earnings surprises lead analysts to pare back future growth expectations. Yardeni Research summarizes this data well.
Yardeni Research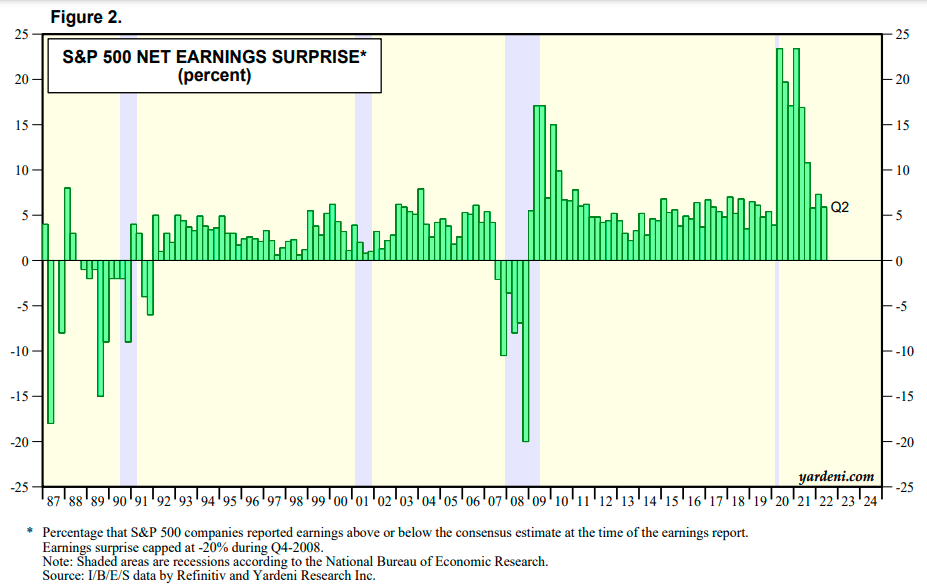
We’ve had three consecutive quarters of single-digit earnings surprises for the S&P 500 Index. Despite earnings surprises still being near the long-term average of 7.4%, the downward trend is undeniable. It will take time for the market to correct for the enormous gains many growth stocks had in 2020-21. This trend is one reason I’m not rushing to buy many risky stocks. At the same time, these results are far from disastrous, so I don’t believe a repeat of the Great Financial Crisis will occur. Instead, I view it as the market’s version of “The Great Reset.”
Investment Recommendation
IWY may be a top-performing large-cap growth ETF, but it’s simply too expensive. You may be surprised that IWY’s forward price-earnings ratio was 31.44 six months ago, only 1.48 points higher than today. Furthermore, IWY’s forward EPS growth rate declined to 19.73% from 24.65%, arguably making it a worse deal than in March.
I don’t think analyst revisions and earnings surprise trends support a risk-on environment, at least one strong enough to justify paying the premium IWY requires. Therefore, I recommend investors choose SPY, as they’re still getting solid earnings growth but for a much more reasonable valuation. Thank you for reading, and I hope to answer any questions in the comments below.
Be the first to comment