Torsten Asmus
ProShares UltraShort Oil & Gas ETF (NYSEARCA:DUG) (the “Fund”) seeks daily investment results, before fees and expenses, that correspond to two times the inverse (-2x) of the daily performance of the Dow Jones U.S. Oil & GasSM Index (the “Index”). Holding periods greater than one day “can result in returns that are significantly different than the target return, and ProShares’ returns over periods other than one day will likely differ in amount and possibly direction from the target return for the same period. These effects may be more pronounced in funds with larger or inverse multiples and in funds with volatile benchmarks,” according to ProShares.
The Index is designed to measure the stock performance of U.S. companies in the oil and gas sector. Component companies typically are engaged in the following activities related to the oil and gas sector, among others, exploration and production, integrated oil and gas, oil equipment and services, pipelines, renewable energy equipment companies and alternative fuel producers.
It is not possible to invest directly in an index. The purpose of the Fund is to provide investors with a financial product which matches the returns of the Index.
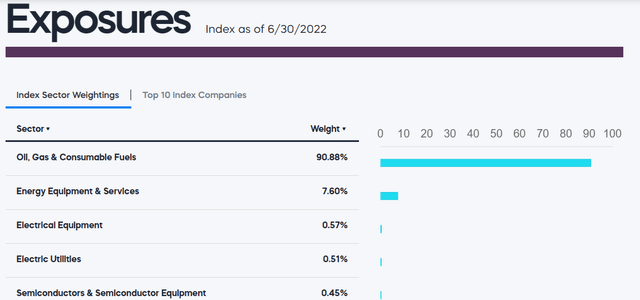
The exposures of the Index as of the end of June are listed below by weight. The largest sector by far (90.88%) is Oil & Gas and Consumable Fuels.
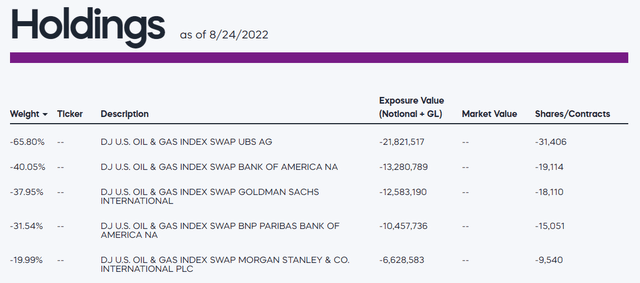
The five largest holdings are listed below. Together, they account for a weight of 195% of the 200% total. The largest holding (65.80%) is the DJ U.S. Oil and Gas Index Swap. ProShares defines a Swap Agreement as:
Contracts entered into primarily with major global financial institutions for a specified period ranging from a day to more than one year. In a standard “swap” transaction, two parties agree to exchange the return (or differentials in rates of return) earned or realized on particular predetermined investments or instruments. The gross return to be exchanged or “swapped” between the parties is calculated with respect to a “notional amount,” e.g., the return on or change in value of a particular dollar amount invested in a “basket” of securities or an ETF representing a particular index.
DUG has assets under management (“AUM”) of approximately $28 million and charges an Expense Ratio of 0.95%.
Seeking Alpha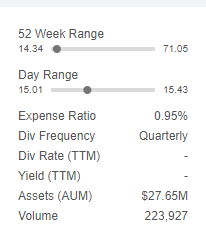
The operating expenses are further broken down in the table below.
ProShares (Expense Ratio)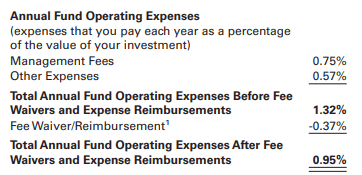
Seeking Alpha grades ETF Expenses and gave DUG an “F.”
Seeking Alpha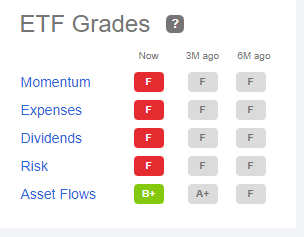
Principal Risks
ProShares provides a description of the risks of the Fund in its Prospectus.
Of particular note:
An investor in the Fund could potentially lose the full value of their investment within a single day.
And…
For periods longer than a single day, the Fund will lose money if the Index’s performance is flat, and it is possible that the Fund will lose money even if the level of the Index falls.
Performance
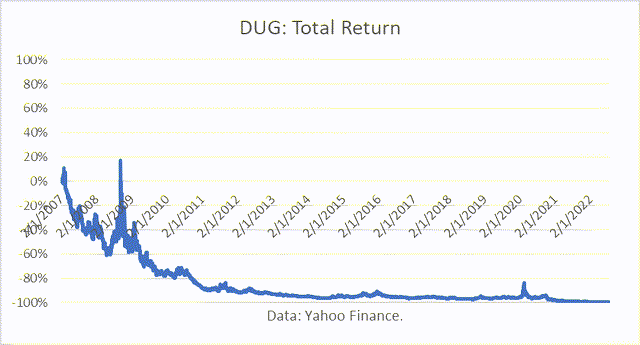
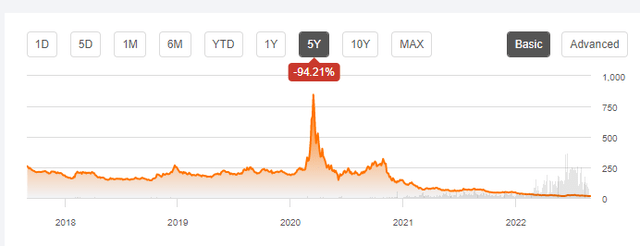
The Fund commenced trading in February 2007. Since inception, the Fund has lost 99.67 % of its value.
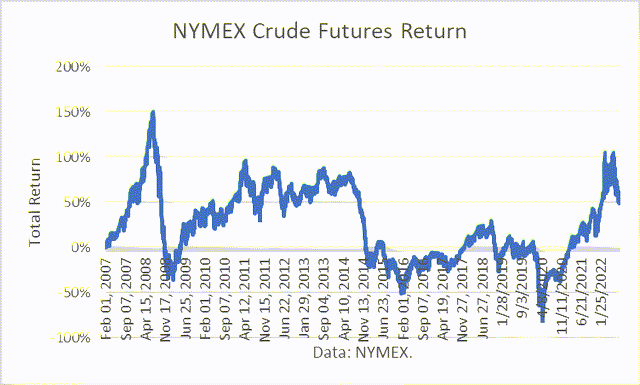
That compares to a return of 55% for a long position in NYMEX Crude Oil Futures (second nearby contract – excluding rolling costs). I wrote an article about DIG (DIG), an ultralong Oil and Gas ETF. It had lost 43% over the same period since inception.
Logically, it would seem that either a long or short would make money, not both lose money. The explanation is that the products are highly-leveraged and so if either has a had a large loss, that is the result.
It is difficult to recover due to high losses. For example, 50% loss requires a 100% gain to return back to the original return. That is why risk management is so important, to prevent large drawdowns.
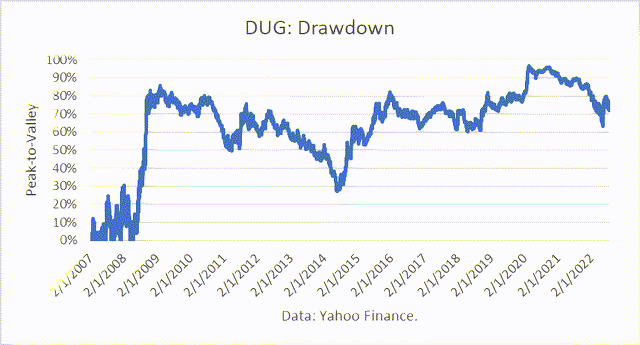
The Maximum Drawdown for DUG is virtually 100% since inception.
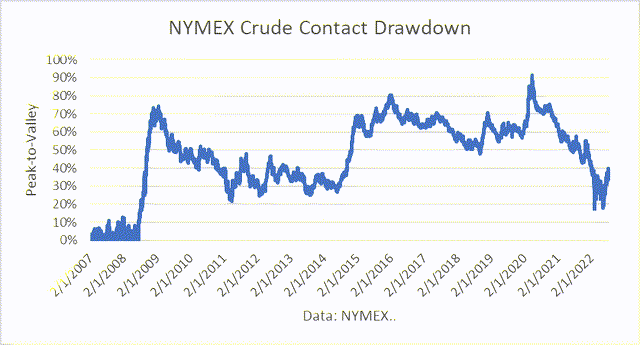
For the NYMEX contract, it was 92%.
But for short periods of time during price collapses, such as in April 2020, DUG provides profitable trading opportunities.
Conclusions
DUG is a leverage financial product focused on the oil and gas sector. It is a very high-risk product that should only be held by sophisticated investors, and then only for limited time periods. Under those conditions, it provides and opportunity for outsized returns. And so it is worth considering during such periods.
Looking forward, such an opportunity may present itself if and when the Iran nuclear deal is concluded. It has been recently reported that Iran may have about 93 million barrels in offshore storage they could sell when the deal is finalized and before they ramp-up their production by about 1 to 1.3 million barrels per day.
The Saudi oil minister had said maybe OPEC will cut back its production if Iran comes back into the market. But such a move would be highly criticized by their defender – the U.S.


Be the first to comment